*Corresponding author:Ivan Gregório Ivankovics
INTERNATIONAL JOURNAL OF CURRENT MEDICAL AND
PHARMACEUTICAL RESEARCH
ISSN: 2395-6429, Impact Factor: 4.656
Available Online at www.journalcmpr.com
Volume 5; Issue 07(A); July 2019; Page No. 4363-4370
DOI: http://dx.doi.org/10.24327/23956429.ijcmpr201907697
Research Article
EVALUATION OF QUALITY OF LIFE IN THE PRE-OPERATIVE AND POSTOPERATIVE
OF BARIATRIC SURGERY
Ivan Gregório Ivankovics
1*., Marcelo Regis Lima Corrêa
2and
Rui Manuel Lopes Nunes
31
General Surgeon in Hospital de Base Doutor Ary Pinheiro, Residence Preceptor at Government of the
State of Rondônia, Brazil
2
Federal University of Rondônia - Brazil
3
Professor in University of Porto School of Medicine - Portugal
ARTICLE INFO ABSTRACT
Over the last years, obesity has become a public health problem, both by the growing number of individuals affected and by the comorbidities related to this disorder. The evaluation of quality of life has become fundamental for making the decision about types of treatment. Objectives: analyze quality of life in two groups of patients: those with obesity class II and III, candidates for bariatric surgery, and patients already submitted to surgical treatment of obesity. The WHOQOL-Bref questionnaire was used. The general characteristics of the preoperative group were meanage of 38.68±9.43 years; 85 women and 19 men; mean weight of 126.64± 23.01 kg, and mean BMI of 47.41±7.98 kg/m². The general characteristics of the postoperative group were mean age of 40.33±9.38 years; 46 women and 9 men; mean weight of 72.14±14.53 kg, and mean BMI of 27.53±4.05kg/m². The results showed that in the preoperative group, the perception of quality of life, health satisfaction (HS/Q2), and the physical domain (PhyD) require improvement, whereas the psychological domain (PsD), social relationships (SR), and the environment are regular. In the postoperative group, Q1, Q2, PhyD, PsD, and SR are classified as good, and environment is classified as regular. When compared to the means and scores, there is a statistically significant difference between the groups in all variables studied. In all criteria considered, there was improvement in the quality of life conditions of the population studied. Therefore, the improvements generated by bariatric surgery on health conditions of the population allowed improvements in quality of life of the patients.
Copyright © 2019 Ivan Gregório Ivankovics et al. This is an open access article distributed under the Creative Commons Attribution License, which permits
unrestricted use, distribution, and reproduction in any medium, provided the original work is properly cited.
INTRODUCTION
Over the last few decades, obesity has become a public health problem in Brazil and worldwide. In Brazil, the rate of obese people rose from 11.8% to 18.9% within ten years, between 2006 and 20161. In its last report, published in 2017, the Organization for Economic Co-operation and Development (OECD) showed significant prevalence rates of obesity in its member countries. In the United States, for example, 31% of population is overweight, while 35% is obese2. In Portugal, overweight and obesity rates reach 34% and 22%, respectively3.
Obesity is a risk factor for the development of numerous diseases, such as hypertension and diabetes, among others. The strong relation between obesity and some types of malignant neoplasms is also known4. Within this context, a multicenter study conducted in the United Kingdom, in 2009, revealed a decrease in life expectancy by 2 to 4 years inpatients with obesity class II, and by 8 to 10 years in those with obesity class
III, showing the strongly negative impact on life expectancy on this group of individuals5.
By means of its quality of life working group, the World Health Organization (WHO) defines quality of life as the perception of the individuals of their position in life, within the context of culture and the value system in which they live, and relative to their objectives, expectations, standards, andconcerns6. It is vital to assess the quality of life of individuals or groups in order to understand how to meet the needs for promotion, prevention, and maintenance of health. Quality of life measurements can guide health professionals in making decisions about defining the best practices to be applied individually or to population groups. This study is based on contributing towards knowledge about quality of life of those patients awaiting bariatric surgery and those who have already been submitted to this procedure.
The quality of life working group of the World Health Organization (WHOQOL) developed a tool to assess quality of
Article History:
Received 13th April, 2019 Received in revised form 11th
May, 2019
Accepted 8th June, 2019
Published online 28th July, 2019
Key words:
life, involving several countries and cultures, entitled WHOQOL-100, which is already validated in Portuguese7,8. Considering the need for a simpler and more practical tool based on WHOQOL-100, the WHOQOL-bref9was developed. It is a questionnaire already validated by WHO, with the objective of evaluating quality of life6-12.
MATERIALS AND METHODS
In the period from January to December 2017, a total of 104 adult patients with obesity grades II and III, of both sexes, seen by the program of surgical treatment of obesity at the Hospital de Base Dr. Ary Pinheirodo Governo do Estado de Rondônia, and also at the private medical office of the author, agreed to answer the WHOQOL-BREF questionnaire translated into Portuguese. During the same period, 55 adult patients previously submitted to surgical treatment for obesity (laparoscopic gastric bypass), of both sexes, also seen by the program of surgical treatment for obesity at the Hospital de Base Dr. Ary Pinheirodo Governo do Estado de Rondônia, and by the private medical office of the author, answered the same questionnaire. All patients were operated on by the author and his team.
WHOQOL-BREF is a questionnaireal ready validated by WHO, which aims to evaluate quality of life by means of 26 facets, distributed into 4 domains: physical domain (PhyD), psychological domain (PsD), social relationships (SR), and environment (ENV). Questions01 and 02 (Q1 and Q2) objectively assess the perception of quality of life (QoL), and satisfaction with health (SH), respectively. The other 24 questions assess the four domains, by means ofspecific questions that define the evaluation6. The results of WHOQOL-Bref are evaluated by the means obtained for each facet (Q1 and Q2) and for each domain, according to the following classification: need to improve (1 to 2.9), regular (3 to 9), good (4 to 4.9), and very good (5). The data of each participant were inserted into an individual worksheet, on which sex, age, weight, and body mass index (BMI) were analyzed, with the answers to each question inserted into the domains. In the postoperative group, weight and BMI were also evaluated before surgery. After the individual assessment, the individual meansofQ1, Q2, and the individual means of each domain were calculated for each group.
Next, the calculations were made of the scores and descriptive statistics of WHOQOL-bref were made by means of Microsoft Excel13 (Table 5). Domain score calculations transform the values into a score of 0 to 100, in which the closer to 100, the better the interpretation of the domain within the context of quality of life. In this evaluation there was also a significant difference between the groups studied (Table 6).
In both groups, the schooling level of each participant was also evaluated and classified as incomplete primary education, complete primary education, incomplete secondary education, complete secondary education, incomplete university education, complete university education, and graduate studies.
Statistical Analysis
Initially, frequency tables and graphs were prepared, and descriptive measures for each variable of interest were calculated based on the group of patients assessed. Posteriorly, from the inferential point of view, the comparison between the preoperative and postoperative groups as to the numerical variables of interest was obtained by means of Student’s ttest
for unrelated samples. Calculations of the scores and descriptive statistics of the WHOQOL-bref were done using Microsoft Excel® software, following the syntax proposed by the WHOQOL identical to the Statistical Package for the Social Sciences (SPSS) software13.
RESULTS
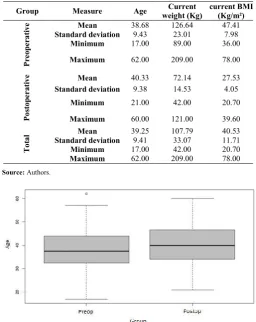
In the preoperative group, 104 patients participated in the study, 85 (81.7%) female and 19 (18.3%) male. Whereas in the postoperative group, 55 patients participated, in which 46 (83.6%) were females and 9 (16.4%) were males. The mean age of the group awaiting surgery was 38.68 years (standard deviation - SD 9.43; range 17-62), and of the postoperative group was 40.33 years (SD 9.38; range 21-62). The mean weight in the preoperative group was 126.64 kg (SD 23.01; range89-209), and in the postoperativegroup72.14 kg (SD 14.53; range 42-121).As to the BMI, the preoperative group presented with a mean of 47.41 kg/m² (SD 7.98; range 36-78), and the postoperativegroup,27.53 kg/m2 (SD 4.05; range 20.7-39.6). These data are compiled on Table 1 and their distributions are represented on Graphs 1, 2, and 3.
Table 1 Descriptive measures of the variables age, current weight and current BMI, for each group in the studied sample
Group Measure Age Current
weight (Kg)
current BMI (Kg/m²)
Preoper
a
ti
v
e Mean 38.68 126.64 47.41
Standard deviation 9.43 23.01 7.98
Minimum 17.00 89.00 36.00
Maximum 62.00 209.00 78.00
Po
stop
erati
v
e Mean 40.33 72.14 27.53
Standard deviation 9.38 14.53 4.05
Minimum 21.00 42.00 20.70
Maximum 60.00 121.00 39.60
To
tal
Mean 39.25 107.79 40.53
Standard deviation 9.41 33.07 11.71
Minimum 17.00 42.00 20.70
Maximum 62.00 209.00 78.00
Source: Authors.
Graph 1 Distribution of the variable age for each group in the studied sample
Graph 2 Distribution of the variable current weight for each group in the studied sample
Source: Authors.
Graph 3 Distribution of the variable current BMI for each group in the studied sample
Source:Authors
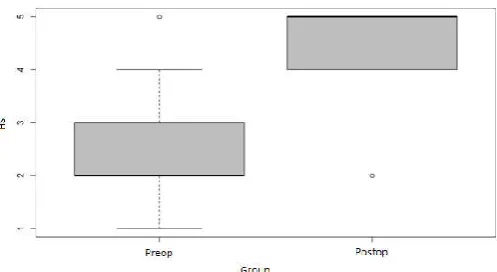
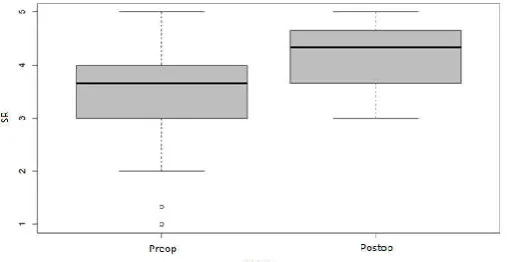
The descriptive measures of quality of life variables showed the following results: in the preoperative group, perception of quality of life (QoL) (Q1) presented a mean of 2.88 (SD 1.04; range 1-5), while in the postoperative group the mean was 4.62 (SD 0.53; range 3-5) (p=0.001). As to satisfaction with health (SS) (Q2), the mean in the preoperative group was 2.35 (SD 0.9; range 1-5), and in the postoperative group, the mean was 4.47 (SD 0.6; range 2-5) (p=0.001). Regarding physical domain, the means were2.6 (SD 0.66; range 1.14-4.14) and 4.27 (SD 0.41; range 3.28-5) (p=0.001), for the preoperative and postoperative groups, respectively. As regards to the psychological domain, the mean in the preoperative group was 3.14 (SD 0.76; range 1.16-4.66), and in the postoperative group, 4.24 (SD 0.36; range 3.3-5) (p=0.001). As to social relationships, in the preoperative group the mean was 3.45 (SD 0.8; range 1-5), whereas in the postoperative group, the mean was 4.17 (SD 0.61; range 3-5) (p=0.001). Concerning the environment, the means were 3.1 (SD 0.58; range 1.5-4.5) and 3.92 (SD 0.43; range 3-5) (p=0.001), in the preoperative and postoperative groups, respectively. These data are compiled on Table 2, with their descriptive distributions presented on Graphs 4 to 9. The comparison between the pre- and postoperative groups is detailed on Table5, which shows the differences between the groups and the respective confidence intervals.
Table 2 Descriptive measures of the variables QoL (Q1), HS (Q2), PhyD, PsD, SR and ENV for each group in the studied
sample
Group Measure QoL (Q1) HS (Q2) PhyD PsD SR ENV
Preoper
ativ
e
Mean 2.88 2.35 2.60 3.14 3.45 3.10
Standard
deviation 1.04 0.90 0.66 0.76 0.80 0.58 Minimum 1.00 1.00 1.14 1.16 1.00 1.50
Maximum 5.00 5.00 4.14 4.66 5.00 4.50
Po
stop
erati
v
e Mean 4.62 4.47 4.27 4.24 4.17 3.92
Standard
deviation 0.53 0.60 0.41 0.36 0.61 0.43 Minimum 3.00 2.00 3.28 3.30 3.00 3.00
Maximum 5.00 5.00 5.00 5.00 5.00 5.00
To
ta
l
Mean 3.48 3.08 3.18 3.52 3.70 3.38
Standard
deviation 1.22 1.30 0.99 0.84 0.81 0.66 Minimum 1.00 1.00 1.14 1.16 1.00 1.50
Maximum 5,00 5,00 5,00 5,00 5,00 5,00
Source: Authors.
Graph 4 Distribution of the variable QoL for each group in the studied sample
Source: Authors.
Graph 5 Distribution of the variable HS for each group in the studied sample
Source: Authors
Graph 6 Distribution of the variable PhyD for each group in the studied sample
Graph 7 Distribution of the variable PsD for each group in the studied sample
Source: Authors.
Graph 8 Distribution of the variable SR for each group in the studied sample
Source: Authors
Graph 9 Distribution of the variable ENV for each group in the studied sample
Source: Authors
Table 3 Results of comparison of the preoperative and postoperative groups, per each numerical variable studied
Descriptive
level Difference Confidence interval
Age 0.296 1.64 -1.46 4.75
Current weight 0.001 -54.50 -60.41 -48.60
Current BMI 0.001 -19.89 -21.77 -18.00
QoL 0.001 1.74 1.50 1.99
HS 0.001 2.13 1.89 2.36
PhyD 0.001 1.67 1.50 1.84
PsD 0.001 1.11 0.93 1.28
SR 0.001 0.71 0.49 0.94
ENV 0.001 0.82 0.66 0.98
Source: Authors
When transformed into scores, the descriptive measurements displayed the following results: in the preoperative group, perception of quality of life (Q1) presented with mean of 2.89 (SD 1; range 1-5), and in the postoperative group, the mean was 4.62 (SD 0.53; range 3-5) (p=0.001); satisfaction with health (Q2), the mean in the preoperative group was 2.37 (SD 0.9; range 1-5), whereas in the postoperative group, 4.47 (SD
0.6; range 2-5)(p=0.001); physical domain, in the preoperative group, presented with a mean score of 40.25 (SD 16.56; range 3.57-78.57), while in the postoperative group, the score was 81.36 (SD 10.28; range57.14-100)(p=0.001). As to psychological domain, the preoperative group had a mean score of 54.01 (SD 18.64; range 4.17-91.67), and the postoperative group, 81.14 (SD 8.05; range 58.33-95.83)(p=0.001); for social relationships the means scores were 61.22 (SD 20.57; range 0-100) and 79.24 (SD 15.12; range 50-100) (p=0.001) in the preoperative and postoperative groups, respectively; as to environment, the preoperative group presented with a score of 52.26 (SD 14.52; range 12.5-87.5), whereas the postoperative group the score was 73.01 (SD 10.73; range 50-100)(p=0.001). The data were pooled on Table4, and Table5shows a comparison between the groups with regard to quality of life, with a list of the differences and the respective confidence intervals.
Table 4 Descriptive measures of scores of the variables related to quality of life for each group in the studied sample
Group Q1 Q2 PhyD PsD SR ENV
Pr
eo
p
era
tive
Mean 2.89 2.37 40.25 54.01 61.22 52.26
Standard
deviation 1.00 0.90 16.56 18.64 20.57 14.52
Minimum 1.00 1.00 3.57 4.17 0.00 12.50
Maximum 5.00 5.00 78.57 91.67 100.00 87.50
Postoper
ative
Mean 4.62 4.47 81.36 81.14 79.24 73.01
Standard
deviation 0.53 0.60 10.28 8.05 15.12 10.73
Minimum 3.00 2.00 57.14 58.33 50.00 50.00
Maximum 5.00 5.00 100.00 95.83 100.00 100.00
To
tal
Mean 3.49 3.09 54.47 63.39 67.45 59.44
Standard
deviation 1.20 1.29 24.49 20.40 20.69 16.58
Minimum 1.00 1.00 3.57 4.17 0.00 12.50
Maximum 5.00 5.00 100.00 95.83 100.00 100.00
Source: Authors.
Table 5 Results of comparison of scores between the groups regarding quality of life
Descripti
ve level Difference
Confidence interval
Q1 0.001 1.72 1.48 1.96
Q2 0.001 2.11 1.87 2.35
PhyD 0.001 41.12 36.90 45.33
PsD 0.001 27.13 22.93 31.33
SR 0.001 18.02 12.36 23.69
ENV 0.001 20.76 16.74 24.77
Source: Authors.
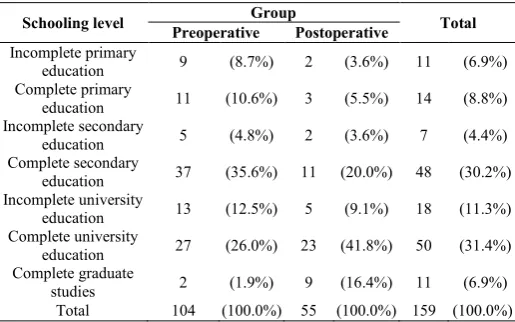
Table 6 Distribution of the variable level of schooling for each group in the studied sample
Schooling level Group Total
Preoperative Postoperative
Incomplete primary
education 9 (8.7%) 2 (3.6%) 11 (6.9%)
Complete primary
education 11 (10.6%) 3 (5.5%) 14 (8.8%)
Incomplete secondary
education 5 (4.8%) 2 (3.6%) 7 (4.4%)
Complete secondary
education 37 (35.6%) 11 (20.0%) 48 (30.2%)
Incomplete university
education 13 (12.5%) 5 (9.1%) 18 (11.3%)
Complete university
education 27 (26.0%) 23 (41.8%) 50 (31.4%)
Complete graduate
studies 2 (1.9%) 9 (16.4%) 11 (6.9%)
Total 104 (100.0%) 55 (100.0%) 159 (100.0%)
Source: Authors.
DISCUSSION
It is true that obesity is a public health problem in Brazil and around the world, with constant growth in the last few years, and a risk factor for numerous diseases. According to Mac Kinsey Global Institute (2015), Brazil spends 2.4% of the gross domestic product (GDP) with obesity, representing nearly 110 million Reals, whereas in the world, the estimated cost is of 2.8% of the GDP with obesity, adding up to 5.2 trillion Reals14. This expense may be direct or indirect, including treatments, admissions to hospitals, and public policies of fighting against obesity. Additionally, the repercussions brought by obesity can also be responsible by the loss of or reduction in productivity, since in many situations they may decrease the working capacity of those affected by the problem, besides favoring a drop in life expectancy by up to 10 years5.
These numbers and statements indicate a vigorous need for public policies directed towards the resolution of the problems of obesity, whether they be measures of prevention, treatment, and maintenance of health in this group, including care for their basic and everyday needs, such as urban mobility, medical hospital care, public awareness of the problem, recreational and leisure activities, and social inclusion. Within this context, urban transportation means are not in accordance with the true needs of this population, just as the healthcare centers do not have the structure and equipment required for the care of obese patients, compromising the principle of equity and universality. In this case, Ferreira (2011)15, in a master’s degree thesis developed at the Medical School of the Universidade do Porto, entitled “The Principle of Equality and the Obese Person within the Hospital Context: The Issue of Equipment”, reveals lack and inadequacy of equipment directed towards the care of this population.
In addition to this, it is known that the obese individual suffers discrimination from society; their image is related to discouragement, carelessness, and an unwillingness, which is not true. We cite as an example the study of Levriniand Papa (2016)16, which had the purpose of verifying the perception of obese women relative to their treatment and opportunities in organizations. Moreover, it aimed to understand how the stigma of obesity influences work relationships, and demonstrated those individuals classified as obese reported discrimination and frustration with companies, due to unequal treatments and different opportunities and salaries at the work
place. Besides corroborating such a rationale, the study by Agra et al. (2016)17, with the objective of investigating the perception of obese women regarding their bodies, and its influence on their daily and emotional lives, also found dissatisfaction with one’s own body in the population studied, supposing the physical and psychological as inseparable, as well as the recognized social discrimination and restriction, including difficulties in maintaining emotional and sexual relationships, leading to social isolation.
In this way, evaluating quality of life in this population is extremely important, as it can indicate practices and policies geared towards the perfecting of prevention and treatment techniques, or methods of approaching the problem. The analysis of clinical data and quality of life before and after any therapeutic measure can substantiate the implantation of adequate and effective treatments, allowing the enablement of financial, material, and human resources for training the multidisciplinary team, acquisition of equipment, and adjustments of the physical structure that such procedures demand. To this end, the WHOQOL-Brefis a simple, understandable, accessible method, and it evaluates important domains in the extent of the problem, including the physical and psychological contexts, social relationships, and environment, compiling information that will aid in decision-making.
The results of this study demonstrate that the quality of life in the group of obese patients classes II and III, who await surgery needs to improve when the physical ( ̅=2.6) and psychological ( ̅=3.14) domains are considered, and is regular in the social relationships ( ̅=3.45) and environment ( ̅=3.10) domains. Whereas in the postoperative group, all means of domains indicate a good quality of life (physical domain:
̅
=4.27; psychological domain: ̅=4.24; social relationships:
̅
=4.17; environment: ̅=3.92). In the factors linked to perception of quality of life and satisfaction with health, the results found for the preoperative patients show that there is need for improvement (perception of quality of life: ̅=2.88; satisfaction with health: ̅=2.35), while in the postoperative group, the results display a good quality of life (perception of quality of life: ̅=4.62; satisfaction with health: ̅=4.47). Within this context, when means are transformed into scores, it was evident that the best result in the postoperative group for all criteria: the physical domain presented with a mean difference of 41 points, psychological domain of 27 points, social relationships 18 points, and environment, 21 points. Additionally, when comparing the pre- and postoperative groups, a statistically significant difference was noted in all quality of life variables, suggesting a better quality of life in the postoperative group. Therefore, the data demonstrate that there was improvement in quality of life in all domains studied, suggesting an advantage in the performance of the bariatric surgery for the population studied.
bariatric surgery at the Faculdade de Medicina do ABC, verified a significant increase in quality of life in the physical, psychological, and environmental (p<0.0001, p=0.001, and p=0.009, respectively) domains, but not in the social domain (p=0.081). Moreover, this study allowed the perception of reduction in the psychiatric symptoms, and the use of psychoactive substances after surgical treatment. Further, Moraes et al. (2014)20, in a study of 16 patients with morbid obesity who would be submitted to bariatric surgery at a private organization in the State of Rio Grande do Sul, perceived that the quality of life, health, feelings, satisfaction, and capacity to perform things improved after bariatric surgery. In this study, 25% of patients reported their quality of life and health as poor or very poor in the preoperative phase, while in the postoperative, all evaluated perception of quality of life and satisfaction with health as good or very good. Another example is the study by Toledo et al. (2010)21, with the purpose of assessing quality of life and satisfaction of 36patients submitted to bariatric surgery, and of investigating comorbidities in the population studied, and found a beneficial influence of bariatric surgery on quality of life, satisfaction of the patients, control of obesity, and decrease of associated comorbidities.
In addition to the WHOQOL-Bref, other protocols may be applied for the evaluation of quality of life in the population studied. Among several protocols, we draw attention to the Short-Form Health Survey (SF-36) and the Bariatric Analysis and Reporting Outcome (BAROS), which are the most often used in this type of research22. SF-36 is an instrument for generic health evaluation, and is made up of 36 questions, covering eight components: functional capacity, physical aspects, pain, general health status, vitality, social aspects, emotional aspects, and mental health. These are evaluated by 35 questions, besides one more comparative question between current health conditions and those of the previous year23. BAROS was developed to standardize the studies about the results of bariatric operations, by analyzing the results of the five main aspects: weight, comorbidity, quality of life, complications, and reoperations24. In this protocol, quality of life is evaluated by The Moorehead-Ardelt Quality of Life Questionnaire, which is included in BAROS. Nevertheless, despite being a simple and easily applied tool, it can only be utilized after weight loss, since it evaluates in what way the life of the individual changed after weight loss25.
Despite being different protocols, both aim to evaluate quality of life, and various investigations have presented with results similar to those found in this study. In an integrative revision performed by Oliveira et al. (2018)22, in which the objective was to analyze the scientific production from 2009 to 2014 about obese individuals during the postoperative period of bariatric surgery, as well as its repercussion on quality of life, a total of 39 projects were studied, using diverse protocols to reach the objective of the research. Among the 39 projects, 34 used SF-36 or BAROS for the analysis. In general, this revision concluded that bariatric surgery promoted improved quality of life.
It is important to point out that one cannot justify the improvement in quality of life of the population studied merely because of bariatric surgery. Nonetheless, the main modifying factors after surgery are weight and BMI, which are related, when lower, with a decrease in comorbidities, facilitating the performance of activities of daily living, and improvement in social relationships. Within this context, this study found a
preoperative mean BMI of 47.41 and postoperative of 27.53, presenting with a reduction of the BMI greater than other similar studies, but with very close resulting values. For example, Oliveira et al. (2009)26, Siqueira et al. (2016)27, and Maia et al. (2018)28 showed values close to those above in the preoperative phase, with means of 44±4.7 kg/m2, 48.1±7.41 kg/m2, and 50.1±8.37 kg/m2, respectively. Similarly, the postoperative results also presented with values close to those in studies by Siqueira et al. (2016)27and Maia et al. (2018)28, i.e., 32.5±5.25 kg/m2and 35.7±7.09 kg/m2, respectively. Therefore, the surgical procedure presents, direct or indirectly, strengths related to improving patient’s quality of life.
Regarding sex, there was a predominance of females, accounting for 81.7% (n=85). This fact corroborates with that found in other similar studies, such as Rangel et al. (2007)29, Oliveira et al. (2009)26, Sousa and Johann (2014)18, Barros et al. (2015)30, Siqueira et al. (2016)27, Silva et al. (2017)31, and Maia et al. (2018)28, which found a prevalence of the female sex, respectively, 76.6%, 84.4%, 68.75%, 84.6%, 85%, 72.84%,and 84%. Such fact may be influenced by the greater rate of obesity occurring among women32, besides the fact that they most often seek weight loss treatments33, and who suffer greater social pressure due to the standards of beauty34. Within this context, Farinholt et al. (2013)35 perceived that, even though the severity and frequency of complications related to being overweight seem greater in men, women seek surgical treatment four times more.
Regarding age, the population studied presented with general mean of 39.25, in which 38.68 is in the preoperative group and 40.33 in the postoperative group, data that corroborate other studies. For example, Maia et al. (2018)28 reported a mean age of 46±9.45 years; Barros et al. (2015)30 described means of 35.47±9.51 years and 40.53±10.03 years, in the preoperative and postoperative groups, respectively; Siqueira et al. (2016)28found a mean of 40.6±10.82 years; Cunha et al. (2010)36,43.1±7.7years; and Oliveira et al. (2009)26, 38.4±8.9 years. Hence, one can infer a preponderance in the search for bariatric surgery in patients at this stage of life, albeit younger patients are increasingly searching this procedure37.
There are scarce studies addressing the education levels of patients submitted to bariatric surgery26; they merely explain the data quantitatively and not qualitatively. In the population studied, there was predominance of complete university education (31.4%), followed closely by complete secondary education (30.2%). Patients with incomplete university education (11.3%) ranked third. By and large these findings are similar to those found in other studies, in which most patients have complete secondary education21,26,30,38. On the other hand, in the study of Maia et al. (2018)28, there was a predominance of the population with in complete primary education, followed by patients with complete secondary education. Thus, even if one may infer a predominance of the more educated population, there are local factors that can influence the schooling level of patients submitted to surgical treatment of obesity.
CONCLUSION
The analysis of the data allowed inferring there was a statistically significant difference between the pre-and postoperative groups for all criteria - weight, BMI, quality of life and perception of quality of life. In all criteria considered by WHOQOL-Bref, there was improvement in quality of life conditions of the population studied. We deducted, therefore, that the improvements generated by bariatric surgery in the health conditions of the population, enabled enhancing quality of life of patients.
There are no conflicts of interests.
References
1. Ministério da Saúde (BR). Vigitel Brasil 2016 Saúde Suplementar: vigilância de fatores de risco e proteção para doenças crônicas por inquérito telefônico. Brasília: Ministério da Saúde, 2017.
2. OECD. OECD OBESITY UPDATE 2017 [Internet]. 2017 [cited 2019 Jun 11]. Availabe from http://www.oecd.org/health/health-systems/Obesity-Update-2017.pdf.
3. Lopes C et al. National food, nutrition, and physical activity survey of the portuguese general population (2015-2016): protocol for design and development. JMIR Res Protoc. 2018;7(2): e42.
4. Melo ME. Doenças desencadeadas ou agravadas pela obesidade [Internet]. 2011[updated 2019Jun 11]. Available
fromhttp://www.abeso.org.br/uploads/downloads/28/55 21afaf13cb9.pdf.
5. Prospective Studies Collaboration, Whitlock G, Lewington S, Sherliker P, Clarke R, Emberson J, Halsey J, Qizilbash N, Collins R, Peto R. Body-mass index and cause-specific mortality in 900 000 adults: collaborative analyses of 57 prospective studies.Lancet. 2009;373(9669):1083-96.
6. The Whoqol Group. The development of the Word Health Organization quality of life assessment instrument (the WHOQOL). In: Orley J, Kuyken W, editors. Quality of life assessment: international perspectives. Heidelberg: Springer Verlag; 1994. p 41-60.
7. Fleck MPA, Louzada S, Xavier M, Chachamovich E, Vieira G, Santos L et al. Aplicação da versão em português do instrumento de avaliação de qualidade de vida da organização mundial da saúde (WHOQOL-100). Rev Saúde Pública.1999;33:198-205.
8. Fleck MPA, Fachel O, Louzada S, Xavier M, Chachamovich E, Vieira G et al. Desenvolvimento da versão em português do instrumento de avaliação de qualidade de vida da organização mundial da saúde (WHOQOL-100). RevBras Psiquiatr.1999;21:19-28. 9. The Whoqol Group. Development of the Word Health
Organization WHOQOL-bref. Quality of life Assesment. Psychol Med.1998;28:551-8.
10. The Whoqol Group. The World Health Organization quality of life assesment (WHOQOL): development and general psychometric properties. Soc Sci Med.1998;46:1569-85.
11. World Health Organization. WHOQOL Rating scales. Geneva: WHO; 1993.
12. World Health Organization. WHOQOL Study protocol. Geneva: WHO; 1993.
13. Pedroso B, Pilatti LA, Gutierrez GL, Picinin CT.Calcuçation of scores and descriptive of WHOQOL-bref through Microsoft Excel. Revista Brasileira de Qualidade de Vida. 2010;2(1):31-36.
14. Dobbs R, Mnyika J. The obesity crisis: The Cairo Review of Global Affairs [Internet]. 2015 [Update 2015 Jul 5; cited 2019 Jun 11]. Available from https://www.mckinsey.com/mgi/overview/in-the-news/the-obesity-crisis.
15. Ferreira CSM. O principio da igualdade e a pessoa obesa em contexto hospitalar: a questão dos equipamentos [dissertação]. MestradoemBioética da Faculdade de Medicina da Universidade do Porto-Portugal, 2011.
16. Levrini L.A obesidade nas organizações: o preconceito não declarado. Revista Organizações em Contexto. 2016;12(24):165-191.
17. Agra G,Araújo LLLM,Pessoa VVB,Filho JJ,Freire MEM,Formiga NS. Percepção de mulheres obesas em relação ao seu corpo. Revista Ibero-americana de Saúde. 2016;2(3):774-793.
18. Sousa KO, Johann RLVO. Cirurgia bariátrica e qualidade de vida. Psicol. Argum. 2014;32(79):155-164.
19. Tae B et al. O impacto da cirurgia bariátrica nos sintomas depressivos e ansiosos, comportamento bulímico e na qualidade de vida. Rev. Col. Bras. Cir. 2014;41(3):155-160.
20. Moraes JM, Caregnato RCA, Schneider DS. Qualidade de vida antes e após a cirurgia bariátrica. Acta Paul Enferm. 2014; 27(2):157-64.
21. Toledo CC, Camilo GB, Guimarães RL, Moraes FR, Júnior CS. Qualidade de vida no pós-operatório tardio de pacientes submetidos à cirurgia bariátrica. Rev. APS. 2010;13(2):202-209.
22. Oliveira LSF, Mazini Filho ML, Venturini GRO, Castro JBP, Ferreira MEC. Repercussões da cirurgia bariátrica na qualidade de vida de pacientes com obesidade: uma revisão integrativa. Revista Brasileira de Obesidade, Nutrição e Emagrecimento. 2018;12(69):47-58.
23. Ciconelli RM. Tradução para o português e validação do questionário genérico de avaliação de qualidade de vida “Medical OutcomesStudy 36-Item Short-Form Health Survey (SF-36)” [tese]. Escola Paulista de Medicina, Universidade Federal de São Paulo. São Paulo, 1997.
24. NicaretaJR Novo BAROS: análise crítica da metodologia e sugestões para aprimoramento do BAROS (BariatricAnalysisnndReportingOutcome System) [tese].Universidade Federal do Paraná. Curitiba, 2010.
25. Oria HE, Moorehead MK. Bariatric analysis and reporting outcome system (BAROS). Obesity Surgery. 1998;4(5):487-499.
26. Oliveira APF, Malheiros CA, Santos AS, Jesus SR, Manuel J. Perfil de pacientes submetidos à cirurgia bariátrica atendidos em um hospital universitário do
município de São Paulo. SaúdeColetiva
2009;06(35):275-279.
2016; Porto Alegre, Brasil.ClinBiomed Res; 2016. p. 1475.
28. Maia RP, Silva PCC, Duarte ACS, Costa RM. Nutritional profile and quality of life assessment after bariatric surgery in a public hospital of Goiania, Brazil. Demetra. 2018;13(1):147-164.
29. Rangel LOB, Faria VSP, Magalhães EA, Araújo ACT, Bastos EMRD. Perfil de saúde e nutricional de pacientes portadores de obesidade mórbida candidatos à cirurgia bariátrica. Rev Bras Nutr Clin. 2007;22(3):214-9.
30. Barros LM, Moreira RAN, Frota NM, Araujo TM, Caetano JA. Quality of life among morbid obese and patients submitted to bariatric surgery. Rev. Eletr. Enf.2015;17(2):312-21.
31. Silva S et al. Gastrectomia vertical calibrada no tratamento da obesidade mórbida: resultados a longo prazo, comorbilidades e qualidade de vida. Rev. Port. Cir. 2017; 40: 11-20.
32. World Health Organization. Overweight and obesity. Fact sheet. 2015; 311.
33. Lucena AA. Análise da qualidade de vida dos obesos mórbidos no pré e pós-operatórios de cirurgia bariátrica[monografia]. Universidade Federal de Sergipe, Aracaju, Brasil, 2008.
34. Baptista MN, Vargas JF, Baptista ASD. Depressão e qualidade de vida em uma amostra brasileira de obesos mórbidos. Avaliação Psicológica. 2008; 7(2): 235-247. 35. Farinholt GN, Carr AD, Chang EJ, Ali MR. A call to
arms: obese men with more severe comorbid disease and under utilization of bariatric operations. Surg Endosc. 2013; 27: 4556-4563.
36. Cunha SFC, Sanches M, Faria A, Santos JE, Nonino-Borges CB. Evolução da massa corporal magra após 12 meses da cirurgia bariátrica. Rev. Nutr. 2010; 23(4): 535-541.
37. Silva PTet al. Perfil de pacientes que buscam a cirurgia bariátrica.ABCD, arq. bras. cir. dig. 2015; 28(4): 270-273.
38. Germano ACPL, Camelo CMBM, Batista FM, Carvalho NMA, Liberali R, Coutinho VF. Perfil nutricional dos pacientes submetidos à cirurgia bariátrica e dos critérios adotados para encaminhamento em um Hospital De João Pessoa, PB. Ensaios e Ciência: CiênciasBiológicas, Agrárias e da Saúde. 2010; 14(2): 43-59.
How to cite this article:
Ivan Gregório Ivankovics et al (2019) 'Evaluation of Quality of Life in the Pre-Operative and Postoperative of Bariatric Surgery ', International Journal of Current Medical and Pharmaceutical Research, 05(07), pp 4363-4370.