International Journal of Mechanical & Mechatronics Engineering IJMME-IJENS Vol:15 No:01 32
Effect of Inlet Distortion on the Performance of an
Axial Cascade
Dr. Basharat Salim
Associate Professor King Saud University, Riyadh11421, Riyadh, Saudi Arab
Abstract-- A cascade is defined as an infinite row of equidis-tant similarly aerofoil bodies. The cascade is used to divert a flow stream with a minimal loss. The flow over an axial cascade pre-sents a complicated intra blade fluid dynamic interaction that causes the flow to behave differently than the flow over a single aerofoil blade. A cascade tunnel in which different shapes of cas-cades could be tested for performance evaluation has been build. An axial flat plate cascade of 70 mm chord, 215 mm span and 0.55 pitch chord ratio has been tested in this tunnel for evaluat-ing its aerodynamic performance. The distortion in the flow ahead of the cascade row was artificially created by using dis-torters of the outer size same as the cross section of the cascade tunnel and were fixed with the help of air tight flanged connec-tions at a location which was four chords ahead of the cascade. The distorters were made from honey comb sheets and were formed into cutouts of four shapes. The present study aims to investigate the effect of inlet flow distortion on the performance of an axial two dimensional cascade. The results depict that the Reynolds number, incidence and blade angle of the cascade con-trol the aerodynamic performance of the axial cascade. Further the experimental values of lift coefficient are less than that ob-tained using theory and the drag coefficients are more than the theoretical values. The aerodynamic parameters of the cascade, deflection, deviation, loss coefficients etc, have been found to depend on both the Reynolds number and the type of distortion.
Index Term-- Distortion, performance, cascade, deflection, deviation, drag, lift, coefficients
NOMENCLATURE AR Aspect Ratio
b Length or Height of Cascade c Chord of the cascade blades Cd Drag coefficient ( )
Cl Lift Coefficient
( )
Cp Static pressure rise coefficient i Incidence angle i =α1-β1,
l Blade span P Total pressure p Static pressure
R Reynolds number
V
w
R
fs Pitch
V total velocity w Width of duct y height of duct α Flow angle β Blade angle
δ Deviation angle δ =α2-β2, ε Deflection angle ε =α1-α2
ξ Total pressure loss coefficient
ρ Air density
Subscript 1 cascade inlet
2 Cascade outlet
m Mean
f Free stream
1 INTRODUCTION
International Journal of Mechanical & Mechatronics Engineering IJMME-IJENS Vol:15 No:01 33
152501-7474-IJMME-IJENS © February 2015 IJENS
inlet flow conditions. Therefore understanding of cascade flow would result in systematic improvement of the aerodynamic art for design of such passages.
There have been many attempts to find solution of these prob-lems. Roundbash (1) Scholz (2) and Gostalow (3) have dis-cussed the summary of these works. Compusty ( 4) has reported the work of Felix and Emery (5) in which it has been suggested that the shape of a compressor blade has an insig-nificant effect on its performance at low mach numbers. Their tests on C4 and NACA65 series cascades revealed same re-sults. Bacur(6) studied the flow development in S shaped pro-files in a cascade tunnel. Andrews (7) has found out that the camber line shape, leading edge radius, and thickness chord ratio have small effect on the performance of a cascade. Serovy, et al. (8) have carried out detailed investigation of inter-passage flow in a baseline and modified versions of a two stage axial compressor and have observed similarities in their aerodynamic performance. Pullen and Harrvey (9) have arrived at a loading parameter for an axial flow turbine cas-cade by taking sweep of the blade into account. They have validated their results with the experimental results of linear cascade tests of low pressure ratio axial turbine. Kalpatrick and Barrows (10) have tested cascades of varying aspect ratio from 1.5 to 3. Mustaphe, et al. (11) have presented the re-sults of an off design performance of a turbine cascade at its midspan with varying Mach numbers, Reynolds numbers and incidences. Nagasaki and Yamsaki (12) have developed a CFD code to compute unsteady aerodynamic forces on a vi-brating annular cascade and have compared it with the linear-ized theory and have found the two to be almost similar. Sun, Q. and Boyd, I.D, [13] investigated gas flow over a flat plate airfoil at very low Reynolds number and found that minimum drag at an angle of 100 and the drag increased with the de-creasing Reynolds number. There have been many theoretical and experimental studies on flow over a single aerofoil and wing. Rodoslav and Roger (14) have studied flow over NACA 0012 aerofoil using DES procedure. Hazarika, etal. (15) have carried out CFD analysis of flow over an aerofoil with varia-tions in the inlet flow. Varess, etal. (16) have used inverse method in the analysis of internal flow and flow in cascades. The design of an axial turbomachine and axial compressor in particular usually presupposes a uniform flow at its inlet however this assumption is never realized. The installation of a turbomachine normally involves some form of ducting to direct the flow which may involve bends, boundary layer buildups and even some obstacles on the flow path that lead to the nonuniform flow at the inlet of such machines. Inlet dis-tortion could also be due to wakes of stays in a compressor, guide vanes or adjacent rows. The placement of such tur-bomachines itself like that in aircrafts may lead to excessively distorted flow at their inlet distortion. The shape of inlet par-ticularly in case of twin duct side wing or under wing air in-takes is also a major cause of the flow non-uniformity. This flow non uniformity in the flow of such machines is called inlet distortion. This could be either in radial in nature or cir-cumferential. The inlet distortion has been reported by Seo, et
al. (17) to cause noise and vibration in the engines. Conrad and Sobolewsky (18) have determined the performance of a complete turbojet engine under various shapes of radial distor-tion. Seo, et al. (17) have carried out flow measurements on inlet flow distortion and its attenuation in an axial compressor with radial and circumferential distortions. The development and effect of distorted flow in straight channels has been of wide interest. Owen and Zienkiewics (19) have proposed a simple method of obtaining a two dimensional flow distortion in a duct by placing a section of parallel rods, perpendicular to the direction of the flow, in which the distance between the adjacent rods varies in the y direction. Another method to de-velop the strong constant shear flow was dede-veloped by Woo and Cermak (20). They have put a pair of closely spaced shaped gauzes at the upstream of the flow. First gauze had non-uniform porosity whereas the second had uniform porosi-ty. Maull and Young (21) have used curved sheet of wire gauze in the flow channel to produce the non-uniform flow distribution. Ahmed and Lee (22) have used a shaped honey-comb technique to produce the linear shear flow. Liu, et al. (23) have used perforated plates to generate the distortion. They used nine plates having a combination of three solidity values and three hole values for this study. Their results showed a development of a shear flow with very low level of turbulence. In the present investigation the method of Ahmed and Lee (22) has been modified to incorporate the actual situ-ations as encountered in a turbomachine.
Inlet distortion has been contemplated to be taking place in total pressure distribution and total velocity distribution. There have been many ways to demonstrate the formation and anal-ysis of total pressure distortion coefficient. Ariga, et al (24) have used distortion index as the criteria for measuring the inlet flow distortion. O' Neil et al (25) has used concept of shock loss for the same. Kim, et al. (26) have quantified in terms of mass rate averaged value of normal velocity, pres-sure, flow angle and their respective value of standard devia-tion. Another form of distortion index has been proposed by
Wright, et al. (27) in terms of total pressure loss coefficient. Similar method has been adopted by Salim (28) for both total
velocity and total pressure distortions. The present study aims to investigate the effect of inlet flow distortion on the perfor-mance of an axial two dimensional cascade. The perforperfor-mance characteristics of the cascade with different distortions at the inlet will be investigated experimentally. The distortion has been created by using different shapes of honey comb cut outs with the aim to partially block the flow of air so as to create the inlet flow distortion.
2 EXPERIMENTAL SETUP
International Journal of Mechanical & Mechatronics Engineering IJMME-IJENS Vol:15 No:01 34 end to control the flow rate through the cascade tunnel. The
cup can be moved into the cone by an axial movement system. The cup can fully close the valve. A circular duct of diame-ter 270 mm is fitted at the exit of the blower. The duct is con-nected to a settling chamber. The settling chamber has three parts. The inlet part is of diffusing section with inlet of diam-eter 270 mm where as its exit is rectangular of size 680mm x 600 mm. This diffusing section is connected to the middle part which is further divided into three portions of size 680mm x 600 mm and length 190 mm. These parts are connected tightly and wire gauze is fitted at each connection. These gauzes re-duce the turbulence of the flow emerging out of the blower. The exit of the settling chamber is a rectangular converging duct of inlet size 680mm x600mm and exit of size 220mm x 210mm. The converging section is connected to a small rec-tangular duct of size 220mm x210mm and length 200 mm. This duct is in turn connected to the rectangular test section of size 220mm x 210 mm and length 300 mm. The test section is fabricated from Perspex sheet of 12mm thickness. All the ducts etc are made from sheet metal. The test section dis-charges the air to the atmosphere. The cascade row is fitted at the end of the test section. The cascade row was made to ro-tate from -100 to +100 by a moving mechanism which kept the pitch of the blades same all through. The blades of the cascade were made from stainless steel sheet of I mm thickness. The blades had 70 mm chord, 215 mm span and a pitch chord ratio of 0.55.
The distortion in the flow ahead of the cascade row was artifi-cially created by using distorters of the outer size same as the cross section of the cascade tunnel and were fixed with the help of air tight flanged connections at a location which was four chords ahead of the cascade. The distorters were made from honey comb sheets. The configuration c1 did not have any distorter ahead of cascade row whereas configuration c2 had a full honey comb sheet covering the full test section of the tunnel. The configuration c3 had a central cut out of the size of half the area of test section whereas configuration c4 had outer cut out of half the size of the test section. Two of these were able to partially block 50% of the cascade passage where as the third one partially blocked the full passage. The 50% distorters distorted the inlet velocity profile where as the full distorters acted like a filter. The fourth configuration was without any distorter. The shape of the distorters and the no-menclature of the configurations is given in table (1).
3 RESULTS AND DISCUSSION
The present investigations were carried out to establish the dependence of the performance of a linear cascade on the inlet flow distortion that was created artificially by placing distort-ers in front of the row of linear cascade. Karanja and Saydistort-ers (29) and Wolf and Jhonston (30) have documented that pres-ence a diffuser downstream of a straight duct reconfigures the flow upstream of it in that duct. This becomes more urgent in case where the straight duct is blocked by the cascade row. Hence it becomes necessary to determine a position which can represent free stream location. Therefore traverses of velocity
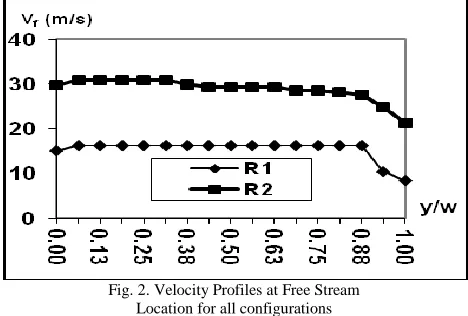
probe were carried out upstream of the diffuser and a location was found where the velocity profile would match the normal velocity profile in a rectangular duct. The free stream condi-tion of symmetrical flow behavior was found at a distance of 1.75 times the width of the diffuser. This was taken as a free stream location for all the configurations tested. The meas-urement of velocity profile at this location yielded almost a uniform velocity profile although the passage of the diffuser except very near the wall. This was taken as a free stream lo-cation for all the test conditions. The inlet velocity profile in the free stream region of the cascade for the four configura-tions is shown in figures (2). These profiles were measured by traversing a standard NPL. These investigations were carried out at two flow rates corresponding to the free stream Reyn-olds numbers for 2.26x10⁵ and 2.52x10⁵. These Reynolds numbers are based on the dimensions of the inlet duct. All the results are reported at these two Reynolds numbers. The inlet velocity profile for different configurations was measured at a distance of six chords upstream of the leading edge of the cascade. The output of the probe was read on an inclined ma-nometer. Figure (3) show the inlet velocity profiles for these configurations at the two Reynolds numbers. These figures show almost uniform velocity for the configurations c1 and c2 with a little non uniformity at the walls which can be attribut-ed to the wall effect of the tunnel. The c3 configuration which had an outer side opening and blockage on inner side showed lesser velocities at the central part of the traverse where as the configuration c4 showed the reverse trend, higher velocities on the inner side and lower values of velocities at the outer part. These velocity profiles clearly showed the velocity dis-tortion of the inlet flow particularly for configuration c3 and c4. The distortion produced by these combinations can be grouped into three categories. Full distortion causes, a filtered flow through the honeycomb of which it is made of, and no distortion configuration is a situation without any artificial distortion. These two types can be said to be distortion free cases. These two types of inlet flow generate almost symmet-rical and uniform velocity profile at the inlet of the cascade. The other two cases of distortion, inner (c3) and outer distor-tion (c4), creates an asymmetrical flow at the inlet of the cas-cade. The asymmetrical flow at the inlet of the cascade gener-ates more distortion of the flow.
Variation of Flow and Performance Parameters:- The flow
International Journal of Mechanical & Mechatronics Engineering IJMME-IJENS Vol:15 No:01 35
152501-7474-IJMME-IJENS © February 2015 IJENS
cascade. The probe output was measured with the help of an inclined water manometer. The different flow and perfor-mance variables for the cascade were calculated using two dimensional cascade aerodynamics (3). The full performance of axial cascade without any distortion, c1 configuration, has been presented in (31). This paper reveals the effect of inlet distortion on the performance of axial cascade.
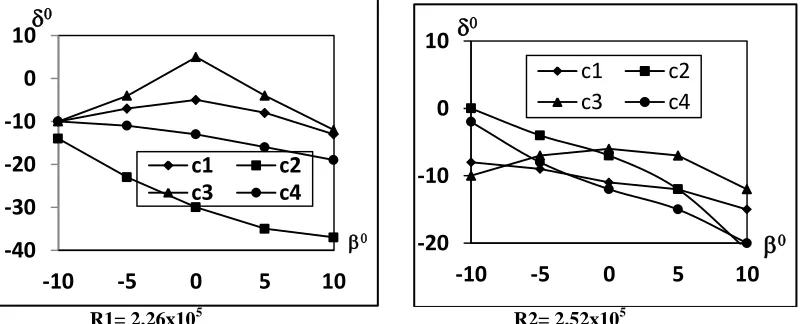
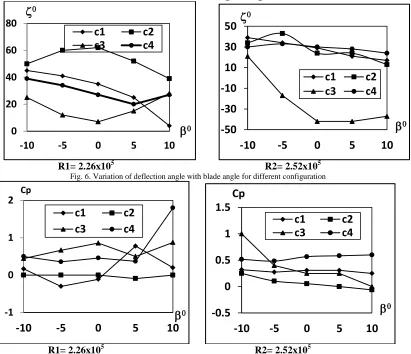
Figure (4) reveals the variation of the angle of incidence with the blade angle at two Reynolds numbers. The angle of inci-dence is defined as the difference between the flow angle and blade angle at the inlet of the cascade. These depict that the angle of incidence decreases with the blade angle at both Reynolds numbers for all configurations except configuration c3 for which it decreases up to zero blade angle and then it increase again with the blade angle. At lower Reynolds number the variation of the incidence values at different blade angles is more than the higher Reynolds number. This varia-tion in values is expected because of the gross difference in the flow distortion at the inlet of the cascade which is more at lower Reynolds number than at higher number. Configura-tion c4 having tip distorConfigura-tion has higher values of incidence than other configurations. Figure (5) shows the variation of deviation angle with the blade angle at two Reynolds numbers. The deviation angle is the difference between the flow angle and the blade angle at the exit of cascade row. At lower Reyn-olds number the deviation angle for configuration c1 decrease up to zero blade angle and there after it increases again. At higher Reynolds number it progressively decreases with the blade angle. For other configurations a continuous decrease of deviation angle with blade angle is evident. The difference in values of deviation angle for various configurations is more observed at lower Reynolds number which can be due to higher effect of distortion at lower flow rate. A maximum in-cidence of 350 is observed, for c1 configuration, at lower Reynolds number. At higher Reynolds number the deviation decreases with incidence and achieves a maximum value of 200 for a deviation angle of -80. The deviation of the flow is observed to decrease with the increase in Reynolds number and the blade angle. Figure (6) shows the variation of de-flection angle with the blade angle at two Reynolds numbers. The deflection angle is the difference between the flow angles at the inlet and the exit of cascade row. The deflection angle for configurations c1 and c4 is seen to decrease with the in-crease the blade angle. For configuration c2 the deflection angle at lower Reynolds number is observed to increase up to zero blade angle and then decrease where as for c3 it shows the reverse trend. At higher Reynolds number both the con-figurations behave in the similar manner as other two config-urations. The deflection seems to be governed by the distor-tion shapes and velocity profiles. For the configuradistor-tions with almost uniform velocity along the cascade length, c1 the de-flection angle uniformly decreases with blade angle.
Variation of static pressure rise coefficient through the cas-cade at the two Reynolds numbers is presented in figure (7). It shows that in configuration c1 the variation at lower Reynolds number is of a wavy form showing lowest and highest values
at blade angles of ±50. The variation for other configurations is seen to be small and of rising nature. At higher Reynolds number all the configurations depict a slight decrease in the values of Cp with the increase in the blade angle. This behav-ior indicates that both the change of blade angle and the shape of distorter effect the variation and the magnitudes of static pressure rise in the cascade passage.
The variation of total pressure loss coefficient at two Reynolds numbers along the passage through the cascade is presented in figures (8). At lower Reynolds number the total pressure loss coefficient for configurations c1 and c3 is minimum at zero blade angle where as it increases both for the positive and negative values of the blade angle. For c2 configurations it increases with the blade angle and for c4 configuration it de-creases with the blade angle. At higher Reynolds number the total pressure loss coefficient is almost invariant with the blade angle. The least changes in the values total pressure loss coefficient is an indicator of stable behavior within the passage creates such fluid dynamic conditions that give rise to losses. The fact that the variations in case of c1 configura-tions are small in comparison to the other configuraconfigura-tions shows that the distortion at the inlet of the cascade changes the flow behavior with its passage that results in increases total pressure loss coefficient.
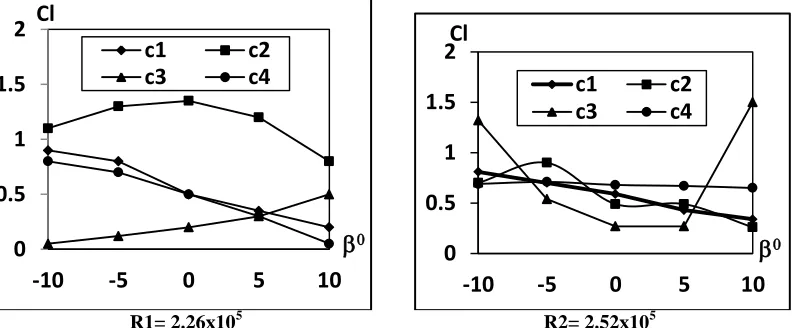
Figure (9) presents variation of lift coefficient at two Reynolds numbers for these configurations. The lift coefficient is ob-served to decrease with the blade angle for the configurations c1 and c4. Configuration c3 shows an increase of lift coeffi-cient with blade angle at lower Reynolds numbers and para-bolic variation at higher Reynolds number with minimum at zero blade angles. Configuration c2 depicts a parabolic vari-ation at lower Reynolds number with minimum at zero blade angles and consistent decrease of lift coefficient with the blade angle at higher Reynolds number. When compared with the variations of incidence with blade angle it is observed that the lift coefficient will increase with the incidence for configura-tions c1 where the inlet flow is not distorted. This variation is typical of a linear cascade. Other two configurations c2 and c3, show a different behavior with the incidence due to per-turbed nature of inlet flow as indicated by inlet velocity pro-files for these configurations. Thus the inlet flow distortion is seen to cause the changes in the lift producing capabilities of the cascades.
The drag coefficient variations of the cascade, shown in figure (10), indicates that at lower Reynolds number the drag is minimum at zero blade angle for configurations c1,c2 and c3and increase at the lower and higher values of the blade angle in a shape of cup. For configuration c4 it decreases with the blade angle and hence should increase with incidence which is the normal case. But at higher value of Reynolds number the drag coefficient is almost invariant with blade angle for all the configurations.
International Journal of Mechanical & Mechatronics Engineering IJMME-IJENS Vol:15 No:01 36 case. Lanzafame, et al. [32] have obtained the following
em-pirical formula for the lift coefficient and the drag coefficient. Cd = Cdmax sin2α. For a flat plate Cdmax = 2.0
Cl= Clmax sin α cos α where Clmax = 2πα
Using this empirical result the comparison between achieved results and theoretical results is presented in figure (14(b)) for drag coefficient. The results depict that the measured drag is more than that obtained from the theory. It is due to the fact that the theory considers only a single plat in a infinite control volume that is unaffected by the presence of other elements of the cascade and the tunnel wall boundaries. Comparative lift coefficient variations are presented in figure (14(a)). This fig-ure also shows that the experimental values of lift coefficient are lesser than the theoretical values of the lift coefficient. The reasoning for this result is also that the theoretical results rep-resent a flat plat aerodynamics in an infinite space which is not true for the cascade. A comparison of the results has also been made with the momentum theory and lifting line theory [33] for a flat plate. The lift coefficient and drag coefficient by these theories are given as under.
Lifting Line theory Cl= 0.11*α0 Momentum theory Cl = π ARα
The drag in both cases is given as
π
Where AR is aspect ratio of the cascade = b/c
The comparison of these results also shows that the theoretical values of lift coefficient are higher than the experimental values whereas theoretical drag coefficients are lower than the ex-perimental values. This is because the cascade performance of an aerofoil section or flat plate is different, rather degraded, than when the same is placed in infinite surroundings.
4 Conclusions:-
From the investigations it has been found that under the con-ditions of the test the angle of incidence for all the configura-tions decreases with the blade angle. The variation in angle of incidence is more at lower Reynolds number than the other one. The deviation of the flow is observed to decrease with the increase in Reynolds number and the blade angle for all con-figurations. The deflection seems to be governed by the dis-tortion shapes and velocity profiles. The flow is found to de-flect less at higher blade angles and flow rate. Both the change of blade angle and the shape of distorter effect the variation and the magnitudes of static pressure rise in the cascade pas-sage. At higher Reynolds number a small change is observed in the values of Cp with the change in the blade angle whereas almost no changes are observed with the angle of incidence. The distortion at the inlet of the cascade changes the flow be-havior with its passage that results in increases total pressure loss coefficient. At higher Reynolds number the total pressure loss coefficient is almost invariant with the blade angle. The inlet flow distortion is seen to cause the changes in the lift and the drag of the cascades. The lift coefficient is observed to
decrease with the blade angle. The drag coefficient, blade an-gle and the incidence are interrelated to each other.
ACKNOWLEDGEMENT
This project was supported by King Saud University, Dean-ship of Scientific Research and Research Center College of Engineering.
REFERENCES
[1] Roundebush, W. H., Potential Flow in Two Dimensional Cas-cades, Chapter IV of “Aerodynamic Design of Axial Flow Com-pressors”, NASA Sp 36- US government printing office, Wash-ington Dc,- 1965.
[2] Scholz, N, Aerodynamics of Cascades, AGARDograph No 220 – Nato Science and Technology organization, Amsterdam – 1977. [3] Gostlow J.P., Cascade Aerodynamics, Pergaman Press, Oxford
,1984.
[4] Cumpsty N.A., “Compressor aerodynamics”, Longman Scientific and Technical, England, UK, 1989.
[5] Felix A. and Emery J. “A comparison of typical NGTE and NACA axial blade compressor blade sections in cascades at low speeds” NACA TN 3937, US government printing office, Wash-ington Dc, (1957).
[6] Baciu I.D. " A “S” Profile Axial Cascade Tested in a Wind Tun-nel” International Conference on Hydraulic Machinery and Equipment, Timosoars, Romania, pp 45-48, Oct. 16-17 2008 [7] Andrew S.J., “Tests Related to the Effect of Profile Shape and
Camber-line on Compressor Cascade Performance”, ARC,R&M 2743,Aeronautical Research Council, England -1949.
[8] Serovy G, Kavanagh P, Okishi T. “ Aerodynamics of Ad-vanced Axial Turbomachinery” NTIS Report ADA 131360, US government printing office, Washington Dc, Feb 1983. [9] Pullen G. and Harrvey, N., “Influence of Sweep on the Axial Flow
Turbine Cascade at Mid Span.” Trans. ASME, Journal of Tur-bomachinery, Vol 129 No 3 2007.
[10] Kalpatrik D. and Burrow, R., “ Aspect Ratio Effects on Compres-sor Cascade Blade Flutter” ARC, Technical Report, R&M No 3103, Aeronautical Research Council, England, 1958.
[11] Mustaphe H., Jourim D., Scolander, S.A., “ Aerodynamic Per-formance of a Transonic Turbine Cascade at Off Design Condi-tions” Journal of turbomachines, Vol 123, Issue 3, pp 510-519 July 2001.
[12] Nagasaki T. and Yamasaki N. “Linear Unsteady aerodynamic Forces on a Vibrating Annular Cascade blade” Journal of Thermal Sciences, Vol 12, Issue 2, pp138-143 May 2003.
[13] Sun Q. and Boyd A.D, “Flat-plate aerodynamics at very low Reynolds number” Journal of Fluid Mechanics, Vol 502, pp 199-206, 2004
[14] Rodoslav B. and Roger D. “ A DES procedure applied to flow over NACA 0012 Airfoil” IREASE, Vol 3, No. 2, Pp68-76, April 2010.
[15] Hazarika A, Thakur R, Asutosh T and Pandy K. “CFD analysis of flow over aerofoil with variable inlet velocity” IREASE , Vol 6, No. 1, Pp18-27, Feb 2013.
[16] Veress A,Gallina T, and Rohaes J. “ Fast and robust inverse method for internal and cascade flow” IREASE, Vol 3, No.1, pp 41-50 Feb 2010
[17] Seo, N., Nakatani, T., Tanaka, S. “ Performance of Rotating Cascade Under Inlet Distortion” Bulletin of JSME, Vol 24, No. 90, pp 62 8-633,April 1980
International Journal of Mechanical & Mechatronics Engineering IJMME-IJENS Vol:15 No:01 37
152501-7474-IJMME-IJENS © February 2015 IJENS
[19] Owen,P.R. and Zienkiewics,K.H., “The production of uniform shear flow in a wind tunnel” Jour. of Fluid Mechanics, Vol.2 1957, pp521-531.
[20] Woo,H.g.C. and Cermak,J.E., “The production of constant Shear flow”, Jour. of Fluid Mechanics, Vol234,1992,pp279-296 [21] Maull,D.J. and Young,R.A., “ Vortex shedding from bluff bodies
in a shear flow” Jour. of Fluid Mechanics, Vol.60 part 2 1973, pp401-409
[22] Ahmed,F. and Lee,B.E. “The production of shear flow in a wind tunnel by a shaped honey comb technique” Jour. of Fluid Mechan-ics, Vol.119 1997, pp335-386.
[23] Liu, R., David, S.K., Rankin, G.W. “ On the Generation of Tur-bulence With a Perforated Plate.” Journal of Experimental thermal and Fluid Sciences, V ol 28, Issue 4, , pp 307-316, March 2004. [24] Ariga, I., Kasai, N., Masuda, S., Watanbe, Y., Watanbe, I., “The
effect of inlet flow distortion on the performance characteristics of a centrifugal compressor,” jour. of Engg. For Power, 1983, Vol 105, pp 223-230.
[25] O’Neil, P.P., and Wickli, H.E., “Predicting process gas perfor-mance of centrifugal compressor from air test data,” ASME, jour. for Industry, Series b, Vol84, 1962, pp248-264.
[26] Kim,Y., Engeda,A., Aungier, R., and Direnzi, G., “The influence of inlet flow distortion on the performance of a centrifugal
com-pressor and development of an improved inlet using numerical simulation” Proc. I.Mech.E., Vol 215 Part A, 2001.
[27] Wright, T., Madhavan, S., Dire, J., “Centrifugal fan performance with distorted inflows” Jour. of Engg. For Gas Turbine and Pow-er,Vol 106, 1984, pp895-900.
[28] Basharat, S. “Effect of Inlet Flow Distortion on the Performance of a Radial Blower” ICASTOR Journal of Engineering India, Vol. (2), No.3(2) 147-163
[29] Karanja, K., Sayers, A. “Experimental Measurements of the Mean Flow Field in a WideAngled Diffuser: A Data Bank Contri-bution” Proceeding o f World Academy of Science, Engineering and Technology Volume 33, September 2008, 2070-3740 [30] Wolf, S., and Jhonston, J., “Effect of Nonuniform Velocity Profile
on Flow Regimes and Performance of Two Dimensional Diffus-ers” Trans. ASME, Jour. Of Basic Engg.,Volume 91,No. 3, pp 462-472, 1969.
[31] Basharat,S, “Performance of an axial cascade” Accepted in Open Journal of Fluid Dynamics
[32] 32 Lanzafame, R. and Messina, M “ Fluid dynamic wind turbine design: critical analysis” optimization and application of BEM theory” Renewable energy, 32, pp 2291-2305, (2007)
[33] Mcormik and Barnes “Aerodynamics, Aeronautics and Flight Me-chanics” Jhon Wiley and Sons, New York USA 1979
Fig. 1. Experimental Set Up
(1) Blower ( 2) Inlet Duct (3)Cup and Cone (4) Settling Chamber(5) Distorter (6) Test Section (7) Casade Angle Changing Mechanism (8) Cascade Row( side view)
International Journal of Mechanical & Mechatronics Engineering IJMME-IJENS Vol:15 No:01 38
R =2.26x10⁵ R =2.52x10⁵
Fig. 3. Inlet Velocity Profiles for different Configurations
R1= 2.26x10⁵ R2= 2.52x10⁵
Fig. 4. Variation of incidence angle with blade angle for different configuration
R1= 2.26x10⁵ R2= 2.52x10⁵
Fig. 5. Variation of Deviation angle with blade angle for different configuration 0
10 20 30 40 50
0.
00 0.13 0.25 0.38 500. 0.63 0.75 0.88 1.00 V(m/s)
y/w
c1 c2 c3 c4
0 20 40 60 80
0.
00 0.13 0.25 0.3
8
0.
50 0.63 0.75 0.88 1.00 V (m/s)
y/w c1 c2 c3 c4
0
10
20
30
40
-10
-5
0
5
10
i
0b
0c
1
c
2
0
10
20
30
40
-10
-5
0
5
10
i
b
c1
c2
c3
c4
-40
-30
-20
-10
0
10
-10
-5
0
5
10
d
0b0
c1
c2
c3
c4
-20
-10
0
10
-10
-5
0
5
10
d
0b
0c1
c2
International Journal of Mechanical & Mechatronics Engineering IJMME-IJENS Vol:15 No:01 39
152501-7474-IJMME-IJENS © February 2015 IJENS
R1= 2.26x10⁵ R2= 2.52x10⁵
Fig. 6. Variation of deflection angle with blade angle for different configuration
R1= 2.26x10⁵ R2= 2.52x10⁵
Fig. 7. Variation of Static Pressure Rise Coefficient with blade angle for different configuration
R1= 2.26x10⁵ R2= 2.52x10⁵
Fig. 8. Variation of Total Pressure Loss Coefficient with blade angle for different configuration
0
20
40
60
80
-10
-5
0
5
10
z
0b
0c1
c2
c3
c4
-50
-30
-10
10
30
50
-10
-5
0
5
10
z
0b
0c1
c2
c3
c4
-1
0
1
2
-10
-5
0
5
10
Cp
b
0c1
c2
c3
c4
-0.5
0
0.5
1
1.5
-10
-5
0
5
10
Cp
b
0c1
c2
c3
c4
-5
-3
-1
1
-10
-5
0
5
10
e
b
0c1
c2
c3
c4
-5
-3
-1
1
-10
-5
0
5
10
e
b
0c1
c2
International Journal of Mechanical & Mechatronics Engineering IJMME-IJENS Vol:15 No:01 40
R1= 2.26x10⁵ R2= 2.52x10⁵
Fig. 9. Variation of Lift Coefficient with blade angle for different configuration
R1= 2.26x10⁵ R2= 2.52x10⁵
Fig. 10. Variation of Drag Coefficient with blade angle for different configuration
(a) Lift Coefficient (b) Drag Coefficient Fig. 11. Comparison experimental and theoretical values with blade angle for Lift and Drag Coefficient
for different configuration Reynolds Numbers R1= 2.26x10⁵ and R2= 2.52x10⁵
0
0.5
1
1.5
2
-10
-5
0
5
10
Cl
b
0c1
c2
c3
c4
0
0.5
1
1.5
2
-10
-5
0
5
10
Cl
b
0c1
c2
c3
c4
-0.5
0
0.5
1
1.5
-10
-5
0
5
10
Cd
b
0c1
c2
c3
c4
-0.5
0
0.5
1
1.5
-10
-5
0
5
10
Cd
b
0c1
c2
c3
c4
0 0.4 0.8 1.2 1.6
-10 -5 0 5 10
Cl
b
0Ref(16) R1 R2 Ref(17)-1 Ref(17)-2
0 0.1 0.2 0.3 0.4
-10 -5 0 5 10
Cd
b
0 Ref(16)International Journal of Mechanical & Mechatronics Engineering IJMME-IJENS Vol:15 No:01 41
152501-7474-IJMME-IJENS © February 2015 IJENS
Table I
Shape of distorter and Nomenclature of Configurations
Shape of distorter Nomenclature of configuration
c1 Configuration
c2 Configuration
c3 Configuration