http://www.sciencepublishinggroup.com/j/ijae doi: 10.11648/j.ijae.20190402.14
ISSN: 2575-3851 (Print); ISSN: 2575-3843 (Online)
Evaluation of the Impact of Partnership Program on the
Technical and Economic Efficiency of Irrigation Water Use
for Moroccan Citrus Farms
Nassreddine Maatala
1, Aziz Fadlaoui
2, Philippe Lebailly
31
Department of Human Sciences, Hassan II Institute of Agronomy and Veterinary Medicine, Rabat, Morocco
2Department of Management of Natural Resources, Economics and Sociology and Quality, Regional Agricultural Research Center, Meknes, Morocco
3Department of Rural Economy, Faculty of Gembloux Agro Bio-Tech, Gembloux, Belgium
Email address:
To cite this article:
Nassreddine Maatala, Aziz Fadlaoui, Philippe Lebailly. Evaluation of the Impact of Partnership Program on the Technical and Economic Efficiency of Irrigation Water Use for Moroccan Citrus Farms. International Journal of Agricultural Economics.
Vol. 4, No. 2, 2019, pp. 70-79. doi: 10.11648/j.ijae.20190402.14
Received: February 13, 2019; Accepted: March 19, 2019; Published: April 29, 2019
Abstract:
A public-private partnership (PPP) in irrigated area is a mode of collaboration and governance that allows the Moroccan Government to entrust the design, financing, construction, operation and maintenance of irrigation equipment to a private enterprise. In this research, we want to estimate technical efficiency of farms, the technical and economic efficiency of irrigation water use, analyzing the determinants of each of these aspects. The sampling was undertaken using the propensity score matching. The estimation of the farms’ technical efficiency was carried out using FRONTIER 4.1 software and a stochastic parametric method with the functional form Translog. The transition from an output orientation to an input orientation in order to estimate the technical and economic efficiency scores of the irrigation water was carried out through the use of the Reinhard derivative. The determinants of these aspects were analyzed with the Gnu Regression, Econometrics and Time series Library (Gretl) software using the Tobit model. A survey was carried out among 130 citrus growers (65 pairs). The average of the technical efficiency increased from 62% in 2009 to 72% in 2016. This improvement is explained by the presence of highly qualified employed who assure the management and the technical supervision of the workers on the farms. Conversely, the analysis shows that the PPP irrigation program has had no impact on the farms’ technical efficiency scores. On the basis of the results, it is appropriate to focus on several aspects in order to improve the different types of efficiencies. Indeed, the Moroccan Government must ensure the aspect of the technical supervision of farmers in the two perimeters, which will better help to control the technical conduct of citrus farms.Keywords:
Public-Private Partnership, Efficiency of Water Use, FRONTIER, Technical Efficiency, Irrigation, Tobit Model1. Introduction
Irrigation water economy is at the heart of Moroccan agricultural policy objectives. The Green Morocco Plan, which consists of several ambitious programs, aims to improve the efficiency of irrigation-water use while improving the agricultural production levels of the various irrigated crops.
This challenge prompted the Moroccan Department of Agriculture to set up several projects and programs in the irrigation sector; these include both conversion projects (for
crops. In other words, the main objective of these projects is to improve the efficiency of the use of irrigation water.
According to the study conducted by Yigezu [1], Irrigation method is one of the most important variables in explaining the variation in both technical and irrigation water efficiencies. Comparison between irrigation methods reveals that shift from the traditional surface canal irrigation to modern irrigation methods, particularly sprinklers, leads to 19% and 9% higher output oriented technical efficiency and irrigation water use technical efficiency, respectively. This finding is consistent with the views of Allan (1999) [2], in that water can be used more effectively by utilizing more advanced irrigation technologies (e.g., drip irrigation instead of water spreading).
In Morocco, the public-private partnership (PPP) program in irrigation meets this main objective through the safeguarding of perimeters within the framework El Guerdane project or by the creation of new irrigated perimeters over large areas where the seawater desalination project in the Dakhla region is a significant illustration of this practice [3].
The objective of this work was to study the impact of the PPP program on the technical efficiency of agricultural holdings and on the technical and economic efficiency of irrigation water use.
The literature on how irrigation water in the El Guerdane area is benefiting from the PPP program is scant and very limited. This research is the first of its kind; its purpose is to shed light on the efficiency of water use along the Souss-Massa perimeter and to contribute to the current debate on the success of the various projects of the PPP irrigation program, examining how they can better conserve and save this natural resource.
2. Materials and Methods
To do this, we selected a sample that is subject of our analysis. Then, we an econometric model to estimate the production frontier and discussed the technical efficiency scores of the farms studied (an output orientation). We undertake then an estimation of the technical and economic efficiency scores of the use of irrigation water (an input orientation). Lastly, we analyzed both the determinants that can affect the technical efficiency of farms and the level of the technical and economic efficiency of irrigation water use.
2.1. Sampling Method
The measurement of the PPP program impact through assessment efficiency and the technical and economic efficiency of the use of irrigation water use is one of the objectives of our work In the absence of data when observing beneficiaries’ situations before the implementation of the project (the pre-intervention situation), we consider a method that serves as a very interesting alternative and which offers a means to cope with the lack of information. This method is called propensity score matching (PSM). When applying
PSM a control group must be selected, which will be compared to the treated group. In our case, we must choose a control perimeter with farmers who practice the same crops and who use the same production technologies as those of the treated group (the El Guerdane perimeter).
The Souss-Massa region has six irrigated perimeters, including El Guerdane and Issen. The Regional Office for Agricultural Development of Souss-Massa (ORMVASM) is the public institution responsible for the management of the irrigated area of Issen. The irrigation water service in the El Guerdane perimeter (which deals with water distribution, operation and infrastructure maintenance) is managed by a company called Amensouss.
The PPP agreement was signed between the state and a private partner in 2005. The difference between these two management modes lies in the contractual obligation of the private partner to ensure a minimum annual quantity of irrigation water per hectare, available throughout the year, for each farmer enrolled in the program PPP. Unlike farmers in the Issen perimeter, the private partner’s contractual commitment enables farmers in the El Guerdane perimeter to better master the technical management of the citrus fruits.
In comparison to the other perimeters, Issen is located near the El Guerdane perimeter, allowing us to exclude the risk of any exogenous factors that may influence our analysis. Indeed, the soil in each of the two perimeters (El Guerdane and Issen) has exactly the same nature; additionally, the two perimeters have the same water-table depth and the same climatic conditions. The farmers in both areas use the same production technologies and practice the same crops.
To this end, and before applying the PSM method to choose our sample, we conducted interviews with the different stakeholders of the El Guerdane project in order to build a database that includes all the citrus farmers situated along the two perimeters. The concept of the PSM method is to construct pairs of farmers: each pair should contain one farmer from the group that benefited from the project and one from the control group (the witness farmer). The two groups should have as many similar characteristics as possible (as previously determined).
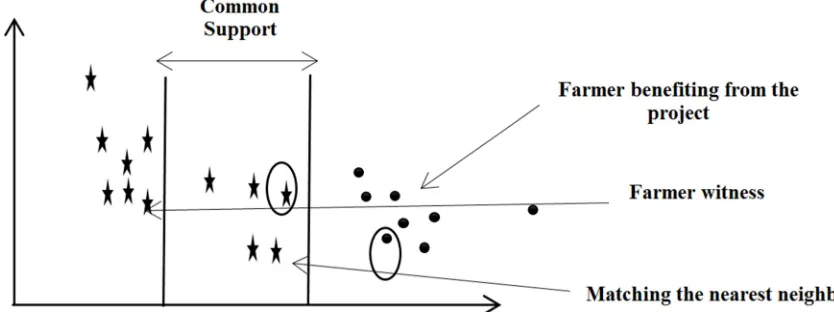
It is important to note that the propensity score is a probability, so its value is between 0 and 1. In practice, it is not easy to find farmers (the project beneficiary and the witness) with exactly the same propensity score. However, there are several techniques to constructing successful pairings, such as that of “the nearest neighbor matching on the score.” This technique consists of matching two individuals with close propensity scores according to a given interval. This interval varies from one discipline to another. In our case, based on the bibliography in the economic and social sciences, an interval ranging from 0 to 0.2 was defined [4].
Figure 1. Propensity score matching and common support.
To estimate the propensity score, logistic regression also called the Logit model is generally used by assigning the value '' 0 '' to non-participants in the El Guerdane project (farmers in the '' control '' group) and the value '' 1 '' to the project participants (farmers of the '' treated '' group). A propensity score for a farmer ‘’i’, e xi , can be estimated using the logistic regression of the processing condition zi on the vector of co-variables (xi) [5]:
ln 1
Where β is the vector of the regression coefficients. The 'nearest neighbor matching on the score' technique of matching a farmer i from the treated group to a farmer in the control group on the basis of distance (interval) can be expressed as follows:
, | |
At the same time, and according to Cochran [4], the pairing of each farmer in the treatment group with the farmer in the control group should be within a predefined distance b (the interval of 0, 2 previously defined), that is:
, | |
To find a witness that best corresponds to each beneficiary of the project, it is important to define the variables needed to build the pairs. This choice remains, unfortunately, not simple.
Generally, if the list of observable characteristics is relevant and very long, it is difficult to find an individual corresponding exactly to each individual in the treatment group. In other words, the higher the number of characteristics of the individuals to be matched, the more likely one is to face a problem of '' dimensionality ''. For example, if we use only two characteristics to form pairs, we will probably find for each treated individual corresponding individuals in the control group, but we face a risk of not taking into account of other potentially important features. While, if we increase the list of matching characteristics, we may not find a match for each individual treated in the
control group.
In our case, and in the absence of a data history of the two perimeters, the choice of matching variables before the implementation of the partnership project remains very limited. As a result, the only two matching variables available were the area of citrus grown prior to project implementation and surface water consumption. After obtaining the propensity score, the sample is limited to individuals that have common support in the distribution (figure 1). Then, for each "treated" individual, a "control" individual with a similar propensity score is identified.
The calculation of the propensity scores is done by software R 3.1.0 and SPSS 23.
2.2. Collection of Data
After selected pairs, they were surveyed in the field to collect the data needed to calculate the technical efficiency scores of the holdings as well as the technical and economic efficiency scores of the farm use of irrigation water.
2.3. The Concept of Efficiency
For Farell (1957) [7], technical efficiency measures the way a firm use the quantities of inputs that enter the production process. An operation is technically efficient if, for a level of factors and products used, it is impossible to increase the quantity of a product without increasing the quantity of one or more factors or without reducing the quantity of another product. Measuring the technical efficiency of an agricultural production activity makes it possible to measure whether a crop can increase its production without consuming more inputs, or reduce an input at least, while maintaining the same level of production [8].
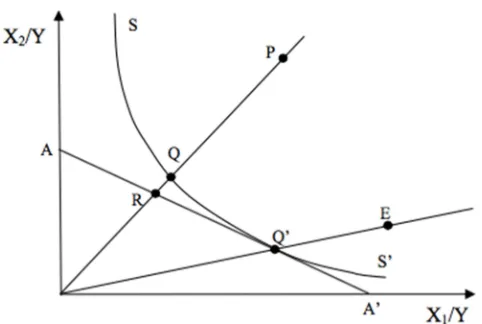
Figure 2. Graphical representation of the technical efficiency of allocative efficiency.
(Case of two inputs and one output (Farell, 1957))
The isoquant SS 'represents the production frontier. It delimits, on its right, all the technically feasible combinations of inputs. According to Farrell, the technical efficiency of operation at point P is given by the OQ / OP ratio. The technical efficiency is therefore between 0 and 1. All points on the production frontier are technically efficient and have a technical efficiency equal to 1.
To be allocatively efficient, farms must equalize the marginal rate of technical substitution between input X1 and input X2 with the price ratio of market-determined inputs [7]. The line AA graphically represents this relationship.
Farms which are on the isocost AA 'are allocatively effective exploitations. The point Q corresponds to the radial projection of the point R on the border. This assures him the same proportions of input as P. Indeed, Farrell geometrically measures the allocative efficiency by the ratio OR / OQ. Similarly, the allocative efficiency is between 0 and 1.
According to Farell, the economic efficiency of a farm is the ratio between its technical efficiency and its allocative efficiency. Graphically, a farm is said to be economically efficient if it is both technically and allocatively efficient. It is presented by the point Q' in the figure.
2.4. Methods for Estimating Efficiency
The different methods for estimating borders vary according to the functional form of this boundary, the estimation technique used to obtain this functional form and the nature of the hypotheses chosen justifying the difference between the observed production and the optimal production. Concerning the criterion relating to the functional form of the boundary, it permits to distinguish the parametric and non-parametric estimation approaches. The non-parametric approach has a function with explicit parameters (Cobb-Douglas, Translog, etc.). As for the non-parametric approach, no functional form is required.
The nature of the differences between the observed production and the optimal production differs stochastic frontiers and deterministic boundaries. If our hypothesis supposes that this difference is explained solely by the
inefficiency of the operator, we speak of a deterministic boundary, whereas if we suppose that the difference between the observed production and the optimal production is explained at the inefficiency of the operator and other random elements that do not depend on the producer, the boundary is characterized as stochastic in nature.
In summary, the efficiency of a farm, a sector, a perimeter, a region or a country can be measured by parametric or nonparametric methods. These methods differ according to the hypotheses considered for the natures of the residues. If we impose a functional form (Cobb-Douglas, Translog, etc.), the production or cost frontier is called stochastic parametric, assuming that the differences between the estimated function and the actual observations correspond to productive inefficiencies and random error terms.
Given the random nature of production in the Souss-Massa perimeter, linked to the nature of the climate and fluctuations in citrus sales prices from one year to another, the choice of the stochastic parametric method to measure the level efficiency seems justified to us. Also, the choice of the functional form Translog to present the function of production, is explained by the fact that this function admits the derivative of Reinhard, which will enable us to pass from an orientation output to an orientation input and to choose a input on which we want to work to measure the technical and economic efficiency of its use.
2.5. Estimation of Irrigation Water Use Efficiency
The stochastic approach for the estimation of the production frontier has been widely used to analyze the technical efficiency of production [9, 10, 11, 12]. By extending the application of the stochastic method to estimate the production frontier, Karaigianni [13] propose a new measure of the technical efficiency specific to a single input needed for production, which is called the Technical Efficiency of Irrigation Water Use ( ).
The ) compares the way in which a farmer uses irrigation water relative to his or her neighbor or another user located in the same perimeter. This comparison is made while controlling the effect of all other factors that have a potential impact on farm efficiency. Estimating scores by farm under study will help policy makers and extension workers to achieve their goal of saving irrigation water.
Improving the efficiency of agricultural water use can be a consequence, in our case, of the implementation of the public-private partnership program. In fact, given the high price of surface water for farms benefiting from this program, farmers are starting to worry about the most efficient way in which the maximum output can be produced by using a minimal amount of irrigation water. In addition, the economic efficiency of irrigation water use ( ) combines both technical efficiency and water cost efficiency indicating the comparative advantages of participation or no to the public-private partnership program.
of inputs X and water of irrigation which can be used to produce an output level !". Point A represents an exploitation that produces a level of output !" using a level of inputs
#$and a quantity of irrigation water $.
Figure 3. Measuring Efficiency of Irrigation Water Use by Karagiannis et al (2003).
The output-oriented technical efficiency of the farm (i) is given by:
% &' &() ; 0 %, 1
Similarly, the efficiency of use of the irrigation water of the farm i ( %) which measures the efficiency of the use of the water of the farm (i) compared to the most efficient use of water is given by:
% #1 #1() ; 0 %, 1
The advantage of this measure is that it determines the minimum possible use of the water - necessary to produce the same output level !" while using the same quantity #$ of the other inputs. It also determines the maximum possible reduction in the amount of irrigation water used ( $ -).
It should be noted that does not provide information to achieve savings due to the efficient use of the different inputs. To do this, it is necessary to use the single-factor technical efficiency measure, which directly assesses the potential cost savings by improving the management of a single factor of production while keeping the same observed level of other inputs [14]. This specific measure of efficiency combines both the technical efficiency and the economic efficiency of the use of irrigation water.
Karagiannis [13] define the economic efficiency of the use of irrigation water for an operation i ( %) as potential cost
savings through an adjustment of the consumption of irrigation water to a technically efficient level, while keeping the same level of other factors of production. According to Akridge [13], %is estimated as follows:
% ./%∗ % 1 2 .3% 3
%4$
5678 9 :
Where ./%is the share of the cost of irrigation water : in the total cost of inputs used by the farm (i) and .3% is the share of the costs of other inputs.
By definition, the sum of all costs should equal 1 (./%1
∑ .3%4$ 3% 1 . % takes a value between 0 and 1, therefore, 0 %, 1.
In view of the above, % can also be considered as the efficiency of the cost of applying irrigation water on a farm (i) compared to that of the most efficient keeping in mind the possibility of substitution between inputs and their costs.
It is necessary to emphasize that the estimates of the % should be calculated with caution, since a very small share of the cost of irrigation water in the total cost of production can lead to high ITCEs even in case of using irrigation water in an inefficient way.
2.6. The Model Specification
As noted above, the parametric approach is either deterministic or stochastic. In our case, it is assumed that the observed deviation includes, in addition to the technical failure, other errors such as the incorrect specification of the model or the omission of certain explanatory variables [16].
The parametric approach is formalized as follows:
!% < =%>?%
Where ! is the output vector, is the vector of inputs, @ is the vector of random errors and 7 is the error term due to technical inefficiency of production.
The true production function for Moroccan citrus farms remains unknown. According to Zhang and Xue [8] and Battesse and Coelli [10], and taking into account the assumptions of specification and distribution of the error terms, the Translog production function remains the best choice in order to have a situation very close to reality through the sample studied. Among many functional forms, the Translog form is chosen because of its desirable properties to achieve the desired results [17, 18, 19, 20]. The derivation of Reinhard [21] is then applied to the stochastic production boundary to calculate the technical efficiency of irrigation water %.
On the basis of the above, our model is presented as follows:
ln A% B"1 2 B3 C
34$
D 3%112 F2 2 B3G 3
G4$ H
34$ D 3% D G% I 1 B/ln :%1
1
2 B// D :% -1 2 B3/ C
34$ D 3% D :% 1 J% 7%
Where: i = 1, 2,..., 121 denote the farms in the sample.
!%: The quantity of orange fruit produced by the farm (i)
expressed in kg / ha.
(i) in m³ / ha.
%: The vector of the quantities of the other inputs used by the farm (i);
@%: The vector of random errors;
7%: The term positive random error which represents the
inefficiency of the operator.
The error term 7%is deficient as follows:
7% K%L 1 MN
Or:
K%: A vector of variables that explain the differences in
efficiency between farms;
L: A vector of the parameters to be estimated;
M%: A random variable defined by the truncation of a
normal distribution with a mean 0 and a variance P-where the truncation point is K%L with M%≥ K%L.
For technically efficient operations, our model can be written as follows:
A% <R %3, :%3, B%3, @%, 7%S T@ U 7%= 0
Therefore, the output-oriented technical efficiency is defined as follows:
%= <R<R%3, :%3, B%3, @%, 7%S %3, :%3, B%3, @%S
Applying this equation to our model specified above, we will have:
%= >?V
Since it is impossible to obtain the estimate of 7% and @% for each farm, the technical efficiency estimator % is obtained as the conditional expectation of ?% given the error term %= @%− 7%.
%= ( ?V
%)
Following the derivation of the specific input efficiency of Reinhard [19], the technical efficiency of the use of irrigation water % is given by:
%= exp
X Y Z
[ \ \ ]
− FB/+ B//D :%+ 2 B3/
3
D %3I + ^FB/+ B//D :%+ 2 B3/
3
D %3I
-− 2B//∗ 7 _
",`
a b b c
/B// e f g
Where :%is the amount of irrigation water consumed by the farm (i) and 0 < %≤ 1 with the value 0 for the most inefficient farm and the value 1 for the most farm effective operating on the production frontier.
Since the interpretation of this efficiency specific to a single input (irrigation water in our case) does not provide information to achieve cost savings due to an effective use of the input studied, it is necessary to use the measure of the economic efficiency of the use of irrigation water
%,, which allows to directly evaluate the potential cost
savings thanks to the improvement of the utilization management of this input while keeping the same level of all other inputs.
2.7. The Choice of Variables
The results of our investigations reveal that the main factors of production in the two perimeters are water and labor (both for harvesting and for the rest of the production process). Thus, we estimate that production technology at the two irrigated perimeters depends mainly on irrigation water (Water), intermediate consumption (CF and OC) and labor (MO).
Also, and since we are interested in irrigation water use efficiency, the choice of the ''water'' variable is justified.
As for intermediate consumption, attempts have been made to separate the costs of fertilizers from the costs of other inputs (phytosanitary products and others). Therefore, our model contains four inputs. The output of our model is the quantity produced of citrus fruits.
2.8. Analysis of the Determinants of Irrigation Water Use Efficiency
The field surveys carried out with the different farmers of the two perimeters enabled us to focus on several determinants. Indeed, several farmers consider that the level of technical efficiency of their farms as well as the technical efficiency of irrigation water use are mainly affected by the technical supervision provided by the technicians of the various existing cooperatives in the two perimeters, hence the choice of the determinant '' Adhesion to agricultural cooperatives ''.
Moreover, we consider that the level of education of the farmers can impact their technical levels and consequently the level of technical efficiency of the farms. Also, several operators consider that the public-private partnership program allows them to better control the technical management of citrus fruit by bringing the optimal quantities of water at the right time of the crops season.
It should also be noted that in order to ensure that the size of farms and the point of sale of production do not have an impact on the level of efficiency, we have integrated the determinants ''. Area '' and '' Access to the international market ''. In other words, we make sure that each farmer wants to maximize his production regardless of the size of his farm and the place of sale of his production.
We have assumed that the rate of irrigation water can affect the level of economic efficiency of irrigation water use and, therefore, it has been inserted as a potential determinant in our analysis.
%, %, %= <( T8 <</hijk, (8 T%, lT8m U 5Tm 6 nnn, o @%pqi, (UU rrjst, u 8rℎ 5wxxt)
With:
%: The technical efficiency of the use of irrigation
water;
%: The economic efficiency of the use of irrigation
water;
%: The technical efficiency of citrus farms;
T8 </hijk: The average rate of one cubic meter of
irrigation water consumed by the farm i expressed in Dh;
(8 T%: The area of the holding i expressed in ha;
lT8m U 5Tm 6 nnn: Participation or not in the
public-private partnership program (this is a binary variable with value 0 for citrus growers in the Issen perimeter and value 1 for citrus growers in the El Guerdane perimeter);
o @%pqi: The level of education of the farm manager i in number of years of schooling;
(UU rrjst: Access or not to the international market (it is a binary variable with the value 0 in case of sale of the production on the local market and the value 1 in case of export);
u 8rℎ 5wxxt : Membership in an agricultural
cooperative or not (it is a binary variable with the value 0 if the citrus grower did not join any cooperative and the value 1
if the citrus grower has joined, at least, to a cooperative).
3. Results and Discussion
3.1. Description of the Sample
PSM was performed, by area (Five Slices), using both SPSS 23 and R 3.1.0. In total, 65 pairs were established and investigated, they are distributed as follows: 44 pairs of citrus growers with an area of less than 5 ha, 9 pairs of citrus growers with an area that varies from 5 to 10 ha, 4 pairs of citrus growers with an area ranging from 10 to 20 ha, 2 pairs of citrus growers with an area of 20 to 50 ha and 6 pairs of citrus growers with an area greater than 50 ha.
3.2. Description of Variables and Determinants
Average citrus production ranged from 20.49 T / ha in 2009 to 24.26 T / ha in 2016. Table 1 provides a statistical description of the different variables and determinants used in our models.
Table 1. Statistic description of variables and determinants.
Var Description of variable 2009 2016
Aver yz Aver yz
Y Rendement (kg/ha) 20 498,5 8 730 24 260 16 047,2
Stochastic production frontier model
W Water of irrigation (m³/ha) 7 324 1 826,8 7 273,5 1 950,48
CF Cost of fertilizers ($/ha) 598,8 312,2 720,24 372,35
OC Cost of others inputs ($/ha) 1630,6 1551,1 1575,6 995,77
MO Labor (day/ha) 77,87 60,88 77,87 60,88
Determinants of the efficiency of water use
T Tariff of water ($/m³) 0,116 0,04 0,121 0,037
PPP* Participation in PPP program - - - -
Sup Surface area (ha) 15,22 33,73 15,22 33,73
Inst The education level of the farm manager (years of studies) 5,66 5,51 5,66 5,51
Exp* Access or not to the international market - - - -
Coop* Membership in an agricultural cooperative - - - -
* Binary variable
3.3. Estimation Frontier Production Parameters
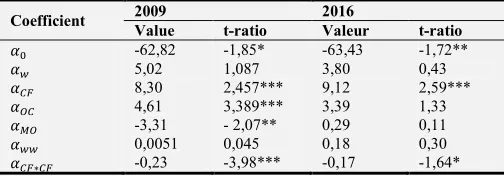
The parameters of the production boundary are estimated by the maximum likelihood method using the FRONTIER 4.1 software. The model is initiated by the ordinary least squares method. The significance of the variable γ allows us to validate the hypothesis of the choice of our model. All parameters are shown in Table 2 below.
Table 2. Estimation of frontier production using maximum likelihood method.
Coefficient 2009 2016
Value t-ratio Valeur t-ratio
B" -62,82 -1,85* -63,43 -1,72**
B/ 5,02 1,087 3,80 0,43
B{| 8,30 2,457*** 9,12 2,59***
B}{ 4,61 3,389*** 3,39 1,33
B~} -3,31 - 2,07** 0,29 0,11
B// 0,0051 0,045 0,18 0,30
B{|∗{| -0,23 -3,98*** -0,17 -1,64*
Coefficient 2009 2016
Value t-ratio Valeur t-ratio
B}{∗}{ -0,021 -0,46 0,108 1,29
B~}∗~} 0,12 1,12 0,067 0,64
B•∗{| -0,44 -1,27 -0,46 -1,26
B•∗}{ -0,24 1,21 -0,25 -0,77
B•∗~} 0,28 1,49 -0,127 -0,4
B{|∗}{ -0,13 -1,32 -0,29 -1,64*
B{|∗~} 0,19 1,46 0,153 1,05
B}{∗~} -0,19 -1,87** -0,122 -0,82
P- 0,496 6,08*** 0,369 3,43***
€ 0,976 43,41*** 0,528 2,06**
*** Significant to 1 ‰ ** Significant to 1% * Significant to 5%
between the observed production and the potential production of the farms studied is due to their inefficiency. In other words, in 2009, only 2.4% of the differences between the observed production and the potential production of citrus farms are related to random effects including measurement errors. These differences represent 47.2% in 2016. Furthermore γ is significantly lower than 1 for both periods, which justifies the importance of the stochastic term θ. the closer the value of γ is to 1, the smaller the difference between the results from a stochastic estimate and those from a deterministic estimate. Therefore, the choice of our stochastic model seems justified.
3.4. Estimation of Efficiency Scores
After estimating the technical efficiency scores of the citrus farms using the FRONTIER 4.1 software, the technical and economic efficiency scores of irrigation water use were concluded. The frequency distribution of the technical efficiency scores of the farms as well as the technical and economic efficiency scores of the use of irrigation water are presented in Table 4.
In 2009, the average technical efficiency of the citrus farms surveyed was 0.62 with a minimum of 0.17 and a maximum of 0.95, while in 2016, there was an improvement in technical efficiency scores of these farms passing to an average efficiency of 0.72 with a minimum of 0.31 and a maximum of 0.92.
This improvement is explained by the level of technical expertise of farmers, which continues to improve over time. Indeed, and following the data collected from the field surveys, the evolution of the technical level of farmers has been observed at several levels: i) the quantity of some inputs applied per hectare has decreased (the case of manure), ii) the increase in the quantities used of some inputs in order to improve the production in terms of quantity and quality (especially the size of the fruit) and iii) the decrease in the quantity of irrigation water consumed per hectare while increasing the level of production (in 2009, average irrigation water consumption in all areas was 9,000 m³ / ha, whereas in 2016, this consumption declined to 6,000 m³ / ha).
Regarding the technical efficiency of irrigation water use, the average score increased from 0.77 in 2009 to 0.79 in 2016, with a minimum of 0.18 and 0.08 and a maximum of 0.97 and 0.92 in 2009 and 2016 respectively.
For the economic efficiency of irrigation water use, the average score increased from 0.88 in 2009 to 0.89 in 2016.
Table 3. Frequency distribution of the scores of the different types of efficiency studied.
Efficiency (%)
2009 2016
TE IWE ITCE TE IWE ITCE
<20 3 1 0 0 1 0
20-30 5 0 0 0 0 1
30-40 14 3 1 1 0 0
40-50 15 3 0 3 3 0
50-60 17 13 1 3 2 1
60-70 13 14 5 26 7 1
70-80 23 24 12 60 35 6
80-90 22 32 37 27 66 49
90-100 9 31 65 1 7 63
Total 121 121 121 121 121 121
Average 0,62 0,77 0,88 0,72 0,79 0,89
Min 0,17 0,18 0,33 0,31 0,08 0,21
Max 0,95 0,97 0,99 0,92 0,92 0,99
3.5. Determinants of the Different Types of Efficiency
Using the GRETL software, we analyzed the explanatory variables that can influence the levels of the scores of the technical and economic efficiency of the use of the irrigation water. These calculations were performed using a Tobit model to take into account the truncated character (between 0 and 1) of the dependent variable.
3.5.1. Determinants of the Technical Efficiency of Citrus Farms
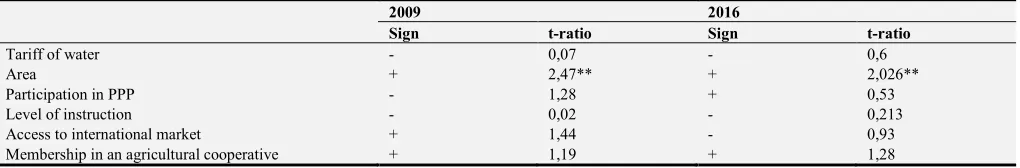
For both years (2009 and 2016), only the size of the farms has a significant positive impact on the level of technical efficiency of the farms surveyed. This result is explained by the presence of skilled human resources in large farms. Indeed, the owners of large farms recruit permanent engineers and / or technicians who take care of the management, the follow-up, the technical supervision of the workers as well as other aspects which positively affect the level of the production of the citrus orchards and reduce the quantities of inputs used.
This statement regarding the level of education concerns only the employed at the level of large farms, and not the managers and / or owners.
For the other determinants, they have no impact on the technical performance of citrus farms in both 2009 and 2016. Table 4 presents the results relating to the analysis of the determinants of the technical efficiency scores of the citrus farms surveyed.
Table 4. Determinants of the technical efficiency of citrus farms.
2009 2016
Sign t-ratio Sign t-ratio
Tariff of water - 0,07 - 0,6
Area + 2,47** + 2,026**
Participation in PPP - 1,28 + 0,53
Level of instruction - 0,02 - 0,213
Access to international market + 1,44 - 0,93
Membership in an agricultural cooperative + 1,19 + 1,28
3.5.2. Determinants of the Technical and Economic Efficiency of the Use of Irrigation Water
The performance of citrus farms was assessed, through analyzing the impact of the determinants on the technical and economic efficiency scores of irrigation water use (table 5).
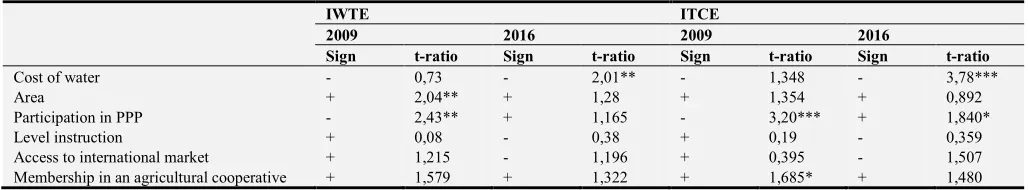
Table 5. Determinants of the Technical and Economic Efficiency of Irrigation Water Use.
IWTE ITCE
2009 2016 2009 2016
Sign t-ratio Sign t-ratio Sign t-ratio Sign t-ratio
Cost of water - 0,73 - 2,01** - 1,348 - 3,78***
Area + 2,04** + 1,28 + 1,354 + 0,892
Participation in PPP - 2,43** + 1,165 - 3,20*** + 1,840*
Level instruction + 0,08 - 0,38 + 0,19 - 0,359
Access to international market + 1,215 - 1,196 + 0,395 - 1,507
Membership in an agricultural cooperative + 1,579 + 1,322 + 1,685* + 1,480
*** Significant to 1 ‰ ** Significant to 1% * Significant to 5%
In 2009, only the ''Area'' and ''PPP participation'' variables have a significant impact on the technical efficiency scores of irrigation water use. The '' Area '' variable has a positive impact, due to the high technical levels that characterize farms with large areas. In fact, during field survey, high availability of qualified permanent labor (technicians and / or agronomists) was noted at large farms level. This technical framework had a significant positive impact on the amount of water consumed per hectare. In large farms less irrigation water is used than in small and medium-sized farms. As a result, low technical efficiency scores of irrigation water use were obtained.
The negative impact of the variable '' Participation in the PPP program '' on the technical efficiency scores of the use of irrigation water in 2009, can be explained by the availability of surface water for farms benefiting from this program.
For farmers having an agreement with the PPP program (farmers of the El Guerdane perimeter), 4,000 m³/ha of surface water is distributed annually to farmers while the remaining water needs are pumped from the Souss aquifer (a quantity range between 5000 m³ / ha and 6000 m³ / ha). However, farmers in Issen (not participating in the PPP program), are obliged to pump the maximum of water needed due to irrigation network condition and water available in the dam. Given the high cost of pumping, farmers are encourages to reduce irrigation water consumed, which remains slightly lower compared to El Guerdane farmers.
For the year 2016, only the variable '' Water tariff '' has a significant impact on the technical efficiency scores of the use of irrigation water. The negative impact of this variable can be explained by the fact that farmers reduce the amount of water consumed due to the high cost of water. This management can affect the production, the technical efficiencies of the farms and irrigation water use.
For the economic efficiency score of the use of irrigation water '' ITCE '', the variation is explained in 2009 by the variables '' Participation in the PPP program '' and '' Membership in cooperatives '' and in 2016 by the variables '' Water Tariff '' and '' Participation in the PPP Program ''.
In 2009, the negative impact of the determinant '' Participation in the PPP program '' can be explained by the high tariff of water for the El Guerdane perimeter compared to that of Issen. In fact, the surface water tariff in the El
Guerdane perimeter rises to 1.8 Dh / m³, while it varies between 0.6 and 0.7 Dh / m³ in the Issen perimeter. The relatively high cost of water for farmers benefiting from the PPP program has a negative impact on the economic efficiency of the use of irrigation water.
On the other hand, for farmers’ member of an agricultural cooperatives and benefit from technical support, they manage better irrigation water to optimize production, which explan the positive impact of the variable '' Membership in cooperatives '' on the economic efficiency scores of the use of irrigation water.
For 2016, the higher the price of irrigation water, results in higher total cost of water compared to other input costs. Therefore, this increase negatively affects the economic efficiency of the use of irrigation water. The positive impact of the determinant '' Participation in the PPP program '' on the ITCE, is explained by the fact that the farmers of the El Guerdane rationalize water use given its high prices. This management reduces the overall cost of irrigation water which positively affects the economic efficiency scores.
4. Conclusions
According to our analysis, the technical framework is a positively correlated to the effectiveness use of this aspect, it is therefore appropriate to give more importance to this component in order to improve these aspects. This observation allows recommending the possibility of studying the role of private partner in the management of water used and improvement of irrigation water use efficiency.
At this program, the private partner intervenes only at the level of irrigation water distribution and water charges collection. If the intervention of this partner goes beyond others aspects such as the marketing, packaging and / or export circuit, can we have significant results on the tariff and the level of valorization of the irrigation water? Considering that the private partner will consider other margins downstream of the commercial circuit too? In our opinion, this reflection deserves to be deepened.
technology that is the drip irrigation mode, the nature of the equipment used, the size of the irrigation network, the number of ramps, the periods of watering, etc. are all factors that can affect the technical efficiency of water use.
All the factors mentioned may, like other factors, cause citrus orchard diseases affecting the quality and the quantity of citrus yield. Therefore, the analysis of this track can direct us to specific conclusions about the factor that most impacts the level of technical efficiency of the use of irrigation water.
Acknowledgements
The technical performance of the farms surveyed was improved between the year of the start of the public-private partnership project in irrigation and the year 2016. This improvement is explained by the presence of the highly qualified employed on the farm. On the other hand, our analysis shows that the PPP irrigation program has no impact on the technical efficiency scores. This observation permits to give more importance to the technical supervision and extension component to improve the production level of the farms and consequently their technical efficiency.
The analysis of technical and economic efficiencies determinants of irrigation water use, shows the necessity to revise the water tariff. Thus this factor allows to encourage farmers to better manage irrigation water use according to crop water requirement and not according to the importance of the cost of this input, and consequently on the technical efficiency of its use.
The improvement of economic efficiency of irrigation water use depends also to the possibility of revising the irrigation water tariff downwards, since it depends to technical supervision at farm level.
On the basis of the foregoing, it is opportune to focus on several aspects in order to improve the different types of efficiencies. Indeed, the State must ensure the aspect of the technical supervision of farmers in the two perimeters, which will help better control the technical conduct of citrus fruit.
The analysis of the partnership contract concludes the absence of an article on the possibility of revising irrigation water tariff, then the reduction of water price for El Guerdane farmers very difficult, or even impossible.
References
[1] Yigezu A., Mohamed A., Kamil S., Aden A., Tamer E. and Samman A., (2013). Implications of a shift in irrigation technology on resource use efficiency: A Syrian case. [2] Allan, T., 1999. Productive efficiency and allocative
efficiency: why better water management may not solve the problem. Agric. Water Manage. 40, 71–75.
[3] World Bank, (2016). How to develop sustainable irrigation projects with private sector participation.
[4] Austin P., (2011). An Introduction to propensity score Methods for reducing the effects of confounding in observational Studies, Multivariate Behavioral Research, Vol.
46 (3), pp 399-424.
[5] Agresti A., (2013). Categorical Data Analysis. John Wiley & Sons, Hoboken, New Jersey.
[6] Cochran W. et Rubin D., (1973). The Indian Journal of Statistics, Series A (1961-2002), Vol. 35 (4), pp 417-446. [7] Farrell M., (1957). The measurement of productive efficiency,
Journal of the royal statistical society, Vol. 120 (3), pp 253-290.
[8] Amara N., Romain R., (2000). Mesure de l’efficacité technique: Revue de la littérature. La série Recherche des cahiers du CREA, U. Laval Canada, Septembre 2000, pp 32. [9] Shomo F., Ahmed M., Shideed K., Aw-Hassan A., and Erkan
O., (2010). Sources of technical efficiency of sheep production systems in dry areas in Syria, Small Ruminant Research, Vol. 91 (3), pp 160-169.
[10] Zhang T., and Xue B. D., (2005). Environmental efficiency analysis of China’s vegetable production, Biomedical and Environmental Sciences, Vol. 18, pp 21-30.
[11] Kebede T. A., (2001). Sources of technical efficiency of sheep production systems in dry areas in Syria, Sources of technical efficiency of sheep production systems in dry areas in Syria, A master’s thesis. Department of Economics and Social Sciences, Agricultural University of Norway, Norway.
[12] Battese G. E. and Coelli T., (1995). A model of technical inefficiency effects in a stochastic frontier production function for panel data. Empirical Economics, Vol. 20, pp 325-332. [13] Karagiannis G., Tzouvelekas V. and Xepapadeas A., (2003).
Measuring irrigation water efficiency with a stochastic production frontier: an application to Greek out-ofseason vegetable cultivation. Environ. Resource Econ. Vol. 26, pp 57–72.
[14] Kopp R. J., (1981). The measurement of productive efficiency: a reconsideration. Quart. J. Econ, Vol. 96, pp 477–503. [15] Akridge, J. T., (1989). Measuring productive efficiency in
multiple product agribusiness firms: a dual approach. Am. J. Agric. Econ, Vol. 71, pp 116–125.
[16] Leveque J. and Roy W., (2004). Quelles avancées permettent les techniques de frontière dans la mesure de l’efficience des exploitants de transport urbain, XIVème journées du SESAME, 23, 24 et 25 septembre 2004, pp 19.
[17] Christensen L. R., Jorgenson D. W. et Lou L. J., (1973). Transcendental logarithmic production frontiers. Rev. Econ. Stat, Vol. 55, pp 28–45.
[18] Kneller R. and Stevens A., (2003). The specification of the aggregate production function in the presence of inefficiency. Econ. Lett, Vol. 81, pp 223–226.
[19] Duffy, J., Papageorgiou, C., (2000). A cross-country empirical investigation of the aggregate production function specification. J. Econ. Growth, Vol. 5, pp 87–120.
[20] Varian, H. R., (1978), Microeconomic Analysis. W. W. Norton and Co. Inc., New York.