http://www.sciencepublishinggroup.com/j/ijnfs doi: 10.11648/j.ijnfs.20170606.12
ISSN: 2327-2694 (Print); ISSN: 2327-2716 (Online)
Intelligent Prediction of Abalone Boiling Time and
Temperature Using Apparent Characteristics
Xiaoyan Fang
1, 2, Jiaxu Dong
1, 2, Huihui Wang
1, 2, Xu Zhang
1, 2, Xueheng Tao
1, 2, *1Key Laboratory for Seafood Processing Technology and Equipment of Liaoning Province, Dalian Polytechnic University, Dalian, China 2
National Engineering Research Center of Seafood, Dalian, China
Email address:
[email protected] (Xueheng Tao)
*Corresponding author
To cite this article:
Xiaoyan Fang, Jiaxu Dong, Huihui Wang, Xu Zhang, Xueheng Tao. Intelligent Prediction of Abalone Boiling Time and Temperature Using Apparent Characteristics. International Journal of Nutrition and Food Sciences. Vol. 6, No. 6, 2017, pp. 221-227.
doi: 10.11648/j.ijnfs.20170606.12
Received: August 2, 2017; Accepted: August 26, 2017; Published: September 26, 2017
Abstract:
In this study, changes in the apparent characteristics of abalone under a range of boiling temperatures and times were assessed. The trends of shape, color, and texture were statistically analyzed, while the Back Propagation (BP) neural network model was established by monitoring these 3 characteristics under different times and temperatures. This achieved a model of the characteristic parameters to predict the optimum boiling time and temperature, which can be used as a reference for abalone-processing technology. The results show that, although the model is acceptable, the BP neural network model with color feature offered the best predictor rate at 81.74%.Keywords:
Abalone, BP Neural Network, Image Feature, RGB Color Model, Gray-Level, Co-occurrence Matrix1. Introduction
Of the 216 species of abalone to have been identified worldwide, around 30 are commonly occurring [1]. Haliotis discus and Haliotis diversicolor are varieties representative of northern and southern China respectively [2, 3]. Abalone has long been renowned for its rich nutritional value and use in a variety of active ingredients [4]. The mollusks’ scattered distribution throughout the sea and difficulties over fishing, together with their high market value and stability, have led to them enjoying a reputation as “soft gold.” In recent years, thanks to increasing demand throughout society, the abalone aquaculture industry has been in a state of expansion; China’s annual output now represents only 90% of the global total [5]. This increase has also caused a rise in related research, particularly on the influence of different processing conditions on the product’s quality. Processing methods have also gradually changed to achieve ready-to-eat abalone produced by deep processing [6]. In regards to consumers assessing the quality of specimens, characteristics such as appearance, color, and texture are the most critical factors. Abalone is composed of myofibrillar protein and collagen protein, which are
reduction in quality. Most of the previous studies were focused on abalone’s varying structure, texture, and composition under different boiling conditions, meaning that studies of its apparent changes are rare. To address this, the focus of this study is on the apparent characteristics of abalone. After the establishment of the Back Propagation (BP) neural network model, it was used to predict the required boiling time and temperature, which can be used as a reference for abalone-processing technology.
2. Materials and Methods
2.1. Abalone and Heat Treatment
Abalone can be purchased on the Dalian seafood wholesale market. A circular knife blade is applied to the inner shell of the fresh abalone to separate the shell from the meat and remove the internal organs and reproductive glands. The black film on the surface is cleaned with a soft brush. Heat treatments of specimens were conducted for 0.5, 1, 2, 4, and 6 h at water temperatures of 50, 60, 80, 85, 90, and 100°C respectively. After heat treatment, the abalone were cooled to room temperature and cleaned of surface water before being subjected to a series of characterization experiments.
2.2. Determination of Shape Change
As abalone has a unique shape, its specific size is difficult to measure. Therefore, we used the German GOM ATOS 3-dimensional optical scanner for scanning, which has very high accuracy (see Figure 1). The abalone model (with accuracy of up to 0.01 mm) obtained by 3D reverse scanning could accurately measure the change in volume and surface area under different boiling conditions. The 3D scanning of the abalone is shown in Figure 2.
Figure 1. German GOM ATOS 3-dimensional optical scanner.
Figure 2. Abalone images obtained by 3-dimensional reverse scanning.
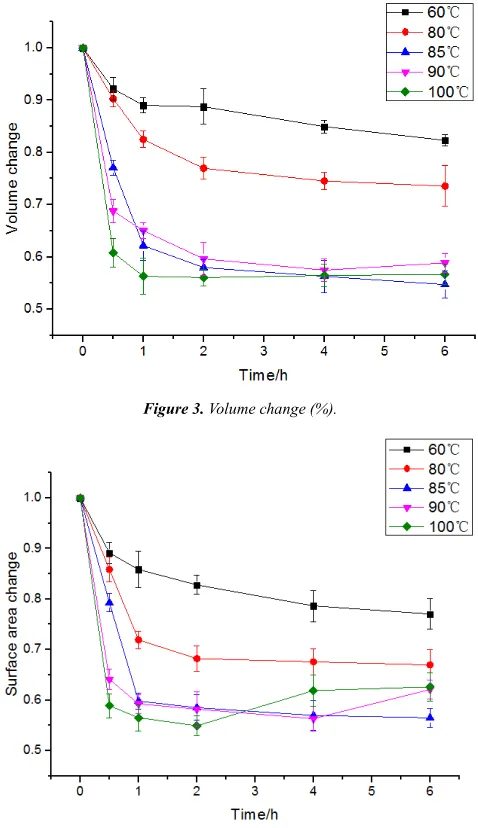
We obtained data on the abalone’s volume and surface area to a high degree of accuracy, as shown in Tables 1 and 2. These variables were measured before and after heat treatment to obtain the ratio (%) of volume and surface area loss. The loss was calculated as:
% = ∗ 100% (1)
Where W1 and W2 represent the volume or surface area
before and after heat treatment respectively. The changes are shown in Figures 3 and 4.
Figure 3. Volume change (%).
Figure 4. Surface area change (%).
2.3. The Color Feature of the Image
The color feature belongs to the internal characteristics of the image and describes its surface properties [12]. Unlike other visual features, it is not sensitive to changes in the size, orientation, and vision of the image, leading to its widespread application in image recognition. See the collected images (Figure 5) from the RGB pace [13].
Figure 5. Abalone image collected by industrial camera.
Because the color distribution information of the image is mainly concentrated in the lower order moments, only the first, second, and third order moments are required to express said distribution [14]. The image’s color moments describe its macroscopic probability and statistical characteristics without the need to quantify the image characteristics [15]. For a picture, the 3 low-order color moments of the mathematical expression would take the form:
u = ∑ (2)
1 2 2 1
1
( )
N j j
P u
N
σ =
=(
∑
− ) (3)1 3 3
1
1
( ( ) )
N
j j
s P u
N =
=
∑
− (4)Where , , respectively represent the mean、variance and skewness; and
p
i is the image of the firsti
pixel colorvalue. Since an image has 3 color components, it has 3 lower order moments per component, which is very simple compared to other color features [16].
The RGB color model can be represented in a 3-dimensional Cartesian coordinate system (Figure 6), and each color image of the model includes 3 independent primary colors. Each color component also includes 3 color moments, meaning that the 3 R, G, and B components can attain 9 eigenvectors. We continued with the color moment statistics to obtain 60 pictures, as a result of the large amount of data, which allowed only for a representation of the data display.
Figure 6. RGB color model.
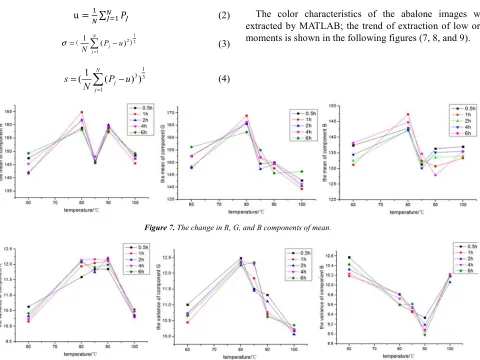
The color characteristics of the abalone images were extracted by MATLAB; the trend of extraction of low order moments is shown in the following figures (7, 8, and 9).
Figure 7. The change in R, G, and B components of mean.
Figure 9. The change in R, G, and B components of skewness.
Based on these figures, it may be observed that the mean of the R, G, and B components reached their peak at 80°C. The mean reflects the depth of color, which shows that temperatures from 60 to 80°C caused the surface color of abalone to deepen. At 85°C, the mean decreased significantly as the temperature rose.
The second moment is also called the variance and reflects the color value’s fluctuations around the color mean. The smaller the value, the better the color consistency of the image. At 80, 85, and 90°C, the variance in the R and G components had a greater value, indicating that the color of the abalone being heated was relatively large, while the B component was relatively stable.
The 3-order moment describes the symmetry of color distribution.
At 80, 85, and 90°C, the skewness of the R and G components was relatively significant, illustrating that the asymmetry of the color distribution was considerable under these conditions; however, at 100°C, the skewness was relatively minor and the color distribution more symmetrical.
2.4. Texture Feature of the Image
Texture is a perception of the natural phenomenon from the visual system. It is widespread in nature as one of the basic properties of a surface, which can always be used as important characteristics with which to describe and distinguish different objects. In general, an image of the object in the real world does not show regional uniformity; texture consists of repetitive patterns that are arranged in a certain order.
2.4.1. Gray-Level Co-occurrence Matrix
Texture features, when applied, tend toward being non-spectral. Image texture analysis is a technology that was first developed in the 1970s. The method of extracting texture features based on the gray-level co-occurrence matrix is a classical statistical analysis method. Such matrices are defined as the probability that the gray scale j is separated from a fixed position relation d = (
D
x,D
y) from the gray level i. The gray level co-occurrence matrix is represented by( , )( ,
0,1,2,...
1)
dp i j i j
=
L
−
, where L represents the gray levelof the image and i and j represent the gray levels of the pixels respectively. d represents the spatial position relationship between 2 pixels; the other d determines the distance and
direction between 2 pixels.
θ
is the direction of the generation of the gray-level co-occurrence matrix, usually 0°, 45°, 90°, and 135° in four directions. In general, when considering the direction, it is often calculated by the four directions of the gray level co-occurrence matrix identified by the texture feature values. Then, the mean of the eigenvalues in each direction is taken as the final texture component, as shown in Figure 10 [18].Figure 10. Pixel pair of gray coefficient matrices.
When the position relation d between two pixels is selected, gray level co-occurrence matrices of said relation are generated.
(0,0) (0,1) (0, ) (0, 1)
(1,0) (1,1) (1, ) (1, 1)
( ,0) ( ,1) ( , ) ( , 1)
( 1,0) ( 1,1) ( 1, ) ( 1, 1)
d d d d
d d d d
d
d d d d
d d d d
p p p j p L
p p p j p L
p
p i p i p i j p i L
p L p L p L j p L L
⋅⋅⋅ ⋅⋅⋅ −
⋅⋅⋅ ⋅⋅⋅ −
⋅⋅⋅ ⋅⋅⋅ ⋅⋅⋅ ⋅⋅⋅ ⋅⋅⋅ ⋅⋅⋅
= ⋅⋅⋅ ⋅⋅⋅ −
⋅⋅⋅ ⋅⋅⋅ ⋅⋅⋅ ⋅⋅⋅ ⋅⋅⋅ ⋅⋅⋅
− − ⋅⋅⋅ − ⋅⋅⋅ − −
An element of the gray-level co-occurrence matrix represents the number of occurrences of a gray-scale combination; for example, the element
p
d(0,1)
represents thenumber of occurrences of the 2 pixel gradients with the positional relationship d on the image being 1 and 0, respectively.
2.4.2. The Characteristic Parameters of the Gray-Level Co-occurrence Matrix
with a portion of the image-processing algorithm to attain the characteristics required. The gray-level co-matrices reflect comprehensive information regarding the direction of the image, the interval, and the magnitude of the change. The local pattern and permutation rules of the image can be analyzed via the matrix. In the interests of more intuitively describing the texture condition in the matrix, the coherent matrix is not directly applied, but the secondary statistic is obtained on the basis of it. Haralick defined 14 feature parameters of a gray-level co-occurrence matrix for texture analysis [19]. Ulaby, meanwhile, found that in the 14 texture features based on GLCM, only 4 are not related; however, these 4 are not only easy to calculate but can also give a higher classification accuracy [20].
1)The second moment (energy):
1 1 2
1 0 0
( , ) L L
i j
f
p
d i j− −
= =
=
∑∑
(5)Because the second moment is the sum of the squares of gray-level co-occurrence matrices, it is also called energy and reflects the thickness and uniformity of the texture.
2)Contrast:
1 1 1
2 2
0 0 0
( , )
L L L
d
n i j
f n p i j
− − − ∧ = = = =
∑
∑ ∑
(6)Contrast reflects the degree of sharpness of the image and the depth of the texture groove.
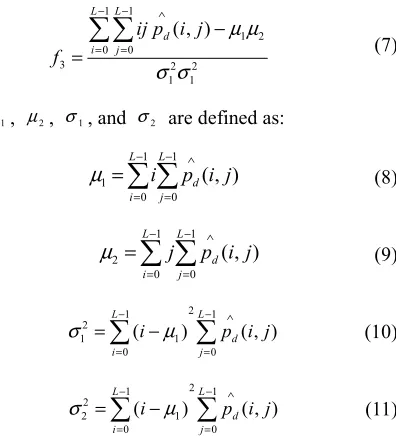
3)Correlation:
1 1
1 2 0 0
3 2 2
1 1
( , )
L L
d i j
ij p i j f µ µ σ σ − − ∧ = = − =
∑∑
(7)Where µ1, µ2, σ1, and σ2 are defined as: 1 1 1 0 0 ( , ) L L d i j
i p i j
µ
− − ∧= =
=
∑ ∑
(8)1 1 2 0 0 ( , ) L L d i j
j p i j
µ
− − ∧= =
=
∑ ∑
(9)2 1 1 2 1 1 0 0 ( ) ( , ) L L d i j
i p i j
σ − µ − ∧
= =
=
∑
−∑
(10)2 1 1 2 2 1 0 0 ( ) ( , ) L L d i j
i p i j
σ − µ − ∧
= =
=
∑
−∑
(11)The correlation is used to measure the degree of similarity of the elements of gray-level co-occurrence matrices in the row or column direction.
4)Entropy:
1 1
4
0 0
( , ) log ( , ) L L
d d
i j
f p i j p i j
− − ∧ ∧
= =
= −
∑∑
(12)Entropy represents the degree of nonuniformity or complexity of the texture in the image. The values of the 4 features we extracted from the image are shown in Table 1.
Table 1. Feature values extracted from gray level co-occurrence matrix.
Energy Temperature/°C Contrast Temperature/°C
Time/h 60 80 85 90 100 Time/h 60 80 85 90 100
0.5 0.243809 0.208065 0.197972 0.216074 0.247242 0.5 2.021391 2.024142 2.111341 1.992384 1.759778
1 0.211159 0.225293 0.195433 0.177786 0.239552 1 2.102907 2.026272 2.166307 2.131867 1.906331
2 0.235221 0.207201 0.200485 0.181411 0.221516 2 1.994889 2.097396 2.112964 2.120145 1.986218
4 0.222758 0.198129 0.195687 0.193883 0.229354 4 2.048261 2.193453 2.181758 1.953956 1.949371
6 0.231354 0.209581 0.197239 0.187665 0.235046 6 2.023761 2.120987 2.190017 2.045079 2.022287
Correlation Temperature/°C Entropy Temperature/°C
Time/h 60 80 85 90 100 Time/h 60 80 85 90 100
0.5 0.627891 0.615217 1.128121 1.21383 0.552009 0.5 0.026956 0.029791 0.029596 0.029932 0.027338
1 0.725467 0.695114 1.153151 0.935506 0.557938 1 0.028776 0.030571 0.029384 0.033685 0.026364
2 0.649568 0.636001 1.499555 1.109801 0.670761 2 0.026961 0.030441 0.028858 0.032988 0.027788
4 0.647054 1.22813 1.241181 1.098973 0.673812 4 0.028756 0.030304 0.029608 0.033051 0.027293
6 0.666353 1.172384 1.242404 0.890348 0.641645 6 0.029361 0.027575 0.030036 0.032095 0.026818
2.5. Establishment of BP Neural Network Model
The BP neural network, whose structure is shown in Figure 11, is a feed-forward interconnected network featuring 3 or more layers. In addition to the input and output layers, the network also comprises one or more hidden layers; in addition, no connection exists between neurons in the same layer. The BP neural network model has a strong self-learning and fault-tolerant ability. Because it deploys non-linear separable mapping, the data requirements of its variable are not particularly strict. The autocorrelation of data and the absence of individual data have little effect on the model’s prediction
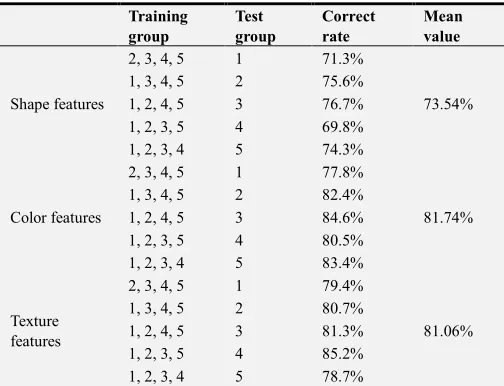
The BP neural network model was established to determine the characteristics and processing technology of abalone. The data for the abalone’s shape, color, and texture features were extracted as input, while processing technology was the desired output. To increase the prediction’s accuracy, cross-validation experiments were adopted. The 100 samples were divided into 5 mutually exclusive groups, each containing 20 samples. Then, we used the first 4 groups to train and group 5 to test; then, groups 1, 2, 3, and 5 to train and group 4 to test; then, groups 1, 2, 4, and 5 to train and group 3 to test; and so on. In this way, we could create a contingency table using all 100 samples. The results are displayed in Table 2.
Table 2. The results of the neural network model prediction.
Training group
Test group
Correct rate
Mean value
Shape features
2, 3, 4, 5 1 71.3%
73.54%
1, 3, 4, 5 2 75.6%
1, 2, 4, 5 3 76.7%
1, 2, 3, 5 4 69.8%
1, 2, 3, 4 5 74.3%
Color features
2, 3, 4, 5 1 77.8%
81.74%
1, 3, 4, 5 2 82.4%
1, 2, 4, 5 3 84.6%
1, 2, 3, 5 4 80.5%
1, 2, 3, 4 5 83.4%
Texture features
2, 3, 4, 5 1 79.4%
81.06%
1, 3, 4, 5 2 80.7%
1, 2, 4, 5 3 81.3%
1, 2, 3, 5 4 85.2%
1, 2, 3, 4 5 78.7%
In general, use of the BP neural network model to determine the correct rate of 70% or more was acceptable, meaning that the 3 models, based on apparent features, are ideal. This shows that the neural network model is sufficient to study the data information contained in the sample, which is helpful for improving the discrimination ability of the unknown sample. The results demonstrate that the model of the color feature is the most suitable, reaching 81.74%.
3. Results and Discussion
1. The shape, color, and texture of abalone under different process conditions were extracted. Through the 3-dimensional reverse scan to attain the entity, we extracted the volume and surface area of the rate of change. In the RGB color model, the color characteristics in the lower order moments could be obtained via MATLAB image processing. The texture features were mainly expressed by the 4 features commonly used in the gray level co-occurrence matrix.
2. The BP neural network model was established by 3 characteristics of abalone image and processing technology. It was possible to predict the boiling time and temperature of the abalone through the image feature. Although the prediction effect of all 3 models was acceptable, the BP neural network model with color feature was the best with a correct rate of 81.74%. The BP neural network was more comprehensive and
contained the information of the original data; therefore, this model has a wide application prospect and application value in the analysis and research of abalone processing.
Conflict of Interests
The authors declare that there is no conflict of interests regarding the publication of this paper.
Acknowledgements
The authors acknowledge the National Engineering Research Center of Seafood. This work was supported by Public Science and Technology Research Funds Projects of Ocean (No.201505029).
References
[1] Bei-wei Zhu, Xiu-ping Dong, Li-mei Sun, et al. Effect of thermal treatment on the texture and microstructure of abalonemuscle (Haliotis discus) [J]. Food Science and Biotechnology, 2011, 20(6): 1467-1473.
[2] Xiu-ping Dong, Qi-xin Yuan, Hang Qi et al. Isolation and Characterization of Pepsin-Soluble Collagen from Abalone (Haliotis discus hannai) Gastropod Muscle Part Ⅱ[J]. Food science and technology research, 2012, 18(2): 271-278. [3] Jin Zhou; Zhong-Hua Cai and Ke-Zhi Xing et al. Potential
mechanisms of phthalate ester embryotoxicity in the abalone Haliotis diversicolor supertexta [J]. Environmental Pollution, 2011, 159(5): 1114-1122.
[4] Gui-hua Xiao, Bei-wei Zhu, Xiu-ping Dong, et al. Effects of Hot Processing Conditions on Partial Processing Properties of Abalone [J]. Journal of Dalian Institute of Light Industry, 2012, 31(1): 1-7. DOI: 10.3969/j.issn.1674-1404.2012.01.001. [5] Jie Ouyang, Jia-yu TAN, Jian Shen, Effect of Freezing Method
and Temperature on the Quality of Abalone [J]. Modern food science and technology, 2014, 06: 214-218+139.
[6] Xin Gao; Hiroo Ogawa*; Yuri Tashiro; Naomichi Iso, Rheological properties and structural changes in raw and cooked abalone meat. Fisheries Sci. 67: 314-320 (2001). [7] Xin Gao, Zhao-hui Zhang, Zhi-xu Tanag, et al. The
Relationships between Rheological Properties and Structural Changes of Chilled Abalone Meat [J]. Journal of Qingdao Ocean University (English Edition), 2003, 2(2): 171-176. [8] Li Deng, Yan Li, Xiu-ping Dong, et al. Chemical interactions
and textural characteristics of abalone [9] Zhang YQ, Study on the processing methods of abalone and its rheological characteristic [D]. China Ocean University, 2008. DOI: 10.7666/d.y1337933.
[9] Yaqi Zhang, Study on the processing methods of abalone and its rheological characteristic [D]. China Ocean University, 2008. DOI: 10.7666/d.y1337933.
[11] Xiu-li Ma. Research on Friut Surface Quality Detection Based on Digital Image Processing [D]. Northeastern University, 2011.
[12] Hao YU, Yan Sun. Image Search based on Color Moment and Shape Invariant Moment [J]. Computer knowledge and technology. 2015, 11(19): 174-175.
[13] Ye-qin Wang, Zhi –guo Zhao. Expression on the Basis of the Timber Surface Color Characteristic of the Histogram and Color Moment Method [J]. Forestry Science, 2006, 31(5): 56-58. DOI: 10.3969/j.issn.1001-9499.2006.05.020.
[14] Shao-bo Zhang, Shu-hai Quan, Ying Shi, et al. Study on Image Retrieval Algorithm Based on Color Moment [J]. Computer Engineering, 2014, 40(6): 252-255. DOI: 10.3969/j.issn.1000-3428.2014.06.054.
[15] Ding Han, Pei Wu, Qiang Zhang, et al. Feature extraction and image recognition of typical grassland forage based on color moment [J]. Journal of Agricultural Engineering, 2016, 32(23): 168-175. DOI: 10.11975/j.issn.1002-6819.2016.23.023. [16] Chuan-hua Zeng, Hong Chen, Yun Gao, et al. Bamboo Color
Grading Method Based on SVM and Color Moment [J]. Hubei Agricultural Sciences, 2010, 49(2): 455-457. DOI: 10.3969/j.issn.0439-8114.2010.02.065.
[17] Peng-peng Jiao, Yi-zheng Guo, Li-juan Liu, et al. Implementation of Gray Level Co-occurrence Matrix Texture Feature Extraction Using Matlab [J]. Computer technology and development, 2012, (11): 169-171.
[18] Cheng-cheng Gao, Xiao-wei Hui. GLCM-Based Texture Feature Extraction, 2010, 19(6): 195-198. DOI: 10.3969/j.issn.1003-3254.2010.06.047.
[19] Haralick R M, Shanmugam K. Texture features for image classification. IEEE Trans. on Sys, Man, and Cyb, 1973, SMC-3(6): 610-621.
[20] Ulaby FT, Kouyate F, Brisco B, et al. Textural information in SAR Images. IEEE Transactions on Geoscience and Remote Sensing, 1986, 24(2): 235-245.