Correlative Study of LWD, DCP and CBR for
sub-grade
AE. Prakashkumar Makwana1, Dr. Rakesh kumar2
1- Indian Institute of Technology, Roorkee, Uttarakhand - 247667 Road & Building Department, Government of Gujarat (Assistant Eng.)
2- Sardar Vallabhbhai National Institute of Technology, Surat
ABSTRACT
The mechanistic – empirical pavement design approach is a utilizing the sub-grade modulus but to evaluate a modulus is a costly, laborious and complex as compared to california bearing ratio (CBR) and dynamic penetration index (DPI). For rapid work and to benefit pavement engineer, robustly correlation model equations are required to connect sub-grade modulus with CBR and dynamic cone penetrometer (DCP) obtained dynamic penetration index (DPI). In this study, the light weight deflectometre (LWD) has been used to evaluate in-situ sub-grade modulus, the DCP for DPI and core cutter for field dry density (FDD). Total 52 pit locations of the Kutch region of Gujarat state were finalized to perform tests on in-service flexible pavement and also samples were
collected from each location for laboratory
examination. The statistical package for the social sciences (SPSS) tool was used for developing a regression model. Power regression models were found in the best fit, which connecting soaked CBR with DPI, sub-grade modulus with DPI and CBR, and shows a strong correlation of a coefficient of
determination (R2) of 0.876, 0.811 and 0.859
respectively. Linear regression models were developed for connecting sub-grade and CBR with geotechnical parameters such as plasticity index (PI), water content (W) and field dry density.
Keyword: Sub-grade modulus, california bearing ratio, light weight deflectometre, dynamic cone penetrometer.
I. Introduction
Sub-grade is a vital component of pavement, all adverse overlying loads are transmitted through the soil via sub-grade, it does provide a main support to foundation structure and also stability to embankment. Therefore, its prime important to build up a sub-grade safely to withstand all adverse loading conditions and it should be strong enough to transfer overlying loads within critical failure criteria. Evaluation of sub-grade is an absolute need, and it also enables to proper choice of materials for pavement to hold out its deign to run satisfactorily.
Traditionally, sub-grade strength is measured by california bearing ratio (CBR). It is a comparison of sub-grade soil with standard california
limestone (basalt rock) in terms of resistance against penetration. IRC- 37 (2012) recommended sub-grade should have minimum eight percent CBR value for heavy traffic road. A conventionally empirical pavement design is based on CBR value and quality control work is measured by density and moisture content, and assessment of modulus value is not part of design (Gurp et al., 2010). Researchers found, significant relations are existing between a sub-grade modulus, CBR value, dynamic cone penetrometer (DCP) obtained dynamic penetration index (DPI) and geotechnical parameter, while these measures have different test characteristics. CBR and DCP are a penetration test and density is a compaction test. Nowadays, change in pavement design methodology from empirical to semi- mechanistic approach to better performance of pavements (Ahmad, 2007). NCHRP
(2004) guidelines and semi – mechanistic approach
focuses on elastic modulus value. IRC-37 (2012) also encompasses design with elastic modulus value. Rathje et al. (2006) encourage modulus values as a quality control examination. Thus, its absolute requirement to measure sub-grade strength in terms of modulus value. Many non-destructive testing (NDT) tools are available to measure in-situ modulus of sub-grade and the light weight deflectometer (LWD) emerge as a well-established tool due to light weight but it demands a disciplined individual to take the measurement. Moreover, to assess various parameters for performances and quality control work is not workable. Thus, it’s all important need to develop models to connect parameters for beneficial to pavement engineers for rapid works.
The aim of this study is to develop correlation model equations of soaked CBR with DCP obtained DPI, sub-grade modulus with DPI and CBR, and also influences of geotechnical parameters such as, plasticity index, water content and field dry density on sub-grade modulus and CBR for state of practice of Kutch area of Gujarat. In-situ tests were conducted on in-service flexible pavement and also samples were collected for laboratory tests. Total 52 test pit locations were chosen. Foremost, the LWD test was conducted on sub-grade followed by the DCP test and the core cutter test and laboratory tests.
II. Literature Review
due to appreciation of semi-mechanistic design approach. Conventional methods are laborious and time consuming (Erlingsson, 2007). Consequently, researchers try to robustly correlate the CBR with DCP obtained DPI, sub-grade modulus value with DPI
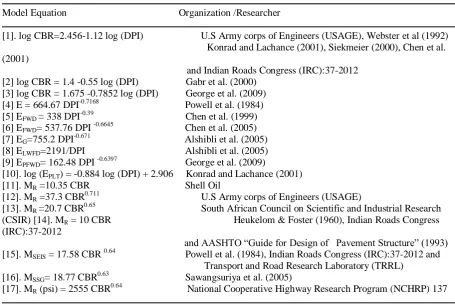
and CBR for convenience of pavement engineers for rapid and economical purpose. Early interrelation model equations developed by diverse organizations and researchers are represented in Table 1
Table 1 Interrelation model equations
Model Equation Organization /Researcher
[1]. log CBR=2.456-1.12 log (DPI) U.S Army corps of Engineers (USAGE), Webster et al (1992) Konrad and Lachance (2001), Siekmeier (2000), Chen et al. (2001)
and Indian Roads Congress (IRC):37-2012 [2] log CBR = 1.4 -0.55 log (DPI) Gabr et al. (2000)
[3] log CBR = 1.675 -0.7852 log (DPI) George et al. (2009) [4] E = 664.67 DPI-0.7168 Powell et al. (1984) [5] EFWD = 338 DPI-0.39 Chen et al. (1999)
[6] EFWD= 537.76 DPI -0.6645 Chen et al. (2005)
[7] EG=755.2 DPI-0.671 Alshibli et al. (2005)
[8] ELWFD=2191/DPI Alshibli et al. (2005)
[9] EPFWD= 162.48 DPI -0.6397 George et al. (2009)
[10]. log (EPLT) = -0.884 log (DPI) + 2.906 Konrad and Lachance (2001)
[11]. MR =10.35 CBR Shell Oil
[12]. MR =37.3 CBR0.711 U.S Army corps of Engineers (USAGE)
[13]. MR =20.7 CBR0.65 South African Council on Scientific and Industrial Research
(CSIR) [14]. MR = 10 CBR Heukelom & Foster (1960), Indian Roads Congress
(IRC):37-2012
and AASHTO “Guide for Design of Pavement Structure” (1993)
[15]. MSEIS = 17.58 CBR 0.64 Powell et al. (1984), Indian Roads Congress (IRC):37-2012 and
Transport and Road Research Laboratory (TRRL) [16]. MSSG= 18.77 CBR0.63 Sawangsuriya et al. (2005)
[17]. MR (psi) = 2555 CBR0.64 National Cooperative Highway Research Program (NCHRP) 137
Note: MR, MSEIS, MSSG, E, EFWD, EG, EFWD, EPFWD and EPLT are in MPa. CBR in percentage and DPI in mm/blow
A. Relationship between CBR and DCP obtained DPI
The DCP and CBR, both are penetration tests and have significant interrelation. Sawangsuriya et al. (2005) and Rao et al. (2008) described a usefulness and potentiality of the DCP to find out a reliable and significant CBR values. In this section, it is briefly reviewed.
Equation [1] is extensively used worldwide and was established by Webster et al. (1992) and it was earlier developed by a U.S. army corps of engineers (USAGE) for cohesive and granular material of sub-grade. Konrad and Lachance (2001), Siekmeier (2000), Chen et al. (2001) and IRC: 37-2012 have also used it. Gabr et al. (2000) used the DCP for investigation of pavement distress condition using penetration rate for sub-base, sub-grade and developed an Equation [2]. George et al. (2009) developed an equation [3] with the coefficient of determination (R2) of 0.82 and penetration rate and CBR ranges from 1 to 18.3 mm per blow and 3.9 to 50 percentages respectively.
B. Relationship between sub-grade modulus and DPI
From 1980’s, researchers have attempted to correlate the sub-grade modulus with penetration index and assorted logical attempt made by Chua and Lytton (1981), Alshibli et al. (2004), Seyman (2003) and Pen (1990). Some of the more acceptable equation models are present in Table 1. Powell et al. (1984) combined Equation [15] & [1] and proposed extensively used Equation [4]. Chen et al. (1999) developed an equation [5], in which the relation has been developed between falling weight deflectometre (FWD) and DCP, where EFWD is FWD obtained modulus in MPa and DCP
found a good relationship between the light falling weight deflectometre (LFWD) obtained moduli with DPI and observed the coefficient of determination (R2) is 0.72, where EG is Geo-gauge obtained modulus and
ELWFD is a LWFD obtained modulus in MPa and DPI
in mm per blow. George et al. (2009) proposed an equation [9] for lateritic sub-grade and observed the coefficient of determination (R2) of 0.73 with standard error of 0.295, where the DPI range varies from 1 to 18.3 mm per blow and sub-grade modulus ranges from 20 to 174.1 MPa. Konrad and Lachance (2001) developed Equation [10] and observed the coefficient of determination (R2) of 0.92, where EPLT is the elastic
modulus of unbound aggregates and natural granular soils and it is back calculated from plate load tests. DPI is in mm per blow and determined by using a 51 mm diameter cone with the application of a 63.5 kg hammer dropping from height 760 mm on anvil.
C. Relationship between sub-grade modulus and CBR
Early developed correlations between sub-grade modulus and CBR values are exemplified throughout this segment. Equation [11], [12] and [13] have been used by Witczak et al. (1995) and Erlingsson (2007), stress values and moisture content have high influenced on the sub-grade modulus but these are not considered in the equations. Equation [14] and [15] are widely practiced, and well-known equations proposed by Heukelom & Foster (1960) and Powell et al. (1984) respectively. In Equation [14], MR is a modulus
obtained from resilient modulus test (AASHTO T:307-99) and CBR test (AASHTO T:139). In Equation [15], MSEIS is the modulus value obtained
from seismic test after some adjustments to stress levels. These equations have been practiced by researchers and also included in pavement design guidelines in AASHTO (1999) and IRC: 37-2012. IRC: 37-2012 recommended when CBR is less than or equal to five percentage than use Equation [14] or else use Equation [15]. Sawangsuriya et al. (2005) propose an equation [16], where MSSG is modulus value
evaluated using soil stiffness gauges (Humboldt Geo gauge) and CBR is determined by the DCP using an Equation [8] and observed the coefficient of determination (R2) of 0.74. Equation [17] is a developed by NCHRP1-37A, where MR is a modulus
value in psi and CBR in percentage.
Lin et al. (2006) observed the DCP obtained CBRs were higher as compared to the laboratory obtained CBRs. Portable falling weight deflectometre (PFWD) obtained moduli were always lower than DCP obtained moduli and also closer to moduli obtained from laboratory obtained CBRS. Kavussi et al.
(2010) found a CBR and PFWD moduli have a good correlation within the range 20% to 80% of CBR values and also found a lesser significant relation for low strength material, where CBR values are less than 20%.
D. Relationship of sub-grade modules, CBR with Geotechnical parameter
In this section, correlations of modulus and CBR with geotechnical parameters are briefly reviewed. Sulewska (2004) found a dynamic modulus of deformation obtained by the light drop-weight tester increases with the increase in degree compaction. Erlingsson (2007) constitute an increase in the trend of CBR with the increasing trend in dry density and also increases in modulus but relationships are not strongly significant. Moreover, significant correlation may be produced when a moisture content is considered. George et al. (2009) found a positive effect of dry density and negative effect of liquid limit, plasticity index and moisture content on the modulus value obtained through PFWD and also on CBR values, and also observed the coefficient of determination (R2) of 0.83 and 0.85 respectively. Tehrani (2014) developed regression models between nuclear density gauge (NDG) obtained dry unit weight with LWD obtained modulus values and also with DCP obtained modulus value with the coefficient of determination (R2) of 0.475 and 0.58 respectively. Moreover, dry unit weight has positive and water content causes a negative influence as also found by Tripathi et al. (2016)
III. Instruments and its Working Principle.
A. Light weight deflectometer (LWD)
The LWD was developed in Germany and has a same working principle of the falling weight deflectometer. Many commercial LWD tools are available, such as the GDP, the TFT, the Prima 100, Loadman, Inspector -2 and Zorn ZFG 2000.
The LWD test is a plate-bearing test. The pre-defined load pulse generated by a falling weight, dropped on a buffer system that transmits the load pulse through a circular loading plate resting on the sub-grade. The deflections measured using the LWD are furthermore used to determine the layer modulus. In this study, the LWD produced by dynatest (PRIMA 100) was used. The resulting force and velocity time histories and deflections are measured respectively below the center of the loading plate. Corresponding displacement time histories are automatically obtained by means of integration of the recorded velocity. The instrument is linked to a personal digital assistant (PDA), it is an equipped with the software for recording, data interpretation, and visualization. Measured deflection values are used for estimating sub-grade modulus by using the boussinesq's solution combined with the odemark’s method of equivalent thickness (MET) principles. The value of the surface layer modulus is obtained by equation [18] and it was expressed by Egorov (1965), where E0 isthe surface
σ0is contact pressure at load (KPa), a is a radius of the
load (mm), d0 is deflection under the center of the load
(μm) and is poisson’s ratio.
= 2(1- ) a / Equation [18]
The popularity of the LWD is due to its portability with a weight of approximately 15 kg to 25 kg and it can be operated with a one person and test can be done in 1 to 2 minutes (Makwana and Kumar, 2016; Fleming et al., 2007 and Singh, et al., 2010)
B. Dynamic cone penetrometer (DCP)
The Scala penetrometre is a partial destructive testing instrument and also popularly known as the DCP and it was developed in South Africa in 1956 for rapid in-situ assessment of layer's strength in terms of resistance against penetrations (Scala, 1956). Nowadays, the DCP has gained popularity and widely used because of its simplicity of fast install, rapid fabrication, reliable results within 15 minutes and economical, as investigate by Siekmeier et al. (2000), Sawangsuriya et al. (2005) and George et al. (2009). The main purpose of the DCP is to assess a rapid, reliable in-situ CBR and degree of compaction.
The DCP is composed of an eight kg hammer that has arisen and a dropped from the standard height of 575 mm on the anvil. Cone of a 20 mm diameter with 60° vertex angle is tied below the driven steel rod. Steel road is equipped with graduated scale and also it has reduced diameter of 16 mm as compare to cone, it helps in lowering friction between steel road and the cone. Result namely obtained by the DCP is penetration value per blow, where penetration values in millimeter and roughly up to 850 mm penetration value is observed when repeated weight drops on an anvil to penetrate steel rod. Maximum penetration depth up to a two-meter was measured when extension shaft being used.
IV. Site Description
In this work, region of Kutch district of Gujarat state was selected to perform in-situ testing on in- service flexible pavement. The site visit was held out before testing and a finalized 26 km of length stretch. Intact length stretch is passing through a plain terrain, it has sufficient drainage condition and also observed rain cuts at some locations on the embankment beyond the paved shoulder. Stretch is selected based on the severity of distress dominate on the outer wheel path and intact in-service pavement is subjected to the heavy traffic loading.
V. Methodology for Data Collection
In this work, Total 52 test pits of a uniform one-meter by one-meter square size were dug for performing
tests on sub-grade. Test pit locations were selected
uniformly at 500-meter interval on the outer wheel path, which is spread over 26 kilometer of length stretch. Foremost, the LWD test was conducted on sub-grade followed by the DCP test and a core cutter test. The LWD test was conducted in accordance with
ASTM E2583-07 (2011). The LWD readings were
taken on the top of the sub-grade with the 15 kg drop weight, which was allowed to fall from a predefined height of 850 mm. The diameter of the loading plate of 300 mm was taken.
The generated impact force observed in the range of 7.0-9.0 KN. The stress distribution factor was set to two (flexible plate) as assuming the uniform stress was a distributed on material under test, and it was ensured by using layer of five mm thick sand pad of consisting uniformly sand passing 1-mm and retaining 600-micron sieve. The poisson’s ratio is set to 0.4 as suggested in IRC 37-2012 and also recommended by Edwards & Fleming (2009). Sand pad was used to level up the top of the sub-grade surface and to ensure contact of the loading plate with it. The results namely the force, pressure, deflection, pulse duration and the surface modulus evaluated are stored in PDA. Steinert et al. (2006) and Makwana (2016)recommended six drops for each test location; the first three drops are considered as seating drop and the next three drops are averaged and considered for assessing a sub-grade modulus. Seating drops is for proper contact between the circular loading plate and the top of the sub-grade surface under test. The LWDmod is a back calculation program developed by the dynatest, particular for the LWD instrument was used for assessing a sub- grade modulus. In this present work, six drop readings taken at each test pit location and last three drops are used in LWDmod for back-calculation.
The DCP test was conducted in accordance with ASTM D6951/D6951M – 09. The LWD test induces vibration but isn’t affecting the natural condition of sub-grade while the DCP test does.
Therefore, the DCP test was conducted after the LWD test at a same test location for maintaining undisturbed condition of sub-grade. The foremost penetration cone was set to ensure a proper contact between a tip of the cone and top of the sub-grade, then after a test commencement with considering first drop as seating drop, in which eight kg hammer was falling from 575 mm height for accurate measurements. Moreover, up to 300 mm penetration was accomplished and a corresponding number of drops recorded and DPI in mm per blow is calculated. Field dry density is also determined at same test location using the core cutter method for sub-grade as described in IS: 2720- Part 29 (1975).
Samples were gathered from each pit location for laboratory testing to determine CBR, plasticity index
and water content. The 4 day soaked CBR tests at field dry density were conducted accordance with IS: 2720-Part 16 (1979). The standard CBR mould of 150 mm diameter and 125mm height was used. The CBR mould was filled by compacting soil in three equal layers. A steel hammer of 5kg weight was used to compact each layer of soil to the essential thickness. Three tests were conducted on the soil sample obtained from each pit location and the average of the three was considered as the CBR value. Plasticity index and water content were determined as described in IS: 2720-Part 5 (1985) and IS: 2720-Part 2 (1973) respectively.
VI. Result and Discussion
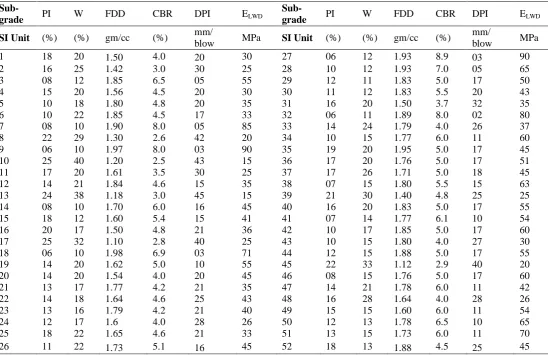
In this section, details of measured results of the in- situ LWD test, DCP test and a core cutter test conducted on in-service flexible pavement and also laboratory determined, CBR, plasticity index and
moisture content are discussed. Total 52 test points, location's wise results of plasticity index (PI), water content (W), field dry density (FDD), CBR, DPI and sub-grade modulus (ELWD) are presented in Table 2.
The SPSS tool was employed for complex regression analysis.
Table 2 location wise in-situ field and laboratory test result of sub-grade layer.
Sub-grade PI W FDD CBR DPI ELWD
Sub-grade PI W FDD CBR DPI ELWD
SI Unit (%) (%) gm/cc (%) mm/
blow MPa SI Unit (%) (%) gm/cc (%)
mm/
blow MPa
1 18 20 1.50 4.0 20 30 27 06 12 1.93 8.9 03 90
2 16 25 1.42 3.0 30 25 28 10 12 1.93 7.0 05 65
3 08 12 1.85 6.5 05 55 29 12 11 1.83 5.0 17 50
4 15 20 1.56 4.5 20 30 30 11 12 1.83 5.5 20 43
5 10 18 1.80 4.8 20 35 31 16 20 1.50 3.7 32 35
6 10 22 1.85 4.5 17 33 32 06 11 1.89 8.0 02 80
7 08 10 1.90 8.0 05 85 33 14 24 1.79 4.0 26 37
8 22 29 1.30 2.6 42 20 34 10 15 1.77 6.0 11 60
9 06 10 1.97 8.0 03 90 35 19 20 1.95 5.0 17 45
10 25 40 1.20 2.5 43 15 36 17 20 1.76 5.0 17 51
11 17 20 1.61 3.5 30 25 37 17 26 1.71 5.0 18 45
12 14 21 1.84 4.6 15 35 38 07 15 1.80 5.5 15 63
13 24 38 1.18 3.0 45 15 39 21 30 1.40 4.8 25 25
14 08 10 1.70 6.0 16 45 40 16 20 1.83 5.0 17 55
15 18 12 1.60 5.4 15 41 41 07 14 1.77 6.1 10 54
16 20 17 1.50 4.8 21 36 42 10 17 1.85 5.0 17 60
17 25 32 1.10 2.8 40 25 43 10 15 1.80 4.0 27 30
18 06 10 1.98 6.9 03 71 44 12 15 1.88 5.0 17 55
19 14 20 1.62 5.0 10 55 45 22 33 1.12 2.9 40 20
20 14 20 1.54 4.0 20 45 46 08 15 1.76 5.0 17 60
21 13 17 1.77 4.2 21 35 47 14 21 1.78 6.0 11 42
22 14 18 1.64 4.6 25 43 48 16 28 1.64 4.0 28 26
23 13 16 1.79 4.2 21 40 49 15 15 1.60 6.0 11 54
24 12 17 1.6 4.0 28 26 50 12 13 1.78 6.5 10 65
25 18 22 1.65 4.6 21 33 51 13 15 1.73 6.0 11 70
A. Development of relation between CBR and DPI
To develop a relation between CBR and DPI, the SPSS tool was used. Various curve fitting methods were analyzed and found power and logarithm models are the best fitted models. The CBR and DCP obtained
DPI are considered as an input variable, where a CBR is dependent and DPI is independent variable. For power model, model equation [19] is developed with the observed coefficients of determination (R2) is 0.876, adjusted R2 is 0.873 and standard error of the estimated is 0.124. The regression equation shows significant values (F= 352.042, p <0.001) and coefficients of the independent variable had a significant standardized regression weight of DPI (Beta= -0.936, t = -18.763, p <0.001). For logarithm models, model equation [20] is developed with an observed coefficient of determination (R2) is 0.784, adjusted (R2) is 0.780 and standard error of the
estimated is 1.034. The regression equation shows significant values (F= 181.869, p <0.001) and coefficients of the independent variable had a significant standardized regression weight of DPI (Beta= -0.866, t = -13.486, p <0.001. Power regression model results showed well significant of the correlation as compared to logarithm model. Therefore, only performance of a power model was analyzed. The CBR value varies in the range from 2.5 (%) to 15 (%) and DPI 4 to 45 mm per blow. Scatter plots of a power and logarithmic regression models of DPI verse's sub-grade modulus is shown in Fig. 2.a.
CBR (%) = 20.268 (DPI) -0.505 or log (CBR) = 1.3068 - 0.505 log (DPI), R² = 0.87
Equation [19] CBR (%) = 13.732 - 3.028 ln (DPI), R² = 0.784
Equation [20]
0 10 20 30 40 50
2 4 6 8 10 12 14 16
0 10 20 30 40 50
2 4 6 8 10 12 14 16 18
2 3 4 5 6 7 8 9 10 11
2 4 6 8 10 12 14 16
C
B
R
(
%)
DPI (mm/blow) Power Fit: CBR= 20.268DPI -0.505, R² = 0.876
Log Fit : CBR= 13.732 - 3.028 log(DPI), R² = 0.784
C
B
R
(
%)
DPI (mm/blow) [19] Power Fit Present Paper [2] Power Fit Garb et al.(2000) [3] Power Fit George et al. (2009)
Ob
ser
v
e
d
C
B
R
(
%)
Predicted CBR (%)
Observed CBR = -0.088 + 1.026 (Predicated CBR) R2
=0.821
Figure 2.a: DPI vs CBR Figure 2.b: DPI vs CBR Figure 3 Predicted vs observed CBR
To check the trustworthiness of the power regression model. Frist, it is compared with various models as shown in Fig. 2. b and then after the mean absolute percent error (MAPE) is used to measure error between various models.
It is observed that an equation [1], [2] and [3] follow a same trend line path with MAPE of 176.463 %, 9.372% and 15.231% respectively, herein observed high value of error and it is due to model
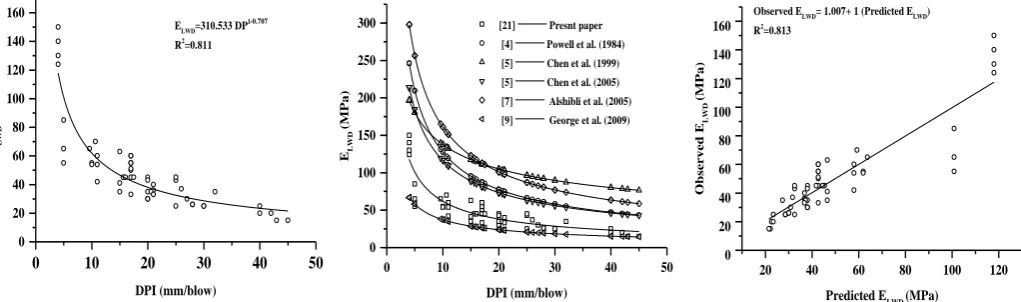
B. Development of relation between sub-grade modulus and DPI
To correlate the sub-grade modulus and DPI, again the SPSS tool is used and it has been found out that the power regression model is the best fitted model. The LWD obtained sub-grade modulus and DCP obtained DPI are considered as an input variable, where a modulus is dependent and DPI is independent variable. For power model, model equation [21] is developed with observed coefficient of determination (R2) is 0.811, adjusted R2 is 0.807 and standard error of the estimated is 0.222. The regression equation shows significant values (F= 214.487, p <0.001) and coefficients of the independent variable had a significant standardized regression weight of DPI in mm per blow (Beta= -0.901, t = -14.645, p <0.001). The DPI value varies in the range from 4 to 45 mm per
blow and sub grade modulus 15 MPa to 150 MPa. A scatter plot of a power regression model of DPI verses sub-grade modulus is shown in Fig. 4.a
ELWD (MPa)=310.533 (DPI)-0.707, R2=0.811
Equation [21]
Again, it is compared with various models as shown in Fig. 4.b to check its performance. Equation [4], [5], [6], [7], [8], and [9] follow a same trend line path with MAPE of 108.278%, 168.533%, 95.023%, 168.934%, 217.579% and 36.823% respectively. The least value of error was observed in equation [9] because its uses PFWD, while another has higher error values due to a usage of the different deflectometer instrument, but follows a same trend line. It’s the validate present paper result of Equation [21].
0 10 20 30 40 50
0 50 100 150 200 250 300
20 40 60 80 100 120
0 20 40 60 80 100 120 140 160
0 10 20 30 40 50
0 20 40 60 80 100 120 140 160
EL
WD
(M
Pa)
DPI (mm/blow)
[21] Presnt paper [4] Powell et al. (1984)
[5] Chen et al. (1999) [5] Chen et al. (2005) [7] Alshibli et al. (2005) [9] George et al. (2009)
Ob
se
r
ve
d
E
L
WD
(M
Pa)
Predicted ELWD (MPa)
Observed ELWD= 1.007+ 1 (Predicted ELWD) R2
=0.813
EL
WD
(M
Pa)
DPI (mm/blow)
ELWD=310.533 DP I-0.707
R2
=0.811
Figure 4.a: DPI vs ELWD Figure 4.b: DPI vs ELWD Figure 5 Predicted vs observed ELWD
The scatter plot and best-fit curve connecting observed ELWD values and predicted ELWD values are shown in
Fig.5 herein, observed coefficient of determination (R2) is 0.813, adjusted R2 is 0.809 and standard error of the estimated is 12.855. The regression equation shows significant values (F= 216.695, p <0.001).
C. Development of relation between sub-grade modulus and CBR
Various curve-fit regression models were tested on the SPSS tool and again found a power regression model is best fitted. The LWD obtained sub-grade modulus and CBR are considered as input variables, where the modulus is dependent and CBR is independent variable. For power model, model equation [22] is developed with an observed coefficient of determination (R2) is 0.859, adjusted R2 is 0.856 and standard error of the estimated is 0.192. The regression equation shows significant values (F= 303.460, p <0.001) and coefficients of the dependent variable had
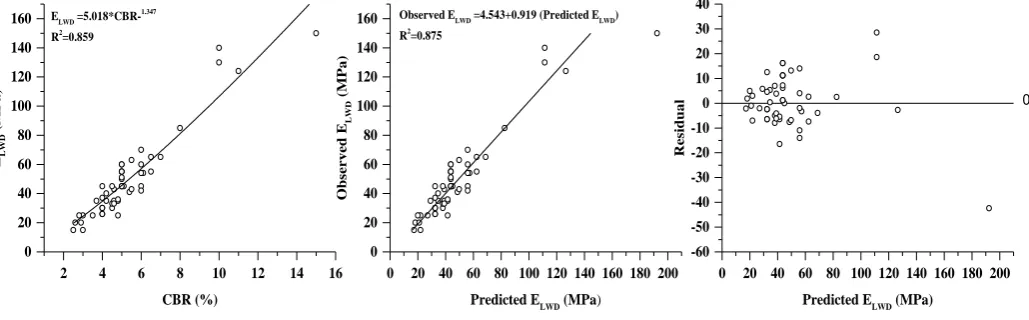
significant standardized regression weights of CBR (%) (Beta=0.927, t= 17.420, p <0.001). The CBR value varies in range, from 2.5% to 15% and sub-grade modulus 15 MPa to 150 MPa. A scatter plot of a power regression model of CBR verses sub- grade modulus is shown in Fig.6.
ELWD (MPa)=5.018 (CBR)-1.347, R2=0.811
Equation [22]
For Equation [23], the scatter plot and best-fit curve connecting observed ELWD values and predicted
ELWD values are shown in Fig.7 herein, observed
2 4 6 8 10 12 14 16 0
20 40 60 80 100 120 140 160
EL
WD
(M
P
a)
CBR (%)
ELWD =5.018*CBR-1.347
R2
=0.859
0 20 40 60 80 100 120 140 160
0 20 40 60 80 100 120 140 160 180 200
Predicted ELWD (MPa)
O
b
se
r
ve
d
E
L
WD
(M
P
a)
Observed ELWD =4.543+0.919 (Predicted ELWD)
R2
=0.875
0 20 40 60 80 100 120 140 160 180 200
-60 -50 -40 -30 -20 -10 0 10 20 30 40
R
e
si
d
u
al
Predicted ELWD (MPa)
0
Figure 6. CBR vs ELWD Figure 7. Predicted vs observed ELWD Figure 8. Predicted ELWD vs residual
D. Effect of Geotechnical factors on sub-grade modulus and CBR
In addition to above model Equation [19], [21] and [22]. The linear regression method was tested on SPSS tool to develop a relation of sub-grade modulus and CBR with plasticity index (PI), water content (W) and field dry density (FDD) to asses an effect of geotechnical parameters. Equation [23] and [24] are developed.
ELWD (MPa) = 54.999 – 2.054 (PI) – 0.939 (W)
+23.914 (FDD), R2=0.513
Equation [23] CBR (%) = 5.769 – 0.137 (PI) – 0.083 (W) + 1.747
(FDD), R2=0.506
Equation [24]
In Equation [23], observed coefficient of determination (R2) is 0.513 and standard error of the estimated is 21.140 The regression equation is a significant (F=16.872, p <0.001). In Equation [24], observed coefficient of determination (R2) is 0.506 and standard error of the estimated is 1.598 The regression equation is a significant (F=16.872, p <0.001). Furthermore, results show a negative value of regression coefficient for PI and water content and positive value for FDD. PI value is varied in range, from 6 % to 25 %, water content (W) is varies from 8% to 40 % and for FDD, it ranges from 1.1 gm/cc to 2 gm/cc.
VII. Conclusion
This study is carried out for developing reliable correlation model equations of CBR with DCP, sub-grade modulus with DCP and CBR, and sub-sub-grade modulus and CBR with geotechnical parameters such as PI, water content and FDD for Kutch region of Gujrat state for essential and economical
pavement design and also to benefit pavement engineers.
Following conclusions have been derived from this study:
Two equations are developed for connecting CBR with DCP obtained DPI; power model shows strong correlation of R2 of 0.876 for Equation [19] as compared to logarithm model. It’s followed a same trend line path with various earlier developed models and observed 9.372% and 15.231% MAPE for Equation [2] and [3] respectively. Furthermore, results show a strong correlation between predicted CBR and observed CBR with R2 in 0.821, which validate results. Herein, the CBR value varies in the range from 2.5 (%) to 15 (%) and DPI 4 to 45 mm per blow.
The LWD obtained sub-grade modulus and the DCP obtained DPI is strongly linked by power model with an R2 of 0811. It’s also followed a same trend line path with various earlier developed models and observed least MAPE of 36.823% for Equation [9]. Moreover, results show a strong correlation between predicted ELWD and observed ELWD with R2 of 0.813,
which validate results. Here, the DPI value varies in the range from 4 to 45 mm per blow and sub-grade modulus 15 MPa to 150 MPa.
Relation is developed between sub-grade modulus and soaked CBR; the power regression model is best fitted with an R2 of 0.859 for equation [22]. The observed strong correlation between predicted ELWD and observed ELWD
Linear regression models are developed for connecting sub-grade modulus and CBR with plasticity index (PI), water content (W) and field dry density (FDD) to measure an effect of geotechnical parameter and observed R2=0.513 for equation [23] and R2=0.506 for equation [24]. Results show a negative value of regression coefficient for PI and water content and positive value for FDD. PI value is varied in range, from 6 % to 25 %, water content (W) is varies from 8% to 40 % and for FDD, it ranges from 1.1 gm/cc to 2 gm/cc.
References
[1] Ahmad Kamil, A. (2007) Flexible pavement design: Transitioning from empirical to mechanistic-based design methods. Cover Story, JURUTERA, July
[2] Alshibli, K. A., Abu-Farsakh, M., & Seyman, E. (2005). Laboratory evaluation of the geogauge and light falling weight deflectometer as construction control tools. Journal of materials in civil engineering, 17(5), 560-569.
[3] Alshibli, K., Nazzal, M., & Seyman, E. (2004). Assessment of in-situ test technology for construction control of base courses and embankments (No. FHWA/LA. 04/389,). Baton Rouge, LA, USA: Louisiana Transportation Research Center.
[4] American Association of State Highway and Transportation Officials (AASHTO) Guide for Design of Pavement Structures (1993)
[5] American Society for Testing and Materials (ASTM), ASTM D6951/D6951M – 09 Standard Test Method for Use of the Dynamic Cone Penetrometer in Shallow Pavement Applications.
[6] American Society for Testing and Materials (ASTM), ASTM E2583-07 Standard Test Method for Measuring Deflections with a Light Weight Deflectometer (LWD). [7] Chen, D. H., Lin, D. F., Liau, P. H., & Bilyeu, J. (2005). A
correlation between dynamic cone penetrometer values and pavement layer moduli. Geotechnical Testing Journal, 28(1), 42-49.
[8] Chen, D. H., Wang, J. N., & Bilyeu, J. (2001). Application of dynamic cone penetrometer in evaluation of base and subgrade layers. Transportation Research Record: Journal of the Transportation Research Board, (1764), 1-10.
[9] Chen, J., Hossain, M., & Latorella, T. (1999). Use of falling weight deflectometer and dynamic cone penetrometer in pavement evaluation. Transportation Research Record: Journal of the Transportation Research Board, (1655), 145-151.
[10] Christ van Gurp, Roel Cillessen, Sjoerd Blom, (2010). The use of LWD on granular bases and asphalt structures, 6th European FWD Users Group Meeting - 10-11 June. [11] Chua, K. M., & Lytton, R. L. (1981). Dynamic analysis
using the portable dynamic cone penetrometer. Transportation Research Record, 1192, 702-708
[12] Egorov, K. E. (1965, September). Calculation of bed for foundation with ring footing. In Proceedings of the sixth international conference on soil mechanics and foundation engineering (Vol. 2, pp. 41-45).
[13] Erlingsson, S. (2007). On forecasting the resilient modulus from the CBR value of granular bases. Road Materials and Pavement Design, 8(4), 783-797.
[14] Fleming, P.R., Frost, M.W., & Lambert, J.P. (2007). Review of lightweight deflectometer for routine in situ assessment of pavement material stiffness. Transportation research record: journal of the Transportation Research Board, 2004(1), 80-87.
[15] Gabr, M. A., Hopkins, K., Coonse, J., & Hearne, T. (2000). DCP criteria for performance evaluation of pavement
layers. Journal of performance of constructed facilities, 14(4), 141-148.
[16] George, V., Rao, N. C., & Shivashankar, R. (2009). PFWD, DCP and CBR correlations for evaluation of lateritic subgrades. International Journal of Pavement Engineering, 10(3), 189-199.
[17] Heukelom, W., & Foster, C. R. (1960). Dynamics Testing of Pavements. Journal of the soil Mechanics and Foundations division, 86(1), 1-28.
[18] Indian Road Congress (IRC), IRC: 37-2012 Guidelines for the Design of Flexible Pavements (Third Revision). [19] Indian Standard 2720 Part- 2 (1973 Methods of Test for
Soils Part II Determination of Water Content (Second Revision)
[20] Indian Standard 2720 Part- 29 (1975) Determination of Dry Density of Soils in Place by The Core-Cutter Method [21] Indian Standard 2720: Part 16 (1987) “Methods of Test for
Soil Part 16 Laboratory Determination of CBR” (Second Revision)
[22] Indian Standard 2720: Part 5 (1985) “Method of Test for Soils Part 5 Determination of Liquid and Plastic limit (Second Revision)
[23] Kavussi, A., Rafiei, K., & Yasrobi, S. (2010). Evaluation of PFWD as potential quality control tool of pavement layers. Journal of Civil Engineering and Management, 16(1), 123-129
[24] Konrad, J. M., & Lachance, D. (2001). Use of in situ penetration tests in pavement evaluation. Canadian geotechnical journal, 38(5), 924-935.
[25] Lin, D. F., Liau, C. C., & Lin, J. D. (2006). Factors affecting portable falling weight deflectometer measurements. Journal of geotechnical and geo-environmental engineering, 132(6), 804-808.
[26] Makwana P. (2016), Structural evaluation and quality assurance of flexible pavement using Light Weight Deflectometer, International Journal of Civil and Structural Engineering, 6(3), pp 160-167
[27] Makwana P. and Kumar R. (2016), LWD Induced Flexible Pavement Rehabilitation Strategies, Lambert Academic Publishing (LAP), ISBN: 978-3-659-67306-1
[28] NCHRP. (2004). “Guide for Mechanisitc-Empirical Design of New and Rehabilitated Pavement Structures,” Final Report for Project 1-37A, Part 1 & Part 3, Chap. 4, National Cooperative Highway Research Program, Transportation Research Board, National Research Council, Washington, D.C.
[29] P Edwards& P Fleming (2009) LWD Good Practice Guide. [30] Pen, C. K. (1990). An assessment of the available methods
of analysis for estimating the elastic moduli of road pavements. Third international conference on bearing capacity of roads and airfields. Proceedings, Norwegian institute of technology, Trondheim, Norway, july 3-5 1990. Volumes 1-2. Publication of: tapir publishers.
[31] Powell, W. D., Potter, J. F., Mayhew, H. C., & Nunn, M. E. (1984). The structural design of bituminous roads (No. LR 1132 Monograph).
[32] Rao, C. N., George, V., & Shivashankar, R. (2008, October). PFWD, CBR and DCP evaluation of lateritic subgrades of Dakshina Kannada, India. In The 12th International Conference of International Association for Computer Methods and Advances in Geomechanics. Goa: Indian Institute of Technology.
[33] Rathje, E. M., Wright, S. G., Stokoe, K. H., Adams, A., Tobin, R., & Salem, M. (2006). Evaluation of non-nuclear methods for compaction control.
[34] Sawangsuriya, A., & Edil, T. B. (2005). Evaluating stiffness and strength of pavement materials. Proceedings of the ICE-Geotechnical Engineering, 158(4), 217-230.
[35] Scala, A. J. (1956). Simple methods of flexible pavement design using cone penetrometers. New Zealand Engineering, 11(2), 34.
[37] Siekmeier, J. A., Young, D., & Beberg, D. (2000). Comparison of the dynamic cone penetrometer with other tests during subgrade and granular base characterization in Minnesota. ASTM Special Technical Publication, 1375, 175-188.
[38] Singh, N. K., Eng, P., Mejia, C., Martison, T., & Shah, F. (2010) Use of the Light Weight Deflectometer (LWD) at Highland Valley Copper Mine. GEO2010, Calgary, Alberta, in the New West.
[39] Steinert, B. C., Humphrey, D. N., & Kestler, M. A. (2006, January). Portable falling weight deflectometers for tracking seasonal stiffness variations in asphalt surfaced roads. In 85th Transportation Research Board meeting, National Research Council, CD-ROM, Washington DC, USA. [40] Sulewska, M. J. (2004). The Application of the Modern
Method of Embankment Compaction Control. Journal of Civil Engineering and Management, 10, 45-50.
[41] Tehrani, F. S., Meehan, C. L., & Vahedifard, F. Comparison of Density-Based and Modulus-Based in Situ Tests for Earthwork Quality Control. In Geo-Congress 2014 Technical Papers@ Geo-characterization and Modeling for Sustainability (pp. 2345-2354). ASCE.
[42] Tripathi B., Makwana P., Kumar R, (2016), Study of Nuclear Density Gauge for Compaction Measure, Lambert Academic Publishing (LAP), ISBN: 978-3-659-76344-1 [43] Webster, S. L., Grau, R. H., & Williams, T. P.
(1992). Description and application of dual mass dynamic cone penetrometer (No. WES/IR/GL-92-3). Army Engineer Waterways Experiment Station Vicksburg Ms Geotechnical Lab.