Journal of
Applied Research on Industrial Engineering
Journal of Applied Research on Industrial Engineering
Vol. 2, No. 2 (2015) 86-96
Studying the Role of Cost of Quality Information in Improvement
Somayeh Maleki
1*1, Farzad Movahedi Sobhani
21 Department of Industrial Management,Science and Research Branch, Islamic Azad University, Tehran, Iran 2 Department of Industrial Engineering, Science and Research Branch, Islamic Azad University, Tehran, Iran
A B S T R A C T A R T I C L E I N F O
The objective of this study is to investigate the relationship between the ability to apply quality cost information and planning and implementing quality improvement activities. The factors leading to increase in application capacity of quality cost information in organizations are also explored in this study. The research model explains how the application capacity of quality cost information affects the planning and implementation of quality improvement activities. The research model and assumptions are examined through “structural equation model” testing approach. The findings of this research show that there is a positive and direct relationship between the application capacity of quality cost information and planning and implementation of quality improvements activities. The data used in the present study were gathered from 102 Iranian companies manufacturing automotive spare parts. Due to the volume of samples, there are limitations in generalizing the study results. This study, through identifying the factors influencing the increase in ability of an organization to apply quality cost information, offers a framework for investment and improvement of these factors with the aim of using quality cost information.
Article history :
Received: 20 April 2015 Received in revised format: 25 May 2015
Accepted: 15 June 2015 Available online: 10 September 2015 Keywords : Quality cost information, Quality improvement, Structural equation model
1.
Introduction
The issue of cost of quality has gradually become paradoxical. On the one hand, management of quality improvement programs disregarding the program costs makes their efficiency questionable; on the other hand, the real effects of quality cost programs on improvement and success of an
87
organization aren’t clearly measurable. The vagueness even increases by referring to experiences of implementing quality cost programs. There are several examples of successful implementation of quality cost programs which have led to success of the relevant organization (Superville and Gupta ,2001). At the same time, there are many criticisms indicating the failure of quality cost programs of companies in reaching the high level of improvement (Chase, 1998;Schaffer and Thomson,1992; Sower and Quarles , 2007). There is no doubt that the quality cost programs of companies with a higher level of process maturity – e. g. in fourth or fifth level of CMMI model – like famous global companies whose names are included in Fortune 500, serve to quality enhancement. Due to high level of organizational learning capability and consequently high capacity of change in these companies, the quality cost programs there have more chances for implementation and integration with other change plans. However, there are less expectations of effectiveness of quality cost programs in companies with a lower level of maturity in CMMI model.
A wide range of applications is imaginable for quality cost programs in an organization. A quality cost program can reflect the efficiency of quality activities by providing a feedback of the results of quality procedures, present a clearer image of the current organization processes, and can, as a motivational factor, stimulate the interest of employees in quality improvement and may have many other applications like these. Therefore, quality cost information contains valuable information about the current function of quality processes in an organization. If an organization possesses the complementary infrastructures for improvement (such as knowledge management mechanisms, organizational learning, change management, total quality management, EFQM excellence model, six sigma and so forth), quality cost information will be heard and understood by the quality system of the organization and will be used in decision-makings processes. In organizations failed to invest before in improvement complementary infrastructures, however, the quality cost information may be used less, if at all.
In this circumstance arises the very question whether it is possible to increase the usage of quality cost information in organizations of lower level of maturity according to CMMI model by stimulating some organizational factors. In other words, by investing in which propellants of the capacity to use quality cost information, we can use this information more efficiently.
To answer this question, one is facing challenges which are mainly the source of the paradox regarding the quality cost. Primarily, the validity of the factors affecting the capacity to use quality cost information is directly resulted from their effect on the success of organization. It is, however, not easy to investigate the direct effects of quality costs on the success of an organization as improvement itself is a lagged variable and several other factors influence it. As Sower et al. (2007) expressed, quality cost plays the role of a translator in the quality system. This implies the mutual effect of quality cost and decision-making processes and quality improvement mechanisms in an organization on each other. In this system, quality cost has only the role of providing feedback data. It is obvious that data with a lower quality cause weaker improvement, but the existence of more powerful data won’t necessarily lead to improvement. It is essential that organizations are equipped with efficient decision-making processes and effective quality improvement mechanisms. It is tried accordingly in this paper to devise the evaluation model in a manner that the propellants of the organization’s capacity to use the quality cost information and the way of their using in quality planning and implementation of improvement projects can be investigated. This strategy will make it possible to investigate the factors affecting the capacity of using quality cost information independent of capacity and readiness of an organization for change and learning.
88
quality. The companies use, however, this cost information by varying degrees in their decision-making regarding quality processes. Further, this paper reviews the scientific literature about cost information. The research methodology is explained in the third section. Statistical analyses are presented in the fourth section. And finally, the fifth section of the paper is dedicated to the discussion of the aforementioned analyses and a summary.
2.
Review of relevant literature
2.1.
Cost of quality
The concept of COQ(cost of quality) was first mentioned by Juran (1951) as the ‘cost of poor quality’ (Mohandas and Sankaranarayanan ,2008). But Juran’s (1951) concept remained a theory until one of the earliest articles on quality costs systems written by Feigenbaum (1961) came about( Low and Yeo,1998). Feigenbaum (1961) categorized operating quality costs into two major components: cost of control and cost of failure of control. The former includes appraisal and prevention costs, whereas the latter includes internal as well as external failure costs (Weheba and Elshennawy, 2004). Another person that has furthered the quality cost concept is Philip Crosby (Harrington,1999). The credit of the popularity of COQ concept goes to Philip B Crosby(1979) who emphasized COQ in his book “Quality is Free” (Ali et al ,2012).Over the years, the quality cost concept has been expanded to the point that today it provides an excellent management tool that can be used to direct quality improvement activities(Harrington,1999).
The definition and categories of quality costs may be given differently by various authors. They use the terms “quality costs”, “costs of quality”, “economics of quality”, “poor quality cost”, “price of non-conformance” or “cost of poor quality” (Kiani et al , 2009).According to Dale and Plunkett (1995), it is now widely accepted that quality costs are: the costs incurred in the design, implementation, operation and maintenance of a quality management system, the cost of resources committed to continuous improvement, the costs of system, product and service failures, and all other necessary costs and non-value added activities required to achieve a quality product or service (Schiffauerova and Thomson , 2006).According to Juran (1998) quality cost are categorized in four groups, as follow:
Internal failure cost includes sub-standard products detected within the company prior to delivery to customers, scrap, re-work, and spoilage.
1. External failure encompasses rejected goods, recall cost, warranty claims, concessions and
customer complaints.
2. Appraisal costs as the costs of evaluating product quality with the purpose of ensuring that
quality products and services meet customer requirements; and
3. Prevention costs as the expenses of preventing defects and non-conformities from occurring.
2.2.
COQ as a quality improvement tool
89
Measurements of quality related costs also reveal shortcomings in cost allocation, standards, procedures and practices which may remain undetected by the more commonly used production / operation and labor based analysis (Chopra and Garg , 2011).
Committing large amounts of money to improvement initiatives without some measure of cost effectiveness is often considered to be nothing more than a blind act of faith (Bamford and Land, 2006). Monitoring and controlling quality costs are becoming critical activities of quality improvement programs (Rodchua, 2006).Cost of quality analysis links improvement actions with associated costs and customer expectations, and this is seen as the coupling of reduced costs and increased benefits for quality improvement (Schiffauerova and Thomson , 2006). Establishing the cost of quality system capitalizes on continuous quality improvement techniques, proactive managerial actions, to achieve product efficiency, customer satisfaction, and strategic effectiveness (Zimwara, 2013)
Previous studies show that the majority of companies implement their COQ programs in accordance with the universally accepted Feigenbaum’s (1956) costing structure(Schiffauerova and Thomson , 2006). Among these organizations are:IBM, Bendix, Komatsu Ltd, Abbott Laboratories, Westinghouse, Honeywell, General Electric, International Telephone & Telegraph, Irving Trust,
Eaton, Digital Equipment, Allis-Chalmers Canada, General Motors, and many
more(Harrington,1999).Large organizations are spending millions of dollar every year on implementing and sustaining quality programs .it is not uncommon for a Fortune 500 firm to spend as much as 10-30 percent of sales revenues on quality cost but the benefits , in terms of increased productivity and cost saving , can be substantial .Corporations like Xerox, General Electric and Motorola have implemented successful quality programs and have reduced their quality cost from 30 percent of sales to 2 percent of sales with improving the quality of their products(Superville and Gupta ,2001).
2.3.
Cost of Quality ineffectiveness
Despite an increased awareness of importance of quality, the importance of quality cost and benefits not recognized by industrial managers and worse, it is misunderstood (Bajpei and Willey, 1994).Several companies have implemented and executed Total Quality programs, but failed, when they could not achieve their goals due to lack of effective quality costs methods (Rodchua, 2006). . Also some quality-cost collection and analysis efforts fail. That is, a number of companies have started quality-cost analysis activities, used them for some time, and then abandoned the programs as ineffective (Montgomery, 1996). Many companies that have quality cost systems in place may find that they are not living up to expectations (Chase, 1998;Schaffer and Thomson,1992; Sower and Quarles , 2007).
The quality cost system does not improve quality by themselves (Sower and Quarles, 2007).Knowing the importance of quality costs is not enough. For such data to be useful, they need to be collected (Low and Yeo, 1998).In this sense, companies need to implement a strategy to track cost of quality and measure quality performance(Al-Tmeemy et al,2012) .The process of implementing a quality cost system is not always easy. Many quality experts have already realized this and have written about the installation process of the quality cost system(Low and Yeo, 1998).Quality professionals are still trying to determine the main factors and measures aiding in the successful quality cost programs and what problems can be incurred in the quality cost program implementation (Rodchua, 2006).
90
Several authors documented the barriers and difficulties in quality cost system implementation (Al-Tmeemy et al,2012).More than a few causes of failing to follow the quality costs were identified in the survey conducted by Sower and Quarels (2003). The most important reason are: lack of management support or absence of management interest in tracking such costs, company economic conditions or status, lack of knowledge, lack of adequate accounting and computer systems.
Bamford (2006) indicates two other limiting factors in addition to support and commitment of managers and accounting system, as follows: the availability of required information and necessary expertise and resources to gather and analyze such information completely. Lack of an appropriate system for collecting data,lack of support from the senior leadership team, lack of cooperation from other department and inadequate information to properly design and process are some factors which (Rodchau,2006) has found them .
Cheah et al. (2010) experienced similar barriers in case studies. These barriers include: top management commitment, inadequate accounting system, lack of understanding of the concept of quality cost and the resistance from staff.
By the way, Loduca (2011) recognizes the way of thinking of managers and employees regarding to cost of quality and knowledge of quality, as the main reason of not following the concept of quality costs. The barriers mentioned by Al-tmeemty et al. (2012) include: lack of knowledge, lack of cooperation, system, lack of management interest and lack of resource.Their study suggests that the level of the site staff's knowledge should be as important as that of the management to successfully collect and record quality costs data.
Training is the one solution to some of these difficulties(Eldridge et al, 2006; Zimwara et al ,2013). Accepting some changes in the organization is often inevitable to create a successful system for finding the costs. These changes include: organizational structure-related changes, technical changes and informational changes (Czuchry et al,1999).
Table 1. Barriers to cost of quality system implementation
Authors Factors Main purpose of the paper
Sower and Quareles (2003)
Management interest / support, company economic conditions, Knowledge , Accounting and
computer system
To determine why some organizations do not utilize COQ
system
Rodchua (2006)
Management support and commitment, Effective application and system , cooperation from other
department, Understanding the concept of COQ
To identify the problems of quality cost program implementation
Bamford and land (2006)
Management commitment, Accounting system, Information ,
Resources
to describe an investigation into collection and measurement of cost
of quality
Chean , Shahbudin and Taib (2010)
Management interest, Understanding the concept of COQ, Accounting
system
to present a report on the implementation of a COQ program
in a continuous-process manufacturing company, with emphasis on the unearthing of hidden
quality costs
Loduca (2011) People, Quality awareness
To identify barriers to use of Fingenbaum’s quality cost strategy
within design engineering firms
91
Rahman and Harun(2011)
System , culture and Knowledge system implementation
2.5.
Conceptual model
It should be remembered that quality systems not COQ systems create improvement( Sower and Quarels,2003).COQ programs input and feedback to quality systems which are responsible for quality improvements(Sower and Quarels,2007).
Using the quality cost information , managers make more radical decisions(Bamford and land,2006).The effectiveness of that program is inextricably linked to how well the quality management system uses the COQ information in improving quality(Sower and Quarels,2007).
So:
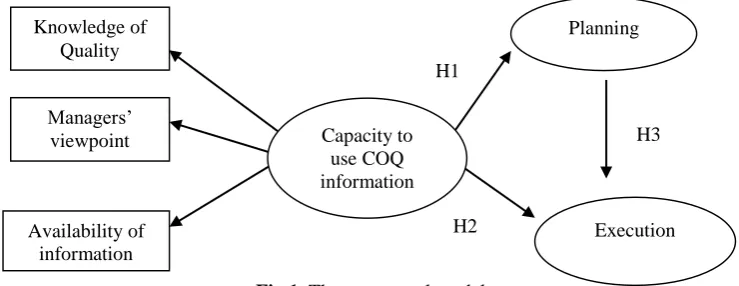
H1: The capacity to use quality cost information has a direct and positive effect on planning.
Montgomery (1996) believes that the most important reason for ineffectiveness of cost of quality program is failure to use quality-cost information as a mechanism for generating improvement opportunities. In that light,
so:
H2: The capacity to use quality cost information has a direct and positive effect on execution. And from the model:
H3: There is a direct relationship between planning and implementation of improvement activities. Figure 1 details about how application capacity of quality cost information affects improvement.
Fig 1. The conceptual model
3.
Research Methodology
3.1.
Data collection and sample characteristics
The survey structural questionnaires with cover letters were used to collect data through an email survey in Iran. Each variable was assessed using a five point Likert scale, ranging from ‘‘1 = very poor’’ to ‘‘5 = very good’’. Two hundred and eighty potential respondents were randomly selected. The sample consist of quality managers of companies in automobile industry which have ISOTS certification. Because of ISOTS requirements these companies should calculate and report their costs of quality. After six weeks, one hundred and two replies were received, which constituted a response rate of 36.4%.
A thorough literature review guided the first design of the questionnaire. A pre-test carried out through several personal interviews with quality managers and advisers also helped to clarify the survey items and validate the questionnaire.
Capacity to use COQ information
Execution Managers’
viewpoint
Availability of information Knowledge of
Quality
Planning
H1
H2
92
3.2.
Measures description
In conceptual model, each unobserved (latent) variable comprises a number of constructs. The measurement of the analysis variables has been built on a multiple-items method.
Capacity to use COQ information - Capacity to use COQ information has a multidimensional construct which is measured by three variables of knowledge of quality, managers’ viewpoint and availability of information.
Knowledge of quality – One of the most important success factors of quality cost programs is the knowledge of quality. Knowledge of quality in organizational level can be evaluated through the following variables: the degree of managers’ understanding of and acquaintance with quality issues in an organization(Al-Tmeemy et al,2012; Loduca,2011); employees’ understanding of and acquaintance with quality and the costs associated with it(Al-Tmeemy et al,2012; Cheah et al,2010; Loduca,2011); understanding of quality cost concepts by managers(Cheah et al,2010; Rodchua,2006; Sower and Quarels,2003); knowledge and skills of the individuals in charge of collecting quality cost information (Bamford and land,2006);and teaching quality issues(Eldridge et al, 2006; Sower and Quarels,2003; Zimwara et al ,2013) .
Managers’ viewpoint – The interest and commitment of managers regarding the quality cost programs count as important success factors for these programs.
It is possible to produce a report that accurately captures relevant costs without this commitment, but there will be no impetus for people to react to it(Bamford and land,2006).Managers’ viewpoint is measured by the following four factors. As tracking the costs of quality in short-term is misleading (Morse et al, 1987), managers’ tendency to long-term planning is one of the dimensions affecting the viewpoint of managers towards the costs of quality. Paying attention to receiving both a feedback and a financial evaluation of the projects constitutes two other variables for evaluating the managers’ viewpoint. Roduca (2006) believes that quality cost information is rarely exchanged in organizational level. This indicates the failure to use this information in managers’ decision makings.
Availability of information – Lack of information and data is one of the primary reasons for not tracking COQ(Bamford and land,2006).Previous studies observed that establishing a quality cost system is not an easy and clear-cut task because of complex relationships between various cost segments(Sharma et al, 2007). The inability of the accounting system is also one of the important hurdles on the way of successful implementation of programs for finding the costs of quality. This variable is evaluated by the factors of ability to reflect COQ (internal and external), ability to reflect the latent costs, ability to transfer the changes made in the COQ information, the precision of information and the ability of accounting system.
Planning – Planning for improvement is measured by three variables: identifying the necessary points for improvement, evaluating the performance of organization using COQ in order to identify the strengths and weaknesses of organization, and alignment of the goals of the COQ programs with the strategy of organization (Gupta and Campbell ,1995).
Execution– Implementation of improvement activities is measured by the following variables:
implementing modifications and eliminating deviations with the help of COQ, financial support of improvement projects and COQ programs, and existence of the necessary executive procedures aiming to ensure and make commitment to the realization of planned goals.
93
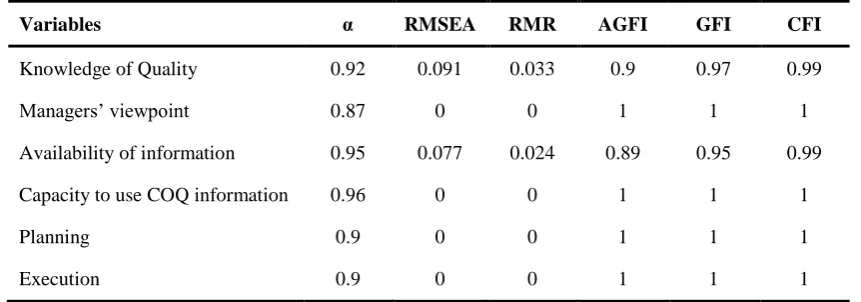
All proposed latent variables and structural paths are illustrated in figure 1. Before testing the model, a series of test was performed to assess the unidimensionality of the measures. A reliability and validity test was applied to examine predetermined constructs. Cronbach’s α was used to assess the internal consistency of the constructs. The test of the conceptual model was carried out using the LISREL analysis. As noted by (Sharma,1996) Lisrel is a general – purpose program for estimating a variety of covariance structure model, with confirmatory factor analysis( CFA) being one of them. Following the details of the process described by ( Anderson and Gerbing, 1988; Hair et al,2010) ,the measurement model and structural model were checked to ensure the results were acceptable and were consistent with the underlying theory. The measurement model specifies the indicator or each construct and enables an assessment of construct validity while structural model set of one or more dependence relationship linking the hypothesized model ‘s construct(Hair et al,2010) . So SEM technique is therefore suited for our research purposes. Table 2 also shows the summary results of the measurement model.
It is observed from this table that almost all of our research constructs are with Cronbach’s α larger than 0.87, which reveal high reliability of our measurements. All the fit of the models was good, with RMSEA,GFI, AGFI, RMR and CFI all within recommended values( Anderson and Gerbing, 1988; Hair et al,2010) .
Table 2. Results of reliability and validity for the measures
Variables α RMSEA RMR AGFI GFI CFI
Knowledge of Quality 0.92 0.091 0.033 0.9 0.97 0.99
Managers’ viewpoint 0.87 0 0 1 1 1
Availability of information 0.95 0.077 0.024 0.89 0.95 0.99
Capacity to use COQ information 0.96 0 0 1 1 1
Planning 0.9 0 0 1 1 1
Execution 0.9 0 0 1 1 1
5.
Results
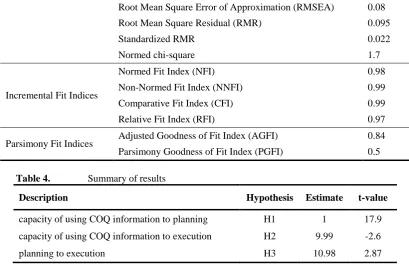
This section presents the results of hypotheses tests. Table 3 includes selected fit statistics from the Lisrel output. The overall mode χ² is 41.1 with 24 degree of freedom. Next we look at several other indices. Our rule of thumb suggests that we rely at least one absolute fit index and one incremental fit index, in addition to χ² result (Hair et al,2010) .The value of RMSEA , an absolute fit index , is 0.084 . The standardized root mean square residual, SRMR, with a value of 0.022 is good. The third absolute fit statistic is the normed χ², which is 1.7.This measure is the chi-square value divided by the degrees of freedom (41.1/24=1.7). A number smaller than 2 is considered very good. Thus the RMSE, SRMR and normed χ² suggest an acceptable fit for our model. Moving to the incremental fit indices, CFI is the most widely used index. In our model CFI has a value of 0.99, which reflect good model fit.
Therefore the results support the structural equation model for our data. Table 4 shows the results of hypothesis testing of the structural relationships among latent variables.
Table 3. Goodness- of –fit statistics
Group of Indexes Name of index value
Chi-square(χ²) Chi-square 41.1
Degrees of Freedom 24
94
Root Mean Square Error of Approximation (RMSEA) 0.08Root Mean Square Residual (RMR) 0.095
Standardized RMR 0.022
Normed chi-square 1.7
Incremental Fit Indices
Normed Fit Index (NFI) 0.98
Non-Normed Fit Index (NNFI) 0.99 Comparative Fit Index (CFI) 0.99 Relative Fit Index (RFI) 0.97
Parsimony Fit Indices Adjusted Goodness of Fit Index (AGFI) 0.84 Parsimony Goodness of Fit Index (PGFI) 0.5
Table 4. Summary of results
Description Hypothesis Estimate t-value
capacity of using COQ information to planning H1 1 17.9 capacity of using COQ information to execution H2 9.99 -2.6
planning to execution H3 10.98 2.87
According to table 4 and considering the t-values, all hypotheses are accepted. As can be seen, the capacity of using COQ information affects improvement planning with a t-value of 17.9 and an estimate of 1. The capacity of using COQ information also affects the implementation of improvement activities with a t-value of -2.6 and an estimate of 9.99. Thus due to the existence of an effective and positive relationship between planning and implementation, one can infer the double impact of the capacity of using COQ information on the implementation phase of quality improvement programs.
6.
Discussion
According to Sower’s model (2007) , quality cost system plays the role of information translator in decision-making system and the role of feedback in quality system of an organization. The effectiveness of information in both of the above-mentioned systems depends on the capacity of organizations to implement the change process (unfreezing, change, refreezing); but many organizations attempt unwittingly or coercively to calculate the quality cost regardless of their capacity for change. Our preliminary studies show that some companies of a lower level of maturity can combine the quality cost information into their decision-making system and use it. The results of this study show that using the quality cost information requires the organizational capacity for combining quality cost information into the process of planning and implementing the improvement programs. This capacity is constituted of three elements of managers’ viewpoint, availability of information and knowledge of quality. Applying the presented model in this article, firms can assess the preparedness of organizations to use the quality cost information and take, if necessary, the required measures to make the quality cost programs effective, especially in companies of a lower level of maturity.
95
This study, through identifying the factors influencing the increase in ability of an organization to apply quality cost information, offers a framework for investment and improvement of these factors with the aim of using quality cost information.
Further research into how service use COQ information in their improvement processes should be conducted. Specifically, more detailed surveys on identifying other affect factors on COQ usage should yield useful information about COQ best program results.
7.
References
Ali, H. and Arif, W. and Pirzada, D.S. and Khan, A.A. and Hussain, J. (2012). “Classical model
based analysis of cost of poor qualityin a manufacturing organization”, African Journal of
Business Management. Vol. 6, No. 2, pp. 670-680.
Al-Tmeemy, S.M.H. and Hamzah Abdul- Rahman, H. and Harun, Z. (2012). “Contractors' perception of the use of costs of quality system in Malaysian building construction projects”,
International Journal of Project Management, Vol. 30, No. 7, pp. 827–838.
Anderson, J.C., Gerbing, D.W., (1988), “Structural equationmodeling in practice: A review and
recommended two-step approach”. Psychological Bulletin, Vol. 103, No. 3, pp. 411–423.
Bajpei, A.K. and Willey, P.C.T , (1994). “A dynamic model of quality costs and benefits system for
design quality”, International system Dynamics Conference.
Bamford, D.R. and Land, N. (2006). “The application and use of the PAF quality costing model
within a footwear company”, International Journal of Quality & Reliability Management, Vol.
23, No. 3, pp. 265–278.
Campenella, J. (1999). “Principles of Quality Costs: Principles Implementation, and Use”, ASQC Quality Press, New York.
Chase, N. (1998). “Accounting for quality: counting costs, reaping rewards”, Quality, Vol. 37, No.
10, pp. 38-42.
Cheah, S.J., Md. Shahbudin, A.S and Md. Taib, F. (2010). “Tracking hidden quality costs in a
manufacturing company: an action research”, International Journal of Quality & Reliability
Management, Vol. 28, No. 4, pp. 405-425.
Chopra, A. and Garg, D. (2011). “Behavior patterns of quality cost categories”, The TQM Journal,
Vol. 23, No. 5, pp. 510-515.
Czuchry, A.J., Yasin, M.M. and Little, G.S. (1999). “A practical, systematic approach to
understanding cost of quality: a field study”, Industrial Management & Data Systems, Vol. 99
No. 8, pp. 362–366.
Eldridge, S. and Balubaid, M. and Barber, K.D. (2006). “Using a knowledge management approach
to support quality costing”, International Journal of Quality & Reliability Management, Vol.
23, No. 1, pp. 81–101.
Gupta, M. and Campbell, V. (1995). “The cost of quality”, Production & Inventory Management
Journal, Vol. 36, No. 3, pp. 43-49.
Hair, JR, and Black, W.C. and Babin, B.J. and Anderson, R.E. (2010). “Multivariate data Analysis”, Pearson Prentice Hall , Seven Editon .
Harrington, H.J. (1999). “Performance improvement: a total poor-quality cost system”, The TQM
96
Juran, J.M. (1998). “Juran‘s Quality Handbook”, McGrawhill, Fifth edition.
Kiani, B., Shirouyehzad, H., KhoshsalighehBafti, F. and Fouladgar, H. R. (2009). “System dynamics
approach to analyzing the cost factors effects on cost of quality “, International Journal of
Quality & Reliability Management, Vol. 26, No. 7, pp. 685-698.
Loduca, D.P. (2011) “Exploratory Study of Barriers to Use of Feigenbaum’s Quality Cost Strategy within Design Engineering Firms”, Dissertation, Missouri University of Science and Technology.
Low, S.P. and Yeo, H.K.C., (1998). “A construction quality costs quantifying system for the
building industry”, International Journal of Quality & Reliability Management, Vol. 15, No. 3,
pp. 329–349.
Mohandas ,V.P. and Sankaranarayanan S.R. (2008). “Cost of Quality Analysis: Driving Bottom-line
Performance”, International Journal of Strategic Cost Management, Vol. 3, No. 2, pp. 1-8.
Montgomery, D. (1996), Introduction to Statistical Quality Control, Wiley, New York, NY
Morse, W.J., Roth, H.P. and Poston, K.M. (1987). Measuring, Planning and Controlling Quality Costs, NAA Publication, Montvale, NJ.
Purgslove, A.B. and Dale, B.G. (1995). “Developing a quality costing system: key features and
outcomes”, Omega: International Journal of Management Science, Vol. 23, No. 5, pp. 567.
Rodchua, S., (2006). “Factors, measures, and problems of quality costs program implementation in
the manufacturing environment”, Journal of Industrial Technology. Vol. 22, No. 4, pp. 1–6.
Schaffer, R. and Thomson, H. (1992). “Successful change programs begin with results”, Harvard
Business Review, Vol. 70, No. 1, pp. 105-111.
Schiffauerova, A. and Thomson, V. (2006), “A review of research on cost of quality models and
best practices”, International Journal of Quality & Reliability Management, Vol. 23, No. 6, pp.
647.
Sharma, R.K., Kumar, D. and Kumar, P. (2007). “A framework to implement QCS through process
cost modeling”, The TQM Magazine, Vol. 19, No. 1, pp. 18–36.
Sharma, S. (1996). “Applied Multivariate techniques” ,Wiley, New York, NY.
Sower, V.E. and Quarles, R. (2007). “Cost of quality usage and its relationship to quality system
maturity”, International Journal of Quality & Reliability Management, Vol. 24, No. 2, pp.
121-140.
Sower, V.E. and Quarles, R. (2003). “Cost of Quality: Why More Organizations Do Not Use It Effectively”, American Society for Quality, pp. 1-14
Superville, C.R. and Gupta, S, (2001). “Issues in modeling, monitoring and managing quality costs”,
The TQM Magazine, Vol. 13, No. 6, pp. 419–424.
Weheba, G.S. and Elshennawy, A.K. (2004). “A revised model for the cost of quality”, International
Journal of Quality & Reliability Management, Vol. 21, No. 3, pp. 291–308.
Zimwara, D. and Mugwagwa, L. and Maringa, D. and Mnkandla, A. and Mugwagwa, L. and Ngwarati, T.T. (2013). “Cost of Quality as a Driver for Continuous Improvement - Case Study
– Company X”. International Journal of Innovative Technology and Exploring Engineering,