http://www.sciencepublishinggroup.com/j/ijse doi: 10.11648/j.ijse.20180201.15
Application of Support Vector Machine in Bus Travel Time
Prediction
Zhang Junyou, Wang Fanyu, Wang Shufeng
Traffic College, Shandong University of Science and Technology, Qingdao, China
Email address:
To cite this article:
Zhang Junyou, Wang Fanyu, Wang Shufeng. Application of Support Vector Machine in Bus Travel Time Prediction. International Journal of Systems Engineering. Vol. 2, No. 1, 2018, pp. 21-25. doi: 10.11648/j.ijse.20180201.15
Received: June 28, 2018; Accepted: July 12, 2018; Published: August 1, 2018
Abstract:
The travel time between bus stops has obvious characteristics of time interval distribution, and the bus is a typical space-time process object, and its operation has a state transition. In order to predict the travel time between bus stations accurately, a support vector machine (SVM) algorithm is proposed based on the measured travel time between bus stations. Through a large number of GPS data in different periods of time for a reasonable classification summary bin selected the appropriate kernel function to verify. The algorithm is verified by the actual operation data of No. 6 bus in Qingdao Economic and technological Development Zone. The results show that the results of support vector machine model operation are basically in agreement with the actual measured data, and the accuracy is relatively high, and it can even be used to predict bus travel time.Keywords:
Public Transport, Bus Travel Time Prediction, Support Vector Machine, Machine Learning1. Introduction
In the urban transportation system, when a traveler is ready to start from the starting point to the destination, there are usually multiple routes to choose from. For the urban public transport system, it is very important to predict the arrival time of the bus reasonably and accurately. The travel time of city bus has obvious characteristics of time interval distribution, especially in the morning and evening rush hour and the peak period of flat peak period, the travel time of city bus is different from that of ordinary peak period. Many problems, such as uneven bus arrival time, reduced reliability, long waiting time, large difference in passenger carrying rate, and so on, affect passengers' willingness to take public transportation. [1] So far, there are several typical methods for predicting travel time. For example, time series prediction method, prediction method based on queuing theory, Kalman filter prediction method, non-parametric regression prediction method, neural network prediction method and comprehensive prediction method and so on.
Peng Xinjian, Weng Xiaoxiong [2] uses firefly optimization algorithm combined with BP neural network to predict travel time of bus vehicles. Yang Zhaosheng [3]
proposed a real-time road travel time estimation model based on fuzzy neural network (FNN). Mei Chen [4]used AVL data to establish a Kalman filter prediction model for bus arrival time. Peng [5] proposed a correlation vector machine prediction algorithm based on Bayesian probability, which can obtain arrival time prediction value and error variance. The model can be used to predict the travel time of public transport vehicles in future road sections in real time by using the measured traffic data. In the current research, support vector machine model is mostly used in driving decision and driving behavior research, and the application in travel time prediction is very few, so this paper is based on the theory of support vector machine model to study the prediction of bus stop travel time.
2. Travle Time Prediction Methods
the following methods: time series model, artificial neural network and Kalman filtering, and so on. [6] (1) The time series model mainly depends on the similarity between the future information and the historical information. When the average situation of the historical data changes, it will lead to obvious deviation of the prediction result. Moreover, the time series model still has obvious lag in the real time prediction. (2) Kalman filtering technology is formed by introducing state space into modern control theory. It has been applied to predict the short-term traffic demand and travel time of expressways. (3) Neural network is a model that simulates the function of the human brain nervous system by modeling and connecting neurons, which are the basic units of the human brain. An artificial system with intelligent information processing functions, such as learning, association, memory and pattern recognition, is developed. In recent years, a new machine learning method-support vector machine (SVM) [7] has emerged, which mainly studies how to mine the law from limited observation data (samples) that cannot be obtained by principle analysis. The main work is to support Vector Machine (SVM) is a new machine learning method. These laws are used to analyze the objective objects and to predict and judge the unknown data or new phenomena which cannot be observed. It has a strong learning ability, generalization ability is obviously superior to neural networks, it is easy to balance the degree of fit and generalization level.
This paper mainly discusses the application of support vector machine (SVM) to predict the travel time of road sections between stations 11-12 of No. 6 Road in Qingdao Economic and technological Development Zone. [8] In the prediction, the travel time at 11-12 stations is censored and calculated according to the given data of 7 days, and the travel time is calculated according to the time variable. Considering the travel time of the section in each period of the first four days of the working day and the influence on the travel time of the section on Friday on the basis of the four days before the working day, a support vector machine model is established to predict the travel time of the section on the fifth day of the working day. The actual measured values and the predicted values on the fifth day of the working day are compared and verified.
3. Sopport Vector Machine Theory
Support vector machine (SVM) which is based on statistical learning, was first proposed by Vap-nick in the 1990s. In recent years, it has made a breakthrough in its theoretical research and algorithm implementation. It began to become a powerful means to overcome the traditional difficulties such as nonlinear and dimensional disaster problems, over-learning problems and local minima problems. Its goal is to minimize the structural risk. [9] Compared with the condition that the empirical risk requires the sample to be infinitely large, the structural risk chooses a compromise between the empirical risk and the confidence range, which is
more suitable for the case of limited samples. After solving the problem of linear separability, for nonlinear separable problems, it first transforms the input space into a high-dimensional space by using the nonlinear transformation defined by the inner product function, and the input space is transformed into a high-dimensional space by means of the nonlinear transformation defined by the inner product function. The nonlinear separable problem is transformed into the linear separable problem in this high dimensional space to find the optimal classification surface or the generalized optimal classification surface. The generalized maximum interval method or the generalized bisection nearest point method can be transformed into separable problems. [10]
Generally speaking, the relationship between vehicle running time and traffic conditions, weather and so on is very complex, it is difficult to use a specific model to describe, therefore, this paper uses SVM to map the relationship between output (running time) and input (time period, weather). Because SVM can map input data to a high dimensional feature space by kernel function, it is very effective for some complex or nonlinear problems. In addition, SVM algorithm is a convex quadratic optimization problem, which can ensure that the extremum found is the global optimal solution, unlike some other nonlinear optimization methods, it is easy to fall into local minimum. [11]
4. Support Vector Regression Modle for
Traval Time Prediction
Factors affecting travel time, such as traffic flow, average speed, traffic flow density and lane occupancy, can be obtained by vehicle detectors [12]. Among these data, the data reflecting the time change of traffic flow mainly includes the traffic parameters and historical average value of the past several periods of the road sections, and the spatial change of traffic flow mainly includes the current and past traffic parameters of the upper and lower reaches of the road section, and so on. There are some complex functional relations between travel time and these basic traffic parameters. When predicting travel time, we can find out the law and establish prediction model by analyzing the data of traffic basic parameters.
A. Establishment of the model.
According to the algorithm of support vector regression machine and the factors that affect the travel time, the road sections are divided into several sections according to the distribution of vehicle detectors, and one of them is selected. The traffic flow parameters of the first four working days from 6 am to 8 am are taken as input, and the travel time of the fifth day is taken as the output to establish the prediction model. [13]
section is divided into i segments, i =1, 2, 3,…, m. The traffic flow and average speed of a small section of road measured by the vehicle detector during the t period are recorded as qi (t) and vi (t), respectively, and the average travel time of all vehicles passing through the whole section of the road section during the t period is set to be T (t), based on the past period I. The average travel time T (t +1), T (t +2) and so on can be predicted by the traffic parameters of a small section (here only the traffic flow) and the travel time of the whole road section to predict the average travel time T (t + 1), T (t + 2) and so on.
Secondly, the structure and parameters of kernel function and support vector machine are selected to construct the training set as followed:{(x1, y1), …, (xl, yl)}, in which y1, y2, …, yl are average travel time for the entire road over the past few periods, x1, x2, …, xl are the vector combination of the traffic state parameters of small sections and the travel time of the whole section in the past few periods. [14]
Finally, according to the decision function constructed by the training results, the traffic state parameters and the travel time data of the small section in the current and past periods are inputted, and the average travel time in the next period (T (t+1)) is predicted by the decision function. [15]
B. The selection of kernel functions, model structure and parameter optimization
In support vector machine, there are polynomial kernel, Gauss radial basis (RBF) kernel, Sigmoid function, Fourier kernel, B-Spline kernel and so on. The corresponding kernel function can also be constructed according to specific problems. When using support vector machines to solve practical problems, the selection of appropriate kernel function is the key factor. After determining the kernel function, it is necessary to consider the optimization problem of model structure and parameters. [16] Now it is common practice to give some parameter combinations, by grouping the known training set data, any number of sets of data, the use of a given combination of parameters to train and predict the
remaining groups of data, repeatedly calculated, according to the prediction results, take the best worthy of the optimal model structure and parameters. [17] Parameter optimization and adjustment is one of the problems to be further studied. Heuristic intelligent optimization algorithms such as genetic algorithm and simulated annealing algorithm can be considered for optimization.
5. Case Anslysis
In order to verify the above prediction method, the time information of bus network 7 days a week is processed by using the existing data, the extraction time is 6: 00 a.m. to 10:00, and the section travel time between 11 and 12 stations is counted. The data are counted on a two-hour basis, as shown in table 1. First, data from 6 a.m. to 8 a.m. during the working day were selected for processing, with a total of 70 sets of data. Four days before the training set is constructed, the travel time of this section is the input attribute value, and the travel time T (t + 1) of the fifth day, Friday, the travel time of the road section from 6 to 8 o'clock earlier, is the output attribute value. [18] As a result, 70 sets of data sets including input and output are obtained, the first 56 sets of data are selected as training sets for training the learning machine, and the last 14 sets of data are used as validation data. The travel time is predicted by the above data of the support vector machine program in the MATLAB Toolkit.
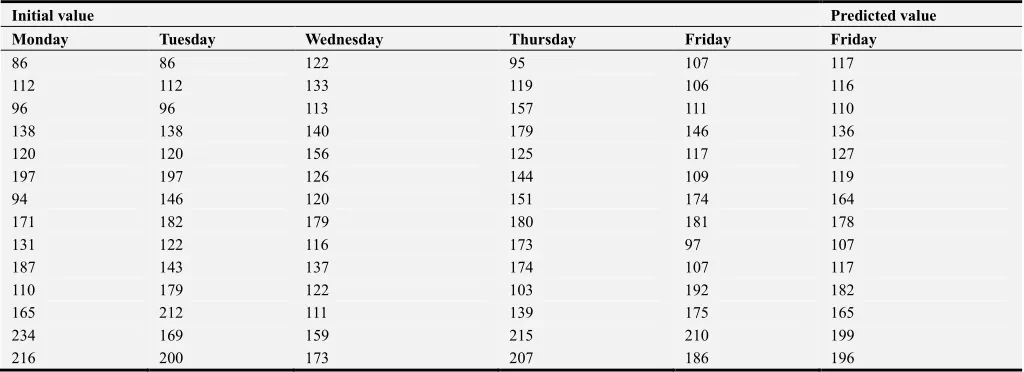
When using support vector machine (SVM) to predict, the kernel function selected is Gauss Radial basis (RBF) kernel function (whose parameter σ is 2000). The optimization process of parameters is to divide the known training set data into five groups, for example, to select four sets of prediction. The remaining 1 group, try again and again, take the best value to get. The prediction results are shown in figure 1, the relative errors and parameter selection sets are shown in figures 2, respectively, and the original values and the predicted values are shown in table 1.
Table 1. Original and predicted values for five working days.
Initial value Predicted value
Monday Tuesday Wednesday Thursday Friday Friday
86 86 122 95 107 117
112 112 133 119 106 116
96 96 113 157 111 110
138 138 140 179 146 136
120 120 156 125 117 127
197 197 126 144 109 119
94 146 120 151 174 164
171 182 179 180 181 178
131 122 116 173 97 107
187 143 137 174 107 117
110 179 122 103 192 182
165 212 111 139 175 165
234 169 159 215 210 199
Figure 1. Comparison of raw data with predicted data.
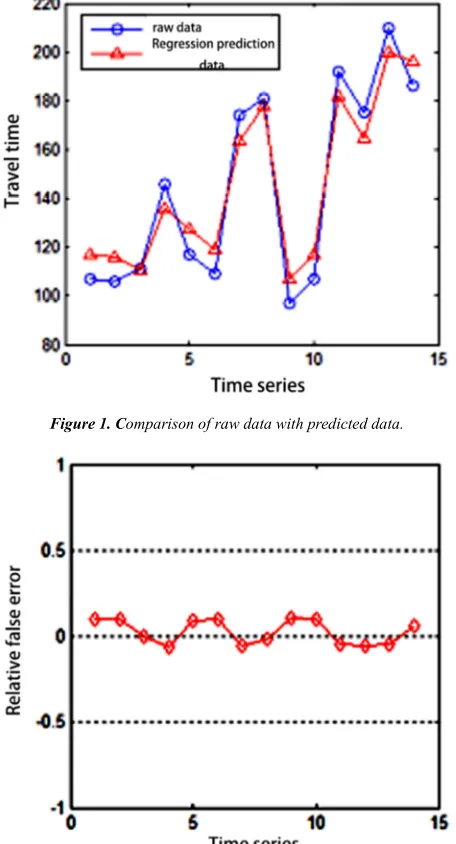
Figure 2. Relative error diagram。
Figure 1 and figure 2 show that there is not much difference between the original data and the predicted data, and it can be seen from figure 2 that the relative errors fluctuate from 0 to 0, and between -0.5-- + 0.5, indicating that the prediction is more accurate. Table 1 shows the actual values from Monday to Friday and the predicted values from Friday during the working day, which leads to the conclusion that the support vector machine is more reliable in predicting the travel time of bus sections, and it can be widely used in daily life.
6. Conclusion
Aiming at the characteristics of bus travel and current research status this paper proposes a prediction algorithm based on support vector machine for bus station travel time by classifying public transit GPS data reasonably in different periods. And select appropriate kernel function to verify.
Finally, this paper verifies the algorithm based on actual operational data of 6 bus in Qingdao Economic Technology Development Zone, which shows that SVM model is basically consistent with actual measured data and accuracy is higher.
References
[1] J. Bai Cong, Peng Zhongren. Bus travel time prediction based on dynamic model. Computer Engineering and Applications, 2016, (3), pp. 103-107.
[2] J. Fu Hua, Yu Xiang, Lu Wanjie. Ant Colony Particle Swarm Optimization Algorithm and LS-SVM Gas Emission Forecast. Journal of Sensing Technology, 2016, (3), pp. 373-377.
[3] J. Li Chunxiang, Ding Xiaoda, Ye Jihong. Prediction of pulsating wind speed based on hybrid ant colony and particle swarm optimization LS-SVM. Vibration and shock, 2016, (21), pp. 131-136.
[4] J. Peng Xinjian, Weng Xiaoxiong. Bus travel time prediction based on firefly algorithm optimized BP neural network. Journal of Guangxi Normal University, 2015 (07), pp. 28-36.
[5] J. Xiao Yang, Gao Xiaoli, Li Ting. Intelligent bus data system design. Information technology and information technology, 2015 (07), pp. 51-52.
[6] C. Ma Z L, Ferreira L, Mesbah M. Modelling Bus Traval Tine Reliability Using Supply and Demand Data from AUTOMATIC Vehicle Location and Smart Card Systems. Transportation Research Board 94th Annual Meeting, 2015 (15-0402)
[7] D. Yin Tingting. Research on Bus Dispatching Rules Based on Big Data. Beijing: School of Transportation and Transportation, Beijing Jiaotong University, 2015.
[8] J. Liu Siwen. Thinking about public transportation big data. Urban public transportation, 2015 (9), pp. 21-23.
[9] M. Ran Bin, Chen Xianghui, Zhang Jian. General Theory and Practice of Wisdom Highway. Beijing: China Communications Press, 2015, 23-26.
[10] J. Brata A H, Liang D, Pramono S H. Software Development of Automatic Data Collection for Bus Route Planning System. International Journal of Electrical and Computer Engineering (IJECE), 2015, 5 (1), pp. 150-157.
[11] J. Kumar B A, Mothukuri S, Vanajakshi L. Analytical approach to identify the optimum inputs for a bus travel time prediction method. Transportation Research Record. Journal of the Transportation Research Board, 2015, 2535, pp. 25-34.
[12] J. Ibarra Rojas O J, Delgado F, Giesen R. Planning, operation, and control of bus transport systems: A literature review. Transportation Research Part B Methodological, 2015, pp. 38-75.
[13] J. Chen X, Hellinga B, Chang C. Optimization of headways with stop skipping control: a case study of bus rapid transit system. Journal of Advanced Transportation, 2015, 49 (3), pp. 385-401.
[15] D. Jiao Yunlong. Research on Route Optimization of Logistics vehicles based on Travel time Prediction. Dalian Maritime University, 2015.
[16] J. Liu Weiming, Lei Huanyu, Zhai Cong, Li Songsong. Prediction of Expressway Short-term Travel time based on PSO-LSSVM. Highway and automobile transportation, 2017 (03), pp. 36-39+48.
[17] J. Wang Xiang, Chen Xiaohong, Yang Xiangmei. Prediction of Expressway Short-Time Travel time based on K-nearest neighbor algorithm. Chinese Journal of Highway, 2015, 28 (01), pp. 102-111.