Published online February 20, 2013 (http://www.sciencepublishinggroup.com/j/pbs) doi: 10.11648/j.pbs.20130201.12
The effect of interchange attributes on public-transport
users’intention to use routes involving transfers
Subeh Chowdhury, Avishai(Avi) Ceder*
Department of Civil and Environmental Engineering, University of Auckland, 20 Symonds Street, Auckland, NewZealand
Email address:
[email protected] (A. Ceder)
To cite this article:
Avishai(Avi) Ceder, Subeh Chowdhury. The Effect of Interchange Attributes on Public-Transport Users’Intention to Use Routes Involving Transfers. Psychology and Behavioral Sciences. Vol. 2, No. 1, 2013, pp. 5-13. doi: 10.11648/j.pbs.20130201.12
Abstract:
From past travel behavior studies it is evident that several trip attributes have been established as key factors in travelers’ decision to use public transport. Using these factors, the present study seeks to provide a psychological perspective of the inconvenience expressed by public transport users’ when making transfers between public-transport modes. The theory of planned behaviorhas been adopted to determine the trip attributes influencing public transport users’ intention to use routes involving transfers. A survey was undertaken in two major transport centers in Auckland, New Zealand. Analysis of results has shown that public transport users’ are intolerant towards greater delays, even if occurrence is rare. Minimization of transfer walking and waiting times increases users’ intention to use transfer routes. Results suggested that reliability of transfers and reduction in journey times has the most influence on users’ intention to make transfers. Findings of the study is expected to support decision makers in developing new transfer routes and improving the quality of existing transfer routes to provide travelers with a possible attractive alternative to automobile.Keywords:
PublicTransport, Theory of Planned Behavior, Transfer, Travel Behavior1. Introduction
In the last decade, trip-making behavior has grown in-creasingly complex [1]. Modern day busy lifestyles have increased the value of time. It is evident that to attract a large number of car users to switch to public transport (PT), the service quality offered need to be more market competitive. Connectivity between PT modes has been identified as an important factor in travelers’ satisfaction to use PT[2]. Li-terature on transit connectivity has been predominantly focused on transfer time (waiting and walking time) to im-prove transfer routes [2-13]. In comparison, there are a li-mited number of researches [14-18] on the effects of PT users’ perception of trip attributes on their intention to make transfers between PT modes. As a result, to the authors’ knowledge, there exist limited understandings of the effect interchange attributes (trip attributes related to transfers) have on PT users’ intention (willingness) to use routes in-volving transfers. This limitation hinders PT operators’ ability to maximize ridership of transfer routes.
The present study has two objectives. First, to determine the effect of PT users’ preference for quality of interchange attributes on their intention to use routes with transfers. Second, to produce a conceptual framework of travelers'
intention to use routes with transfers; this is to be later de-veloped into a detail model. The theory of planned behavior (TPB) has been used as a common cognitive model for the explanation of travelers’ intention to use PT [19-22]. The present study adopts the TPB to explore the relationship between travelers’ perceived behavioral control (PBC) and their intention to use transfer routes. A user preference sur-vey has been undertaken in Auckland, New Zealand. The study contributes by providing a cognitive model which explains the relationship between PT users’ preference for quality of interchange attributes and their intention to use transfer routes. Findings of the study aim to support decision makers in developing new transfer routes and to improve the quality of existing transfer routes for enabling a more effi-cient and integrated PT network.
2. Literature Review
2.1. Trip Attributes
to be more onerous than intramodal transfers [5].
Trip attributes such as personal safety, reliability of con-nection, journey time, transfer time and information related to transfers have been identified as the most important in-dicators for perception of transfer routes [3, 7, 9, 15, 18, 23].Personal safety at terminals has been revealed to be the most sensitive factor in travelers’ decision making process to use PT [24-27]. Missed transfers are a major contributor to the reliability issues of PT services [9]. Missed connections and delays were shown to cause anxiety to the user [28].There is much support of transfer waiting time being valued higher than transfer walking time [2, 17]. Other stu-dies have shown that integrated information systems are required to reduce the perceived inconvenience of making transfers [16, 18, 29].
2.2. Theory of Planned Behavior (TPB)
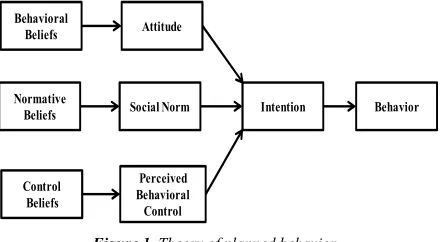
The “Theory of Planned Behavior” was first proposed by IcekAjen in 1985 in his article “From Intention to Actions: A Theory of Planned Behavior” [30]. As shown in Figure 1, one central assumption of the TPB is that intention is the only direct determinant of behavior. Intention is viewed as the resultant of three antecedents: attitude, social norm and perceived behavioralcontrol (PBC) [31].These intention antecedents are based on behavioral beliefs, normative be-liefs and control bebe-liefs, respectively. Ajzen[32] claims that these beliefs are the foundation of behavior and changes in these beliefs should lead to behavior change.
Figure 1. Theory of planned behavior.
Attitude is defined as the individual’s positive or negative evaluation of performing the intended action [32]. Social norm is defined as the individual’s perception of the social obligation to perform or not perform the intended action [32].
PBC is defined as the subjective degree of control over performance of the behavior [31]. PBC is the higher order component of control beliefs, in the hierarchical structure of TPB. Control beliefs are formed from perceived control factors which make it easier or more difficult for the indi-vidual to perform the behavior [31]. When indiindi-viduals perceive more facilitating control factors (positive control beliefs), PBC is strong, and the level of control is no longer important. The emphasis is then placed on whether the in-dividual has the intention to perform the behavior, thus strengthening the intention-behavior relationship. When
individuals perceive more difficult control factors (negative control beliefs), PBC is weak and the individual is unlikely to have the intention to perform the behavior, thus weaken-ing the intention-behavior relationship[32].
The TPB has been used as one of the psychological theo-ries to predict travel behavior [19]. From travel behavior research on PT, TPB has been used to understand the rela-tionship between travelers’beliefs and their willingness to use PT [33-37].
For example, Health and Gifford [34] used the TPB to determine the effect of reduced fare, provided by the uni-versal bus pass program (U-pass), on university students’ bus ridership. An extension of TPB was used by including variables descriptive norms, moral (personal) norms, envi-ronmental values, perceived responsibility and awareness of car-use. The study concluded that the original three con-structs is capable of explaining the changes in behavior (increase in bus use) after the U-pass implementation. Ad-dition of other variables improved the predictive ability of the model. Anable[36] adopted TPB to investigate six dis-tinct psychographic groups’ intention to switch mode (car to PT). The study included additional variables moral norms and psychological attachment to cars. The results were consistent with TPB and showed that stronger intention to use PT was associated with: more favorable attitudes to-wards alternative modes, less psychological attachment to the car, stronger moral norms and greater perceived control. The study highlighted the importance of PBC in the model.
In two cities of Germany, Bamberg et al. [33] investigated the role of personal norm in travelers’ decision to use PT instead of cars. The study restructured TPB with social norm (pro-environmental behavior) being a predictor for attitude, PBC and personal norm (anticipated feelings of guilt and perceived social norms). Analysis showed that personal norm is a strong predictor of intention and that social norm has an indirect effect on intention through attitude, PBC and personal norm. The study also concludes that social norm is a stronger indicator when travelers are from a society with higher awareness of the negative consequences of car use. Carrus et al. [22] conducted two studies on pro-environmental behaviors. One of the study explored people’s decision to use PT based on pro-environmental behaviors. The study included frequency of past behavior, anticipated emotions and desire to TPB. Results of the study supported the addition of emotion, past behavior and desire as predictors for people’s decision to use PT based on pro-environmental behaviors. Past behavior was seen to have a direct effect on intention, whereas, the effects of anticipated emotion on intention was mediated by desire.
From recent studies, Long et al. [19] adopted an extended version of TPB to determine commuters’ intention to use the future sky train in Phnom Penh, Cambodia. The additional variables included moral obligation, awareness of conse-quences, attitudinal aspect variables, socioeconomics and trip characteristics. The study concluded that intervention of attitude would be the most effective approach to increase commuters’ intention of using urban PT. Another study on
Behavioral Beliefs
Normative Beliefs
Control Beliefs
Attitude
Social Norm
Perceived Behavioral Control
mode choice by Chen et al. [35] investigated travelers’ in-tention to switch to use PT from private vehicles. The study uses TPB in conjunction with another model, technology acceptance model (TAM) and includes habit as a construct in the combined model. The results showed that all three TPB constructs predicted intention of travelers to switch to PT, with social norm being the strongest predictor. Habit was also shown to be a strong predictor of intention, which im-plied that habit of private vehicle users would, to some ex-tent, hinder their intentions to switch to PT.
From literature review, it can be seen that no past studies have investigated the potential relationship between PT users’ psychological factors and their intention to use PT routes with transfers. It is unknown to what extent the TPB can predict PT users’ intention to use transfer routes. The present study attempts to provide some understanding to this research gap.
3. Assumptions and Framework for
Reduced Theory of Planned Behavior
3.1. Assumptions
Study by Terloolen et al. [38] has shown that travelers display a psychological resistance towards switching to PT. While some auto users perceive automobile as a symbol of one’s status, others prefer automobile for its independence, comfort and convenience [21, 36, 38]. The cognitive effort of PT users was shown to be the highest compared to other mode users[39]. Thus, it is well established in literature that, generally, travelers are negatively disposed towards PT. For the present study, it was assumed that the attitude-intention relationship in transit users’ decision to use PT remains the same for PT transfer routes. Hence, exploration of the atti-tude-intention relationship was excluded from investigation.
Past studies have established that social norm has an ef-fect on the intention to use PT [22, 33, 34]. In this study, it was assumed that the social norm-intention relationship for users’ decision to use PT remains the same for transfer routes.
3.2. Study Framework
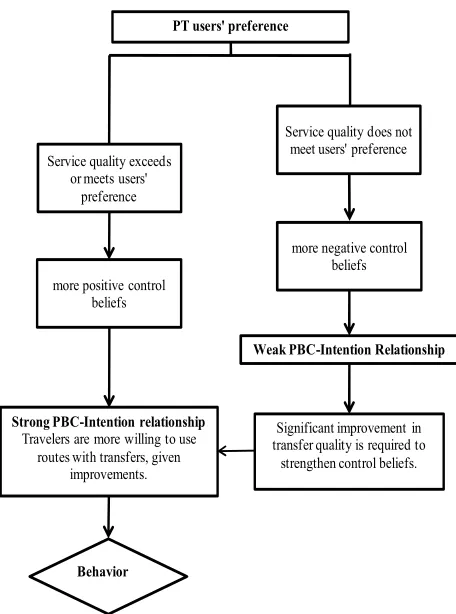
The focus of the present study is on the relationship be-tween users’ PBC and their intention to use transfer routes. Guo and Wilson [4] has shown that transit users perceive the extra walk time, wait time and fare payment required to make a transfer to be burdensome. Reliability of transfer connection has been recognized as a key factor in users’ willingness to make transfers [9, 21, 40]. Personal security at terminals, high quality information on transfer connection, and transfer time were also shown to have an effect on users’ perceive ease of making a transfer [15, 16, 25, 29, 40]. PT users’ control beliefs were determined by their preference of quality for each of the main trip attributes. Figure 2 illu-strates the effect of PT users’ preference for quality of in-terchange attributes on their intention. The main steps taken
in the case study, to assess the validity of the framework, are summarized as follows.
Figure 2. Effect of PT users’ interchange attributes preference on their PBC-intention relationship.
1) Interchange attributes (control factors): Ajzen[31] suggested that control beliefs can be measured using control factors most commonly mentioned for the behavior. Transit users’ control beliefs were measured using trip attributes derived from literature review. As discussed above, reliabil-ity of the connection, personal safety, transfer time (walking and waiting), journey time and information on transfer were shown to be the most sensitive factors in users’ decision making process [2, 7, 9, 18, 23, 27]. These attributes were used to generate the user preference questionnaire. Ques-tions were designed to determine transit users’ preference of quality for each of the main trip attributes.
2) PBC-Intention relationship: Transit users’ were asked directly of their intention to use transfer routes given im-provements made in each of the main trip attributes.
3) Intention-Behavior relationship: Transit users’ were asked directly if they would actually use a transfer route given the improvements.
Studies [5, 10, 15-18, 21, 41-43]used to select the main trip attributes for the present study were conducted in sev-eral different countries such as USA, UK, Australia, China, Belgium, Netherlands, Stockholm, Portugal, and India. Public-transport systems and socio-demographic characte-ristics of travelers captured in each study are unique to the respective country. However,results of the studies derived the same conclusion on the trip attributes which are most
Service quality does not meet users' preference Service quality exceeds
or meets users' preference
Weak PBC-Intention Relationship PT users' preference
Significant improvement in transfer quality is required to
strengthen control beliefs. Strong PBC-Intention relationship
Travelers are more willing to use routes with transfers, given
improvements.
Behavior more positive control
beliefs
important to PT users. This demonstrates that the main trip attributes used in the present study are independent of being site specific.
4. Survey
The aim of the survey was to determine PT users’ toler-ance for operational interchange attributes and preference for provisions in safety and information and thus their re-sulting intention to use transfer routes.
4.1. Survey Locations Background
The survey locations chosen for this study was the Northern Busway and New Lynn Transport Centre in Auckland. A study by Ceder et al. [6] on the connectivity of the Northern Busway has shown that the routes of the bus-way have better connectivity compared to local routes. Local feeder routes are connected to five designated stations along the Northern Expressway [6]. Transfers occur between the feeder services and the main line [6].
New Lynn Transport Centre is part of the western line for train and bus services from the west to Auckland CBD. During morning and evening peak hours, the train frequency is 15 minutes and the bus frequency is 10 minutes. Transfers occur between the two modes.
4.2. Implementation and Respondents
The target samples of this study are commuters (regular users) using PT. Participation was voluntary.After being briefly informed of the research purpose, commuters were invited to participate and complete the survey questionnaire on the spot. The survey was conducted during morning peak hours (7am-10am) in five working days. The survey proach adopted for the present study is similar to the ap-proach used in past studies on travel behavior[19, 35, 44].
The number of questionnaires distributed was 250, of which results of 223 participants were usable for data anal-ysis. Past travel behavior studies have used small sample sizes, ranging from 80 to 250 usable responses [18, 22, 34, 44]. Of the respondents, 129 (58%) are female, 167 (75%) are frequent riders and 54 (24%) currently make transfers.
4.3. Questionnaire Design
The Likert Scale is designed to measure one specific perception of the statement (item) presented to the respon-dent [45]. The Likert scale represents one of the most adopted approaches for generating reliable scales of indi-vidual differences [46, 47] and have been commonly used in travel behavioral studies [22, 33, 34, 39]. A 5-point Likert Scale (strongly disagree to strongly agree) was used in the present study. A neutral point (“no opinion”) was included in the scale to acquire responses for all items in the question-naire and to keep participants interested in completing the questionnaire [46, 47]. The questionnaire was designed to be completed within 10 minutes. For this reason, so-cio-demographic and trip characteristics question had to be
limited to age, frequency of PT use and current use of transfer routes. Table 1 provides a summary of the ques-tionnaire.
Table 1. Summary of Questionnaire. Variable
Demographic Characteristics
Gender
Trip Characteristics
Number of days per week commuter trips are made by public transport
Origin/Destination
Current trip involves a transfer
Delay in 2nd vehicle arrival
I will be OK with the 2nd vehicle arriving 5 minutes late most of the time
I will NOT mind if the 2nd vehicle arrives 5-10 minutes late sometimes
I am OK with the 2nd vehicle arriving 10-15 minutes late rarely
Transfer Walking Time
I would LIKE it if the walking time is 5 minutes
I will NOT mind if the walking time is between 5-10 minutes
It will be OK with me if walking time is between 10-15 minutes
Transfer Waiting Time
I would LIKE it if the waiting time is 5 minutes
I will NOT mind if the waiting time is between 5-10 minutes
It will be OK with me if waiting time is between 10-15 minutes
Willingness to pay for security
I would LIKE it if the additional cost was less than $1.00 per trip for better lighting
I will NOT mind if the additional cost was $1.00 to the ticket price per trip for surveillance cameras
It will be OK with me if the additional cost was $1.00 to $2.00 per trip for security guards at stations
Transfer Information
Electronic Display of arrival and departure time
Advice available on the internet about which vehicle to catch next
More information about ticket price and coordinated routes in internet
Intention to use transfer given improvement to service
Improving ONLY reliability
Improving ONLY connection (walking distance and waiting time for next vehicle)
Improving ONLY transfer related information availability
Reducing Travel Time ONLY
Choosing to use transfer route if all four improvements were made
I will use the new route with transfer
4.4. Limitations of survey
It is to be noted that the sample represents a random sample of only the morning commuters using the two survey locations. Sample selection bias was mitigated by selecting every 3rd PT user entering the stations.
5. Results and Interpretation
5.1. Statistical Analysis
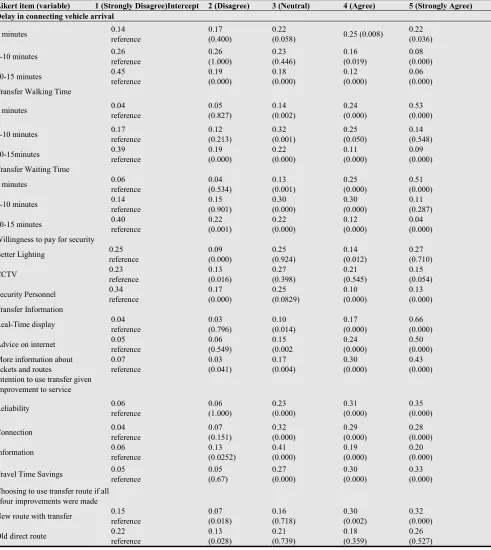
To determine statistical difference in the responses for each of the items, the data was fit into generalized linear models (GLM) of the Poisson family. The statistical package, R, was used. Poisson distribution was chosen as the response measures are in counts [48]. Table 2 shows the results of the models.The proportion of responses for each rating, along with the corresponding p-value, is given for the items.
Table 2. Results from generalized linear models
Likert item (variable) 1 (Strongly Disagree)Intercept 2 (Disagree) 3 (Neutral) 4 (Agree) 5 (Strongly Agree) Delay in connecting vehicle arrival
5 minutes 0.14
reference
0.17 (0.400)
0.22
(0.058) 0.25 (0.008)
0.22 (0.036)
5-10 minutes 0.26
reference 0.26 (1.000) 0.23 (0.446) 0.16 (0.019) 0.08 (0.000)
10-15 minutes 0.45
reference 0.19 (0.000) 0.18 (0.000) 0.12 (0.000) 0.06 (0.000) Transfer Walking Time
5 minutes 0.04
reference 0.05 (0.827) 0.14 (0.002) 0.24 (0.000) 0.53 (0.000)
5-10 minutes 0.17
reference 0.12 (0.213) 0.32 (0.001) 0.25 (0.050) 0.14 (0.548)
10-15minutes 0.39
reference 0.19 (0.000) 0.22 (0.000) 0.11 (0.000) 0.09 (0.000) Transfer Waiting Time
5 minutes 0.06
reference 0.04 (0.534) 0.13 (0.001) 0.25 (0.000) 0.51 (0.000)
5-10 minutes 0.14
reference 0.15 (0.901) 0.30 (0.000) 0.30 (0.000) 0.11 (0.287)
10-15 minutes 0.40
reference 0.22 (0.001) 0.22 (0.000) 0.12 (0.000) 0.04 (0.000) Willingness to pay for security
Better Lighting 0.25
reference 0.09 (0.000) 0.25 (0.924) 0.14 (0.012) 0.27 (0.710)
CCTV 0.23
reference 0.13 (0.016) 0.27 (0.398) 0.21 (0.545) 0.15 (0.054)
Security Personnel 0.34
reference 0.17 (0.000) 0.25 (0.0829) 0.10 (0.000) 0.13 (0.000) Transfer Information
Real-Time display 0.04
reference 0.03 (0.796) 0.10 (0.014) 0.17 (0.000) 0.66 (0.000)
Advice on internet 0.05
reference 0.06 (0.549) 0.15 (0.002 0.24 (0.000) 0.50 (0.000) More information about
tickets and routes
0.07 reference 0.03 (0.041) 0.17 (0.004) 0.30 (0.000) 0.43 (0.000) Intention to use transfer given
improvement to service
Reliability 0.06
reference 0.06 (1.000) 0.23 (0.000) 0.31 (0.000) 0.35 (0.000)
Connection 0.04
reference 0.07 (0.151) 0.32 (0.000) 0.29 (0.000) 0.28 (0.000)
Information 0.06
reference 0.13 (0.0252) 0.41 (0.000) 0.19 (0.000) 0.20 (0.000)
Travel Time Savings 0.05
reference 0.05 (0.67) 0.27 (0.000) 0.30 (0.000) 0.33 (0.000) Choosing to use transfer route if all
four improvements were made
New route with transfer 0.15
reference 0.07 (0.018) 0.16 (0.718) 0.30 (0.002) 0.32 (0.000)
Old direct route 0.22
The p-value of the responses for ratings 2 (disagree) to 5 (strongly agree) has been used to assess statistical differ-ences between a particular response and the corresponding response for rating 1(strongly disagree) for the Likert item. For models of this form, the models’ predicted values fit perfectly with the observed data.The model is saturated, in that all the information is used.
Delay in connecting vehicle arrival
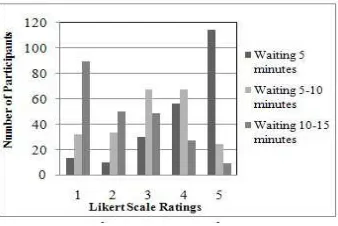
The results revealed strong statistical evidence of pas-sengers being intolerant towards the delay in arrival of connecting vehicle being greater 10-15 minutes, even if rarely. Participants generally showed acceptance (p-value: 0.008 and 0.036) towards a 5 minute delay. Figure 3 illu-strates the response distribution.
Figure 3. Tolerance for delay in connecting vehicle.
Transfer Walking and Waiting Time
Results showed strong statistical significance of the pre-ferred transfer walking and waiting time to be minimized; in this study the value is 5 minutes. Participants were nega-tively disposed towards the transfer walking and waiting time being greater than 10-15 minutes. Figure 4 and 5 illu-strate the response distributions.
Figure 4. Transfer walking time preference.
Figure 5. Transfer waiting time preference.
Willingness to pay for security
As shown in Figure 6, a higher proportion of travelers are negatively disposed to any increment in fare for increase in security provisions at stations. Of the participants who were willing to pay (rating 4 and 5), 41% wanted “better lighting”, 36% wanted security cameras and 24% wanted security guards.
Figure 6. Willingness to pay for security provisions.
Type of Transfer Information
It was of no surprise that participants responded positively towards more information being provided regarding trans-fers. Figure 7 shows real-time electronic displays being the most preferred of the three information services. However, 57% of the participants were negatively disposed towards paying an increment in fare rate of NZ$ 0.50 per trip to received more information.
Figure 7. Transit Users’ preference for type of information on transfers.
Intention to use transfer route
There is strong statistical evidence in the results obtained which suggest that participants’ intention- behavior rela-tionship to use transfer routes is positive with improvement in each of the four services. It is also evident, with statistical significance, that reliability and travel time savings have the most influence on intention.
Choosing to use transfer route
deci-sion.
6. Discussion
Findings of the present study support the proposed theo-retical framework, illustrated in Figure 2. Statistical analysis showed that as transfer walking and waiting times increased, PT users’ were less willing to use transfers. For delay in connecting vehicle, PT users’ were negatively disposed to any delay greater than 5 minutes, even if occurrence was rare. These results support findings from past studies [3, 25, 40] of reliability being a critical factor in transit users’ sa-tisfaction. Beirao and Sarsfield-Cabral [21] stated that users’ feel a lack of control due to unreliability. During the survey, participants verbally expressed that they are more com-fortable with the direct route service as it is inconvenient to make transfers due to past experience with unreliable ser-vices. Reliability of the transfer connection and reduction in travel time were shown to have the most influence on users’ intention to use transfer routes. This result is in line with findings of past studies [21, 23, 40].
Results of this study have shown that travelers are nega-tively disposed to any increment in fare rate for increase in security provisions at stations. One of the reasons could be because safety at stations has not been identified as being a major concern in Auckland, New Zealand. Of the three information services, real-time display of arrival times was most desired by participants. McCord et al. [44] has shown that real-time vehicle arrival information improves transit users’ perceived waiting time through reduction in uncer-tainty.
Findings from the present study confirm the importance of the selected trip attributes to transit users. Results suggest that the service provided by PT operators must match or exceed PT users’ expectation for users to have the intention to make transfers. According to TPB, PT users need to possess strong underlying control beliefs to produce a posi-tive PBC. Posiposi-tive PBC creates a higher intention to use transfer routes.
7. Conclusion
It has been recognized that development of a successful integrated PT network requires transfers to be perceived as being “seamless” by users [49-52]. The purpose of this study was to explore the effects of transit users’ preference for interchange attributes on their intention to use routes with transfers. This study introduced the theory of planned be-havior to be used as a model to determine the effect of terchange attributes’ quality on transit users’ perceived in-convenience of making transfers. Public-transport users’ control beliefs for making transfers were measured using interchange attributes: reliability of connection, transfer walking and waiting time, information on transfer and travel time. Control belief related to personal safety at stations and need for information was indicated by users’ willingness to pay for improved provisions.
Results showed that, due to the extra effort required in making transfers, transit users’ must harbor strong underly-ing control beliefs, and thus a positive perceived behavioral control, to have the intention to use transfer routes.
Findings have suggested that transit users’ preferencefor quality of interchange attributes and their intention to use transfer routes can be mapped using the theory of planned behavior. Further research is required to determine the magnitude of the effect of each interchange attribute on intention.
References
[1] Currie, G. and A. Delbosc, "Exploring the trip chaining behaviour of public transport users in Melbourne". Transport Policy, 2011. 18(1): pp. 204-210.
[2] Iseki, H. and B.D. Taylor, "Not All Transfers Are Created Equal: Towards a Framework Relating Transfer Connectivity to Travel Behaviour". Transport Reviews, 2009. 29(6): pp. 777-800.
[3] Hadas, Y. and P. Ranjitkar, "Modeling public-transit connec-tivity with spatial quality-of-transfer measurements". Journal of Transport Geography, 2012. 22: pp. 137-147.
[4] Guo, Z. and N.H.M. Wilson, "Modeling the Effect of Transit System Transfer on Travel Behaviour". Transportation Re-search Record, 2007. No.No. 2006, pp. 11-20.
[5] Liu, R., R.M. Pendyala, and S. Polzin, "Assessment of In-termodal Transfer Penalties Using Stated Preference Data". Transportation Research Record 1997. No.1607: pp. 74-80.
[6] Ceder, A., L.-A. Yann, and C. Coriat, "Measuring Public Transport Connectivity Performance Applied in Auckland". Transport Research Record, 2009. No. 2111, pp. 139-147.
[7] Muller, T. and P. Furth, "Transfer Scheduling and Control to Reduce Passenger Waiting Time ". Transport Research Record, 2009. No.No. 2112, pp. 111-118.
[8] Hsu, S.C., "Determinants of passenger transfer waiting time at multi-modal connecting stations". Transportation Research Part E: Logistics and Transportation Review, 2010. 46(3): pp. 404-413.
[9] Hadas, Y. and A. Ceder, "Public Transit Network Connectiv-ity". Transportation Research Record, 2010. No.No. 2143, pp. 1-8.
[10] Currie, G. and C. Loader, "Bus Network Planning for Transfers and the Network Effect in Melbourne, Australia". Transportation Research Record, 2010. No. 2145, pp. 8-17.
[11] Guo, Z. and N.H.M. Wilson, "Assessment of the Transfer Penalty for Transit Trip". Transportation Research Record 2004. No. 1872: pp. 10-18.
[12] Becker, A.J. and F. Spielberg, "Implementation of a Timed Transfer Network at Norfolk, Virginia". Transportation Re-search Record, 1999. No.No. 1666, pp. 3-13.
[14] Sharaby, N. and Y. Shiftan, "The impact of fare integration on travel behavior and transit ridership". Transport Policy, 2012. 21: pp. 63-70.
[15] Kumar, P., S.Y. Kulkarni, and M. Parida, "Security percep-tions of Delhi commuters at Metro-bus interchange in multi modal perspective". Journal of Transport Security, 2011. 4: pp. 295-307.
[16] Bachok, S. "What do passengers need out of public transport information systems?".in 29th Conference of Australian In-stitute of Transport Research. 2007. Adelaide, Australia.
[17] VandeWalle, S. and T. Steenberghen, "Space and time related determinants of public transport use in trip chains". Trans-poration Research Part A, 2006. 40: pp. 151-162.
[18] Molin, E. and C. Chorus, "The Need for Advanced Public Trasnport Information Services When Making Trasnfers". European Journal of Transport and Infrastructure Research (EJTIR), 2009. 4(9): pp. 397-410.
[19] Long, B., K. Choocharukul, and T. Nakatsuji, "Psychological Factors Influencing Behavioral Intention Toward Future Sky Train Usage in Phnom Penh, Cambodia". Transportation Research Record 2011. No.No. 2217, pp. 63-70.
[20] Healh, Y. and R. Gifford, "Extending the Theory of Planned Behaviour: Predicting the Use of Public Transportation". Journal of Applied Social Psychology, 2002. 32(10): pp. 2154-2189.
[21] Beirao, G. and J.A. Sarsfield-Cabral, "Understanding atti-tudes towards public transport and private car: A qualitative study". Transport Policy, 2007. 14(6): pp. 478-489.
[22] Carrus, G., P. Passafaro, and M. Bonnes, "Emotions, habits and rational choices in ecological behaviours: The case of recycling and use of public transportation". Journal of En-vironmental Psychology, 2008. 28(1): pp. 51-62.
[23] Callaghan, L. and W. Vincent, "Preliminary Evaluation of Metro Orange Line Bus Rapid Transit Project". Transporta-tion Research Record, 2007. No.2034, pp. 37-44.
[24] Liu, R., "An Assessment of Intermodal Transfer Disutility". Department of Civil and Environmental Engineering, 1996. No.PhD, pp. 156.
[25] Eboli, L. and G. Mazzulla, "Performance indicators for an objective measure of public transport service quality". Eu-ropean Transport, 2012. 51: pp. 1-21.
[26] Iseki, H. "How Do People Perceive Service Attributes at Transit Facilities? An Examination of Perceptions of Transit Service by Transit User Demographics and Trip Characteris-tics". in 90th Transportation Research Board Annual Meeting. 2011. Washington D.C., USA.
[27] Atkins, S.T., "Personal security as a transport issue: a state-of-the-art review". Transportation Reviews, 1990. 10(2): pp. 111-125.
[28] Cheng, Y.-H., "Exploring passenger anxiety associated with train travel ". Transportation, 2010. 37(6): pp. 875-896.
[29] Grotenhuis, J.W., B.W. Wiegmans, and P. Rietveld, "The desired quality of integrated mulitmodal travel information in public transport: Customer needs for time and effort sav-ings". Transport Policy, 2007. 14: pp. 27-38.
[30] Ajzen, I., "The Theory of Planned Behavior". Organizational
Behavior and Human Decision Processes, 1991. 50: pp. 179-211.
[31] Ajzen, I., "Perceived behavioral control, self-efficacy, locus of control, and the theory of planned behavior". Journal of Applied Social Psychology, 2002. 32(4): pp. 665-683.
[32] Ajzen, I., "Attitudes, Personality and Behaviour". 2 ed, ed. T. Manstead. 2005, New York, USA: McGraw-Hill.
[33] Bamberg, S., M. Hunecke, and A. Blobaum, "Social context, personal norms and the use of public transportation: Two field studies". Journal of Environmental Psychology, 2007. 27(3): pp. 190-203
[34] Heath, Y. and R. Gifford, "Extending the Theory of Planned Behaviour: Predicting the Use of Public Transportation". Journal of Applied Social Psychology, 2002. 32(10): pp. 2154-2189.
[35] Chen, C. and W. Chao, "Habitual or reasoned? Using the theory of planned behavior, technology accpetance model, and habit to examine switching intentions towards public transit ". Transportation Research Part F, 2011. 14(2): pp. 128-137.
[36] Anable, J., "'Complacent Car Addicts' or 'Aspiring Envi-ronmentalists'? Identifying travel behaviour segments using attitude theory". Transport Policy, 2005. 12(1): pp. 65-78.
[37] Bamberg, S. and P. Schmidt, "Regulating Transport: Beha-vioural Changes in the Field". Journal of Consumer Policy, 1999. 22: pp. 479-509.
[38] Tertoolen, G., D. Van Kreveld, and B. Verstraten, "Pyscho-logical Resistance Against Attempts to Reduce Private Car Use". Transportation Research Part A, 1998. 32(3): pp. 171-181.
[39] Gatersleben, B. and D. Uzzell, "Affective Appraisals of the Daily Commute". Environment and Behaviour, 2007. 39(3): pp. 416-431.
[40] Bates, J., et al., "The valuation of reliability for personal travel". Transportation Research Part E, 2001. 37(2-3): pp. 191-229.
[41] Guo, Z. and N.H.M. Wilson, "Assessing the cost of transfer inconvenience in public transport systems: A case study of the London Underground". Transporation Research Part A: Policy and Practice, 2011. 45(2): pp. 91-104.
[42] Xumei, C., L. Qiaoxian, and D. Guang, "Estimation of Travel Time Values For Urban Public Transport Passengers Based on SP Survey". Journal of Transportation Systems Engi-neering and Information Technology, 2011. 11(4): pp. 77-84.
[43] Friman, M. and M. Fellesson, "Service Supply and Customer Satisfaction in Public Transportation: The Quality Paradox". Journal of Public Transportation, 2009. 12(4): pp. 57-69.
[44] McCord, M.M., J. Wirtz, and R.G. Mishalani, "Passenger waiting time perceptions at bus stops". Journal of Public Transportation, 2006. 9(2): pp. 89-106.
[45] May, T., "Social Research: Issues, Methods and Process". 4th ed, ed. O.U. Press. 2011, Maidenhead, England: McGraw-Hill Education.
[47] Singleton Jr, R.A. and B.C. Straits, "Approaches to Social Research". 4th ed, ed. O.U. Press. 2005, New York, USA: Oxford University Press, Inc.
[48] Graybill, F.A., "Theory and application of the linear model". 1976, North Scituate, USA: Duxbury Press.
[49] Ibrahim, M.F., "Improvements and integration of a public transport system: the case of Singapore". Cities, 2003. 20(3): pp. 205-216.
[50] Ulengin, F., et al., "An integrated transportation decision support system for transportation policy decisions: The case of Turkey". Transporation Research Part A, 2007. 41: pp. 80-97.
[51] Luk, J. and P. Olszewski, "Integrated public transport in Singapore and Hong Kong". Road and Transport Research, 2003. 12(4): pp. 41-51.