Publication Date: Jan. 25, 2019
DOI: 10.14738/abr.71.5751.
Heryanto., & Sumarni, S. (2019). The Effect of Certification, Competence, and Motivation on Teachers Performance of Country Civil Apparatus in Sawahlunto City. Archives of Business Research, 7(1), 41-56.
The Effect of Certification, Competence, and Motivation on
Teachers Performance of Country Civil Apparatus in Sawahlunto
City
Heryanto
Chair of the Management Master Program, School of Finance and Banking (STIE “KBP”),
JL Khatib Sulaiman No. 61 Lolong Belanti, Padang Utara 25136, West Sumatra, Indonesia
Sri Sumarni
Headmaster of State High School 1 Sawahlunto, JL Jendral Sudirman No. 7 Kec Lembah Segar,
Kota Sawah lunto 27417, Indonesia
ABSTRACT
The purpose of this study was to determine the effect of certification and competence on motivation and its impact on the performance of State High School teachers with B Accreditation in Sawahlunto City. This research is motivated by the lack of maximum performance of teachers who have received certification, so this will affect the quality of education in the city of Sawahlunto. The research method uses a quantitative approach with path analysis methods. Respondents of this study were 94 ASN Teachers in State High Schools in Sawahlunto City. The sampling method is total sampling. Hypothesis testing is calculated by IBM Statistical Package for Social Science (SPSS) program version 21.0. The results of this study found that certification has a significant effect on motivation, competence has no significant effect on motivation, certification does not have a significant effect on performance, competence has a significant effect on performance, motivation has a significant effect on performance, indirectly certification through motivation has a significant influence on performance directly competence through motivation has a significant influence on the performance of State High School Teachers in the City of Sawahlunto.
Keywords: certification, competence, motivation, performance, teacher, apparatus, civil state
INTORUDUCTION
In this study found a number of phenomena regarding certification allowances, including teachers who have not all carried out their duties as professional teachers, teachers feel very troubled in achieving 24-hour fulfillment. This fact shows that during the current certification process, it turns out that it has not shown any real changes towards the better, so that further improvement of the certification system needs to be carried out in order to show more tangible results. As expected, the main objective of the certification program is to increase knowledge, performance, creativity, and be able to carry out other functions related to the leaning and teaching process.
The purpose of this study is to find out and test:
1. Effect of certification on the motivation of State High School Teachers in Sawahlunto City
2. Effect of competency on the motivation of State High School Teachers in Sawahlunto City
3. The effect of motivation on the performance of State High School Teachers in Sawahlunto City
4. The effect of certification on the performance of State High School Teachers in Sawahlunto City
5. Pengaruh komptensi terhadap kinerja Guru SMA Negeri di Kota Sawahlunto.Effect of competency on the performance of State High School Teachers in Sawahlunto City 6. The influence of motivation as an intervening variable between certification and
performance of teachers of State High School in Sawahlunto City
7. The influence of motivation as an intervening variable between the competency and performance of teachers of State High Schools in the Sawahlunto City
LITERATURE REVIEW Teacher Performance
Teacher performance is a result of work that is achieved by a teacher in carrying out tasks assigned to him based on skills, experience, and sincerity and time (Hasibuan, 2003, p.94). Teacher performance is the teacher's ability to increase the effectiveness of his teaching, overcome practical problems in the learning process. Teacher performance is shown in the activities of planning, implementing and evaluating the learning process (Jalal, 2001, p.293). In addition, the things that need to be considered in order to achieve high teacher performance require the existence of factors that influence teacher performance so that the government organizes teacher certification programs as an effort to improve the quality and dignity of teachers and the professionalism of teachers to improve their performance as a whole. According to research conducted by Jayanti (2018), the results of her research provide empirical evidence that the variables of certification, motivation, competence both simultaneously and partially have a positive and significant effect on teacher performance. And these results are similar to those stated by Wahyudi and Hadi (2017) from his research found that the results of certification have a significant effect on Teacher performance, motivation has a significant effect on Teacher performance, competence has a significant effect on Teacher performance, and simultaneously there are positive and significant variables certification, motivation, and competence towards the performance of State Primary School Teachers in Pakisaji District, Malang Regency.
competencies, (d) learning material, (e) learning activities, (f) indicators, (g) time allocation, and (h) learning resources; (2) Learning procedure with indicators: (a) classroom management, (b) use of media and learning resources, and (c) use of learning methods; (3) Interpersonal relations with indicators: (a) ability to make evaluations, (b) approach evaluation, (c) methods of evaluation, (d) preparation of evaluation tools, (e) processing evaluation, and (f) use of evaluation results.
Certification
The term certification is "as a sign / statement (written statement / located from the authorized person / institution given to the type of profession to carry out the task" (Diknas, 2005, p.159). According to Mulyasa (2007), certification can be interpreted as the process of giving recognition that someone has the competence to carry out education services in a particular education, after passing the competency test held by the certification body, so certification here means giving certificates to teachers who have been declared to have passed the competency test held by the certification body. It is expected that the teacher will become a professional educator, namely minimum bachelor degree and competency as an agent of learning as evidenced by the ownership of educator certification after being declared to pass the competency test. use the ability to be able to manage the potential of students as agents of learning. The purpose of this certification is to protect the teaching profession and staff, teacher certification, the program is a motivation to improve teacher performance. Like the results of research by Zulkifli, et al. (2014), the research findings suggest that work motivation and certification play an important role in efforts to enhance teacher welfare and performance. Teacher performance can be predicted through teacher welfare. The same thing was conveyed by Fatiah, et al. (2013), based on his research, it was found that there was a positive effect of teacher certification on teacher performance and there was a positive influence on teacher certification and teacher work motivation on the teacher performance of State High School 5 Surakarta. And the statement was also supported by Murwati (2013) research, based on the results of her research that there was an influence of teacher professional certification on work motivation and there was an effect of teacher professional certification on teacher performance.
The dimensions and indicators of teacher certification (Mulyasa, 2003, p.33), are: (1) Competence of Study Skills, with indicators: (a) Understanding of educational insights, and (b) mastery of academic study material; (2) Understanding the characteristics of learners, with indicators: (a) understanding the characteristics of students; (3) Educating Learning, with indicators: (a) carrying out educational learning; (4) Professional Development, with indicators: (a) preparation of RPP, (b) assessment of student achievement, and (c) implementation of follow-up research results; (5) Educator Personality, with indicators: (a) personality of faithful educators, (b) devoted, (c) insightful Pancasila, (d) independent full of responsibility, (e) authoritative, (f) discipline, (g) dedicated , (h) socializing with the community, and (i) the love of students and caring about their education.
Competence
has a significant effect on teacher performance and simultaneously there is a positive and significant influence on the variables of certification, motivation, and competence on the performance of State Primary School Teachers in Pakisaji District, Malang Regency. The results of these studies are also supported by research conducted by Jayanti (2018), whose research provides empirical evidence that the variables of certification, motivation, competence both simultaneously and partially have a positive and significant effect on teacher performance.
As according to Kunandar (2008, p.75), the dimensions and indicators of teacher competency, namely: (1) Pedagogic Competence, with indicators: (a) understanding students in depth, (b) designing learning, including understanding the educational foundation for the interests learning, (c) implementing learning, (d) designing and implementing learning evaluations, and (d) developing students to actualize their various potentials; (2) Personality Competence, with indicators: (a) stable and stable personality, (b) adult personality, (c) wise personality, (d) authoritative personality, and (e) noble character and can be an example; (3) Social Competencies, with indicators: (a) able to communicate and interact effectively with students, (b) be able to communicate and interact effectively with fellow educators and education personnel, and (c) be able to communicate and interact effectively with people ; and (4) Professional Competencies, with indicators: (a) mastering scientific substance related to the field of study, and (b) mastering scientific structures and methods.
Motivation
According to Uno (2008, p.1) defines motivation as a strength, both from within and from outside which encourages a person to achieve certain goals that have been previously set. Meanwhile, Hasibuan (2003, p.95) states that "Motivation is the giving of driving force that creates the excitement of one's work, so that they will cooperate, work effectively and be integrated with all their efforts to achieve satisfaction." So motivation is what drives someone do something to achieve the goal. According to Fatiah, et al. (2013) there is a positive influence on teacher work motivation on teacher performance and there is a positive influence on teacher certification and teacher work motivation on the teacher performance of state high school Surakarta. This is also supported by the results of research conducted by Kanto (2015) who found that there was an effect of work motivation and job satisfaction on the performance of the counselor on certain performance ratings. The same thing was also conveyed by Murwati (2013), from her research, it was found that there was an effect of teacher professional certification on work motivation. And the same thing was conveyed by Wahyudi and Hadi (2017), with the results of the study: motivation has a significant effect on teacher performance and simultaneously there is a positive and significant influence on the variables of certification, motivation, and competence on the teacher performance of state elementary school in Pakisaji sub district, Malang district.
RESEARCH LOCATION
This research was conducted on State Senior High School teachers who had received certification and spread in 3 Sawahlunto City State High Schools that had a minimum B Accreditation, namely: State High School 1 Sawahlunto, State High School 2 Sawahlunto, and State High School 3 Sawahlunto.
Conceptual Framework
The conceptual framework describes the effect of independent variables on the dependent variable or the influence of one variable on the other variables to be examined.
Figure 1: Research Conceptual Framework
Hypothesis
Based on the conceptual framework above, the hypothesis can be formulated in this study as follows:
H1: It is suspected that certification has a significant effect on the motivation of high school teachers in Sawahlunto City
H2: It is suspected that competency has a significant effect on motivation of high school teachers in Sawahlunto City
H3: It is suspected that motivation has a significant effect on performance of high school teachers in Sawahlunto City
H4: It is suspected that certification has a significant influence on the performance of high school teachers in Sawahlunto City
H5: It is suspected competence gives a significant influence on the performance of high school teachers in Sawahlunto City
H6: It is suspected that motivation as an intervening variable has a significant influence between the certification and performance of high school teachers in the Sawahlnto City
H7: It is suspected that motivation as an intervening variable has a significant influence between competency and performance of state high school in the Sawahlunto City
RESEARCH METHOD
In accordance with the conceptual framework of thought, two structural equations can be made, namely the regression equation that shows the hypothesized relationship. The two equations are as follows:
Y = ρYX1.X1 + ρYX2.X2 + e1 Z = ρZX1.X1 + ρZX2.X2 + + ρZY.Y + e2 Information:
Y = Motivation Z = Performance
rX1X2 = Correlation Coefficient Certification with Competence rX1Y = Correlation Coefficient Certification with Motivation ρYX1.X1 = Certification Path Coefficient on Motivation ρYX2.X2 = Competency Path Coefficient on Performance ρZX1.X1 = Certification Path Coefficient on Performance ρZX2.X2 = Competency Path Coefficient on Performance ρZY.Z = Motivation Path Coefficient on Performance
rX2Y = Competency Correlation Coefficient with Motivation e1 = Other factors that influence motivation
e2 = Other factors that influence performance
DATA ANALYSIS AND DISCUSSION Characteristics of Respondents
The research respondents were teachers of State High Schools in the City of Sawahlunto, who had certification and were accredited B. Respondents who were permanent teachers in the State High School were State Civil Apparatus. Respondents were scattered in three State High Schools in Sawahlunto City namely State High School 1, State High School 2 and State High School 3. The number of respondents was 94 people. Retrieving information from teachers as respondents in this study was carried out by distributing questionnaires. the questionnaire distributed was 94 questionnaires. The following are information on characteristics of respondents:
Table 1: Respondent Charateristic
Charateristic Item Respondent ( people ) Percentage ( % ) ( people ) Total Percentage ( % )
Gender Male 15 16 94 100
Female 79 84
Age 31 – 40 years 15 16
94 100
41 – 50 years 30 32
51 – 60 years 49 52
Service
Period 10 – 20 years 20 – 30 years 34 60 36 64 94 100
Education S1 69 73 94 100
S2 25 27
Source: Primary Data, Processed by Author, 2018
Description of Research Results
Table 2: Results of Variable Descriptive Analysis Descriptive Statistics
N Min Max Mean Deviation Std. Variance Item
Pernyataan TCR Ket Statistic Statistic Statistic Statistic Statistic Statistic
Certificationi (X1)
94 356 488 409.36 356 693.524 25 83,79 Baik
Competency (X2) 94 320 468 420.17 320 961.347 25 78,98 Baik
Motivation (Y) 94 332 444 393.79 332 1015.610 25 89,65 Baik
Performance (Z) 94 372 496 436.81 372 1514.522 45 88,67 Baik
Valid N (listwise) 94 693.524
Source: Primary Data, Processed by IBM SPSS 21.0, 2018
From the table above it can be seen that from each variable has an average of 39.38% - 43.68% and the level of achievement of the respondents an average percentage of 85.27%. This can be interpreted that each respondent variable has a good average category response.
Validity test
Untuk mengetahui validitas kuesioner dilakukan dengan teknik korelasi Pearson Product
Moment yaitu dengan cara melakukan korelasi antar skor setiap variabel dengan skor totalnya.
Untuk mengetahui validitas kuesioner dilakukan dengan membandingkan r hitung dengan r
tabel. Jika hasil r hitung lebih besar dari r tabel, maka pernyataan tersebut valid, sebaliknya jika r hitung lebih kecil dari r tabel, maka pernyataan tersebut tidak valid.
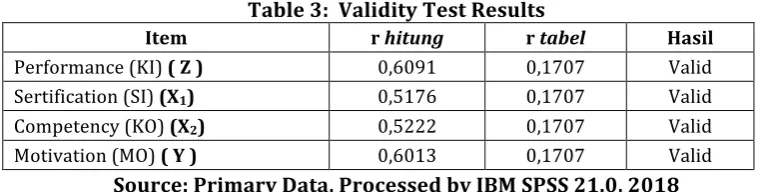
To find out the validity of the questionnaire conducted by Pearson Product Moment correlation technique that is by doing a correlation between the scores of each variable with the total score. To find out the validity of the questionnaire is done by comparing the r count with r table. If the result of r count is greater than r table, then the statement is valid, whereas if r count is smaller than r table, then the statement is invalid.
Table 3: Validity Test Results
Item r hitung r tabel Hasil
Performance (KI) ( Z ) 0,6091 0,1707 Valid
Sertification (SI) (X1) 0,5176 0,1707 Valid
Competency (KO) (X2) 0,5222 0,1707 Valid
Motivation (MO) ( Y ) 0,6013 0,1707 Valid
Source: Primary Data, Processed by IBM SPSS 21.0, 2018
It is known that the value of r calculates all variable statement items greater than r table. This means that all statement items are declared valid.
Reliability Test
Reliability is a test tool to determine the reliability of a variable or to what extent the measurement results have consistency if several measurements are made on the same symptoms. High and low reliability is indicated by a number of Cronbach Alpha coefficients (α) ≥ 0.60.
Table 4: Reliability Test Results
Variabel Cronbach Alpha (α) Keterangan
Performance (Y) 0,831 Reliabel
Certification (X1) 0,783 Reliabel
Competency (X2) 0,831 Reliabel
Motivation (I) 0,831 Reliabel
The Cronbach's Alpha value of all variables is greater than 0.6. The meaning is that the measuring instruments used from all variables in this study are reliable.
Normality test
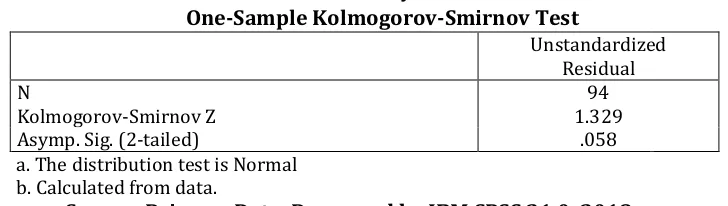
This normality test is used to test the normality of the regression model. Tests are carried out using the Kolmogrov-Smirnov test for each variable. The regression model is normally distributed when the value is sign. Kolmogrov-smirnov each variable is greater than α = 0.05. The results of the normality test can be seen in the table below:
Table 5: Normality Test Results One-Sample Kolmogorov-Smirnov Test
Unstandardized Residual
N 94
Kolmogorov-Smirnov Z 1.329
Asymp. Sig. (2-tailed) .058
a. The distribution test is Normal b. Calculated from data.
Source: Primary Data, Processed by IBM SPSS 21.0, 2018
Berdasarkan hasil uji normalitas menggunakan SPSS 21.0 membuktikan bahwa nilai Asymp. Sig
lebih besar dari alpha sebesar 0,05. Dapat disimpulkan bahwa data di atas memenuhi asumsi normalitas.
Based on the results of the normality test using SPSS 21.0 prove that the value of Asymp. Sig greater than alpha of 0.05. It can be concluded that the data above meets the assumptions of normality. From these results it can be seen that this research data has been normally distributed.
Linearity Test
Furthermore, linearity testing using P-P Plot Graph can be seen in the picture below:
Figure 2: Linearity Test Results
From the picture above, it can be seen that the Normal P P-Plot output points are Normal. This linearity test states that the specification of the model used is correct and the function of the regression equation used is linear.
Multicollinearity Test
Table 6: Multicollinearity Test Results
Model Tolerance Collinearity Statistics VIF
1
(Constant)
Certification (X1) 0,741 1,349
Competency (X2) 0,633 1,580
Motivation (Y) 0,585 1,710
Source: Primary Data, Processed by IBM SPSS 21.0, 2018
Multicollinearity test is a way to detect the presence or absence of multicollinearity in the regression model through value tolerance and variance inflation factor (VIF). The cut-off value that is commonly used to indicate the presence of multicolonity is the tolerance value of ≥ 0.10 or equal to the value of VIF ≥ 1.0.
From the table above it is obtained: (a) Certification Variable (X1), Tolerance value = 0.741; and VIF = 1,349. So it can be concluded that this variable does not occur multicollinearity; (b) Competency Variable (X2), Tolerance value = 0.633; and VIF = 1,580. Then it can be concluded that this variable does not occur multicollinearity; (c) Motivation Variables (Y), Tolerance value = 0.585; and VIF = 1,710. So it can be concluded that this variable does not occur multicolonity.
Heteroscedasticity Test
Heteroscedasticity test produces a scatterplot graph as shown in the figure as follows:
Figure 4: Heteroscedasticity Test Results
From the picture above, which is the Scatterplots output, it is known that: (a) Spread points above and below or around zero, (b) Points not gathering just above or below, (c) Spreading points the data does not form a wavy pattern and then narrows and widens again, and (d) the spread of non-patterned data points. Thus it can be concluded that there is no heteroscedasticity problem, so this regression model qualifies as a good and ideal model.
ANALYSIS AND RESULTS Path Analysis
Path Model I
Path Coefficient of Model I
Table 7: R Square Y Value
Model Summaryb
Model R R Square Adjusted R Square
Std. Error of the Estimate
1 0,644a 0,415 0,402 2,458
a. Predictors: (Constant), Competency (X2), Certification (X1) b. Dependent Variable: Motivation (Y)
Source: Primary Data, Processed by IBM SPSS 21.0, 2018
Based on the table above, it was found that the significance value of the certification variable (X1) = 0.001 <0.05, this means that certification (X1) has a significant effect on motivation (Y). While the competency variable (X2) = 0,000< 0.05, which means that competency (X2) also has a significant effect on motivation (Y). while the value of R2 (R Square) found in the Model Summary table is 0.415 which gives the meaning that the contribution of variables X1 and X2 to Y is 41.5% and the remaining 58.5% is the contribution of other variables not included in research. And from the value of R2, obtained e1 by means of e1 = √ (1 - 0.415) = 0.765.
Table 8: Effect of X1 and X2 on Y
Based on the results above, the structural equation is obtained:
Y = 0,290.X1 + 0,468.X2 + 0,765
Dari pengolahan data di atas maka dapat diperoleh Diagram Jalur Model I, sebagai berikut:
Figure 5: Model I – Path Analysis
B. Path Coefficient Model II
Multiple linear regression analysis is still used in subsequent studies to obtain the model two path coefficients. The aim is to determine whether there is an influence of independent variables (certification and competence) and intervening variables (motivation) on the dependent variable (performance). Can be seen in the table below:
Coefficientsa
Model Unstandardized
Coefficients
Standardized Coefficients
t Sig.
B Std. Error Beta
1
(Constant) 4,069 4,397 0,925 0,357
Certification (X1) 0,295 0,090 0,290 3,292 0,001
Competency (X2) 0,557 0,105 0,468 5,318 0,000
a. Dependent Variable: Motivation (Y)
Tabel 9: R Square Z (Performance) ResultModel Summaryb
Model R R Square Adjusted R
Square Std. Error of the Estimate
1 0,856a 0,732 0,724 2,003
a. Predictors: (Constant), Motivation (Y), Competency (X2), Certification (X1)
b. Dependent Variable: Performance (Z)
Source: Primary Data, Processed by IBM SPSS 21.0, 2018
Based on the table above, it is obtained that the significance value of the three variables is certification (X1) = 0.318> 0.05. This means that certification (X1) has no significant effect on performance (Z). While the competency variable (X2) = 0,000 <0.05, which means that competency (X2) has a significant effect on performance (Z). And for the motivation variable (Y) = 0,000 <0,05 which means that it has a significant effect on performance (Z). For the value of R2 contained in the Model Summary table is 0.732 which gives the meaning that the contribution of variables X1, X2 and Y to Z is equal to 73.2% and the remaining 16.8% is the contribution of other variables not included in the study. And from the value of R2, e2 is obtained by means of e2 = √ (1 - 0.732) = 0.528.
Tabel 10: Effect of X1, X2 and Y on Z
Coefficientsa
Model Unstandardized
Coefficients Standardized Coefficients t Sig.
B Std. Error Beta
1
(Constant) -5,191 3,599 -1,442 0,153
Certification (X1) -0,078 0,077 -0,064 -1,004 0,318
Competency (X2) 0,663 0,098 0,465 6,788 0,000
Motivation (Y) 0,633 0,085 0,529 7,416 0,000
a. Dependent Variable: Performance (Z).
Source: Primary Data, Processed by IBM SPSS 21.0, 2018
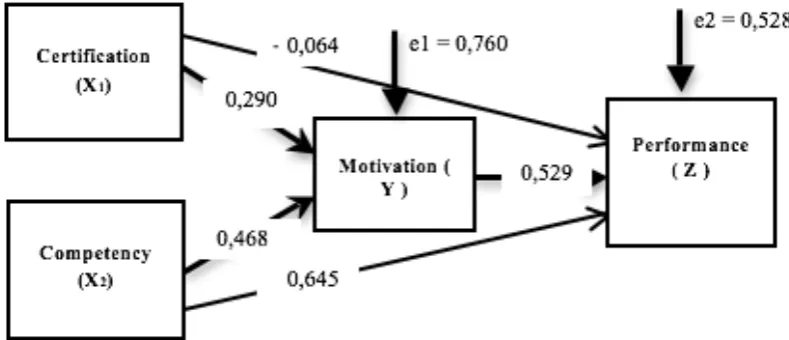
Based on the results above, the structural equation is obtained:
Z = - 0,064.X1 + 0,645.X2 + 0,529.Y + 0,528
From processing of data above, can be obtained the path chart of model II as follows:
C. Hypothesis Test Results
From the two path analysis models, the following hypothesis has been obtained: 1. Analysis of the influence of certification (X1) on motivation (Y)
From the analysis of the variables above, the value of variable X1 = 0.001 <0.05. This means that X1 has a direct significant effect on Y.
2. Analysis of the influence of competence (X2) on motivation (Y)
From the analysis of the variables above, the value of variable X2 = 0,000 <0,05 is obtained. This means that X2 has a direct significant effect on Y.
3. Analysis of the effect of Motivation variable (Y) on performance (Z)
From the analysis of the variables above, the values obtained for Y = 0,000 <0,05. This means that Y has a significant direct effect on Z.
4. Analysis of the effect of Certification (X1) on performance (Z)
From the analysis of the variables above, the value of variable X1 = 0.318> 0.05 is obtained. This means that X1 does not have a significant direct effect on Z.
5. Analysis of the effect of competency variables (X2) on performance (Z)
From the analysis of the variables above, the value of variable X2 = 0,000 <0,05 is obtained. This means that X2 has a direct significant effect on Z.
6. Analysis of the influence of Certification (X1) through Motivation (Y) on Performance (Z) From the analysis of the variables above, the direct effect given by the variable X1 to Y is -0.064. Whereas the indirect effect given X1 through Y to Z is the multiplication between the value of beta X1 to Y with the beta value Y to Z which is = -0.064 x 0.529 = -0.034. Then the total effect given X1 to Z is = -0.064 + (-0.034) = -0.098. Based on the results of this calculation, it is known that the direct effect value is -0.064 and the indirect effect value is -0.034 which means that the direct effect value is greater than the indirect effect value. These results indicate that directly X1 through Y has an indirect significant influence on Z.
7. Analysis of the influence of competence (X2) through motivation (Y) on performance (Z) From the analysis of the variables above, the direct effect given by variable X2 on Z is 0.645. Whereas the indirect effect given by X2 through Y to Z is the multiplication of the value of beta X2 to Y with the value of beta Y to Z which is = 0.468 x 0.529 = 0.248. Then the total effect given X2 to Z is = 0.645 + 0.248 = 0.893. Based on the results of this calculation, it is known that the direct effect value is 0.468 and the indirect effect value is 0.893, which means that the value of indirect influence is greater than the value of direct influence. This result shows that directly X2 through Y has a significant influence on Z.
Hypothesis testing
Coefficient of Determination (R2)
To find out the magnitude of the coefficient of determination shown by the value of R Square, which can be seen in the table below:
Tabel 11: R Square Z (Performance) Result
Model Summaryb
Model R R Square Adjusted R Square Std. Error of the Estimate
1 0,856a 0,732 0,724 2,003
a. Predictors: (Constant), Motivation (Y), Competency (X2), Sertification (X1) b. Dependent Variable: Performance
From the table above, the value of the determination of keofisien (R Square) is 0.732. This means that the contribution of certification, competence and motivation to performance is 73.2%. While the remaining 26.8% is caused by other factors.
Test Direct and Indirect Effects
The following is a path analysis to examine the relationship between certification and competency to performance and whether the relationship between certification and competency to performance is mediated by motivation with the following figure:
Figure 7: Path Analysis Model
Based on the picture, the path model is proposed based on the theory that the certification has a direct relationship with performance. And then based on the picture, the path model is proposed based on the theory that competence has a direct relationship with performance. However, certification and competence also have an indirect relationship to Performance.
Simultaneous Hypothesis Testing ( F Test)
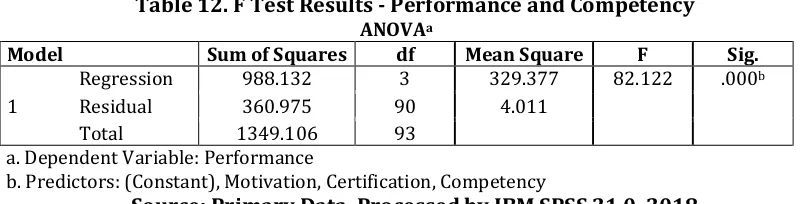
The results of this F test determine the feasibility of a research model. The following are the results of the F Test of research data processing using IBM SPSS 21.0.
Table 12. F Test Results - Performance and Competency
ANOVAa
Model Sum of Squares df Mean Square F Sig.
1
Regression 988.132 3 329.377 82.122 .000b
Residual 360.975 90 4.011
Total 1349.106 93
a. Dependent Variable: Performance
b. Predictors: (Constant), Motivation, Certification, Competency
Source: Primary Data, Processed by IBM SPSS 21.0, 2018
Can be seen from the table above that obtained F count value of 82.122. Furthermore, these results will be compared with the value of F table. The search for F table is df (k; n-k). Value k = number of independent variables = 3, and n = respondent = 94. Then df (k; n-k) = df (3; 94-3) = df (3; 91) = 2.70.
So F count = 82.122> F table = 2.700. Then it can be concluded that the independent variables (certification, competence and motivation) simultaneously influence the performance (dependent variable).
Partial Testing of Hypotheses (t test)
The t test is intended to find out how far the influence of one independent variable (certification, competence, and motivation) individually in explaining the dependent variable (performance). The results of the t test in this study can be seen in table 13 below:
Sertification (X1)
Competency (X2)
Motivation
( Y )
Performance ( Z )
-0,064
0,529
0,645 0,290
Table 13 – Test Result t – Y (motivation)
Coefficientsa
Model
Unstandardized Coefficients
Standardized
Coefficients t Sig. B Std. Error Beta
1
(Constant) 4,069 4,397 0,925 0,357
Certification 0,295 0,090 0,290 3,292 0,001
Competency 0,557 0,105 0,468 5,318 0,000
a. Dependent Variable: Motivation
Source: Primary Data, Processed by IBM SPSS 21.0, 2018
Based on the results of the t test, proof can be made as follows: 1. Effect of Certification on Motivation
Partial influence between certification and motivation is 3.292 with sign. 0.001 <α = 0.05. Sign value. smaller than α = 0.05, indicating the acceptance of the hypothesis which states the certification has a significant positive effect on motivation, meaning that the higher the influence of certification, the higher the motivation of the teachers of State High Schools in the City of Sawahlunto.
2. Effect of Competence on Motivation
Partial influence between competence to motivation 5.318 with sign. 0,000 <α = 0.05. Sign value. smaller than α = 0.05, indicating the acceptance of the hypothesis that competency has a significant positive effect on motivation, meaning that the higher the influence of competency, the higher the motivation of the teachers of State High Schools in Sawahlunto City.
Table 14: Test Results t – Z (performance)
Coefficientsa
Model
Unstandardized Coefficients
Standardized
Coefficients t Sig. B Std. Error Beta
1
(Constant) -5,191 3,599 -1,442 0,153
Sertification (X1)
-0,078 0,077 -0,064 -1,004 0,318
Competency (X2)
0,663 0,098 0,465 6,788 0,000
Motivation (Y) 0,633 0,085 0,529 7,416 0,000
a. Dependent Variable: Performance
Sumber: Data Primer yang diolah, 2018.
Based on the results of the t test, proof can be made as follows: 1.Effects of Certification on Performance
Partial influence between competency and performance is -1.004 with sign. 0.318> α = 0.05. Sign value. smaller α = 0.05, indicating the rejection of the hypothesis which states that the certification has a significant positive effect on performance, meaning that the higher the influence of certification, the lower the performance of teachers of state high schools in the city of Sawahlunto.
2.Effect of Competence on Performance
Partial influence between competence and performance is 6.788 with sign. 0,000 <α = 0.05. Sign value. smaller α = 0.05, indicating that the acceptance of the hypothesis that competency has a significant positive effect on performance means that the higher the competency, the higher the performance of the teachers of state high schools in the city of Sawahlunto.
Partial influence between motivation and performance is 7.416 with sign. 0,000 <α = 0.05. Sign value. smaller α = 0.05, indicating the acceptance of the hypothesis which states that motivation has a significant positive effect on performance, meaning that the higher the motivation, the higher the performance of the teachers of the State High School in the City of Sawahlunto.
CONCLUSIONS AND RECOMMENDATIONS Conclusions
Based on the results of research and data processing that has been done before, some conclusions can be drawn as follows:
1. Certification has a significant effect on the Motivation of State High School Teachers in the City of Sawahlunto. This proves that certification increases the motivation of State High School Teachers in Sawahlunto City.
2. Competence has a significant effect on the Motivation of Public High School Teachers in Sawahlunto City. This proves that competence does not affect the increase in motivation of State High School Teachers in Sawahlunto City.
3. Certification does not have a significant effect on the performance of State High School Teachers in the City of Sawahlunto. This means that certification does not affect the performance improvement of the State High School Teachers in Sawahlunto City.
4. Competence has a significant effect on the performance of State High School Teachers in Sawahlunto City. This means that competence causes an increase in the performance of State High School Teachers in Sawahlunto City.
5. Motivation has a significant effect on the performance of State High School Teachers in the City of Sawahlunto. This proves that the increase in motivation will affect the performance improvement of the State High School Teachers in the City of Sawahlunto. 6. Indirectly Certification through motivation has a significant influence on the performance
of State High School Teachers in Sawahlunto City. It is intended that the increase in performance is not directly affected by certification through the motivation of State High School Teachers in Sawahlunto City.
7. Direct competence through motivation has a significant influence on the performance of State High School Teachers in the City of Sawahlunto. This means that the increase in performance is directly affected by certification through increasing the motivation of State High School Teachers in Sawahlunto City.
Suggestion
Based on the findings and conclusions of the study. For this reason, suggestions are as follows: 1. It is necessary to increase competency which includes technical, social, personality and
professionalism.
2. Increased techniques and process strategies for granting teacher certificates / certifications.
3. Provision of teacher certification must be able to improve the competence of teachers / educators by utilizing additional income / certification to participate in quality
improvement activities, buy books, laptops and others to increase their professional abilities and insight.
4. Giving teacher certification through the administration selection process, written test up to special training is one way to get a competent teacher with his expertise as a professional teacher so as to produce competent students.
5. In order for Teacher Motivation to be consistent towards the better over time, the Government should distribute the certification funds smoothly.
Reference
Fatiah, et al. 2013. “Pengaruh Sertifikasi Guru Dan Motivasi Kerja Guru Terhadap Kinerja Guru SMAN 5 Surakarta”. Jupe UNS. Juli 2013. Vol. 2. No. 1. Hal 71-82
Hasibuan, Malayu. S.P. 2010. Organisasi dan Motivasi. Jakarta: Bumi Aksara.
Hasibuan, Malayu. S.P. 2003, Manajemen Sumber Daya Manusia, Edisi Revisi, Bumi Aksara, Jakarta Jalal. Sais. 2001. Reformasi Pendidikan dalam Konteks Otonomi Daerah. Yogyakarta: Adi Cita.
Jayanti, Anna Dwi. 2018. Sertifikasi, Motivasi, Kompetensi Pengaruhnya Terhadap Kinerja Guru. e – Jurnal Riset ManajemenPRODI MANAJEMEN. Hal 126-137.
Kunandar. 2008. Guru Pofesional Implementasi Kurikulum Tingkat Satuan Pendidikan (KTSP) dan Sukses dalam Sertifikasi Guru. Jakarta: Raja Grafindo Persada, 2008.
Kunandar. 2007. Guru Profesional. Jakarta: PT. Rajagrafindo Persada.
Kanto, Kulasse. 2015. Pengaruh Sertifikasi Terhadap Motivasi Kerja, Kepuasan Kerja & Kinerja Guru BK SMAN. Journal of EST. Volume 1. Nomor 2. September 2015. hal 61-73.
Mulyasa, E. 2003. Kurikulum Berbasis Kompetensi: Konsep, Karakteristik, Implementasi, dan Inovasi. Bandung: Remaja Rosdakarya.
Murwati, Hesti. 2013. Pengaruh Sertifikasi Profesi Guru Terhadap Motivasi Kerja Dan Kinerja Guru Di SMK Negeri Se-Surakarta. Jurnal Pendidikan Bisnis dan Ekonomi (BISE). Vol.1 No. 1. Tahun 2013. Hal 12-21.
Undang-Undang Republik Indonesia Nomor 14 Tahun 2005 tentang Guru dan Dosen. Jakarta: Eka Jaya. Uno, Hamzah B. 2008 Profesi Kependidikan, Jakarta: Bumi Aksara
Zulkifli, Moh et al. 2014. Motivasi Kerja, Sertifikasi, Kesejahteraan Dan Kinerja Guru. Persona, Jurnal Psikologi Indonesia, Mei 2014. Vol. 3. No. 02. hal 148-155.
Wahyudi dan Hadi 2017. Pengaruh Sertifikasi, Motivasi, Kompetensi Terhadap Kinerja Guru Sekolah Dasar Negeri (SDN) di Kecamatan Pakisaji Kabupaten Malang”. e – Jurnal Riset ManajemenPRODI MANAJEMEN. Hal