Latitudinal Variation in
Drosophila melanogaster
Ph.D. Thesis
Sarah Jane Robinson
ProQuest Number: U643109
All rights reserved
INFORMATION TO ALL USERS
The quality of this reproduction is dependent upon the quality of the copy submitted.
In the unlikely event that the author did not send a complete manuscript and there are missing pages, these will be noted. Also, if material had to be removed,
a note will indicate the deletion.
uest.
ProQuest U643109
Published by ProQuest LLC(2015). Copyright of the Dissertation is held by the Author.
All rights reserved.
This work is protected against unauthorized copying under Title 17, United States Code. Microform Edition © ProQuest LLC.
ProQuest LLC
789 East Eisenhower Parkway P.O. Box 1346
Acknowledgements
This PhD was funded by the BBSRC. I would like to thank Professor
Linda Partridge for supervising this project and for her invaluable help and
support, and Kevin Fowler, my second supervisor who also provided support and
advice. Ary Hoffmann and Jan Van ‘t Land provided the fly populations used in
this thesis. All the members of the Partridge group have helped to make my
Ph.D. an enjoyable and valuable experience. In particular I would like to thank
Avis James, Bas Zwaan, Ricardo Azevedo and Stuart Gilchrist for advice on
experimental methods and statistics. I also would like to thank the past and
present occupants of room 522, Wolfson House, for making the office a fun
place to be. Particularly Michael Reeve and Andy Hingle with whom I have
shared the office for many years.
On a personal level, I would like to thank Kate Bay ley and Claire Taylor, my fellow founder members of the Holloway women’s support group and red
wine appreciation society. My family have supported in many ways. I’m
especially grateful to my Dad for his help in translating papers written in French,
and to my Mum for sending me chocolate and listening to me, and also to Rosie
for sharing with me the pain of supporting Sheffield Wednesday.
Finally, I would like to thank Chris Jenner for being himself and for making me
happy.
Abstract
There is widespread latitudinal variation in ectotherms. This latitudinal
variation is often the result of a combination of the evolutionary genetic and
developmental effects of the changing environment. Drosophila melanogaster is
an ideal model organism in which to study this variation. Genetic, latitudinal
dines have been found in a number of traits of Drosophila melanogaster. Body
size, egg size and ovariole number have been found to increase, and development
time to decrease with latitude in more than one continent. Parallel latitudinal
dines in different continents indicate that natural selection is responsible for this
genetic variation. The developmental effects of the environment can act in the
same or opposite direction to the evolutionary effects.
To further investigate latitudinal variation in D. melanogaster, latitudinal variation in starvation resistance, fat content and larval growth efficiency were
studied. Starvation resistance and fat content in South American populations
were found not to vary with latitude. Larval growth efficiency was studied in
both South American and Australian populations, and larvae originating from
high latitude populations were able to convert a fixed amount of food into larger
adult body size. In addition, at lower experimental temperatures, larvae
originating from both high and low latitudes converted food into larger adult size.
An investigation into the genetic basis of the dines in body size in South
America and Australia was performed. Chromosome substitution analysis was
done to establish whether any of the chromosomes had large effects on body
size, and whether these effects differed between the 2 continents. Chromosome 3
was found to have the largest effect on body size in both continents, with the
Table of Contents
1. General Introduction... 8
1.1 Spatial Variation... 8
1.2 Genes and the Environment...10
1.3 Latitudinal Clines... 11
1.4 Genetic Clines in Ectotherms...12
1.4.1 Body Size...13
1.4.2 Growth R ate... 13
1.4.3 Development Time... 14
1.4.4 Growth Efficiency...14
1.4.5 Physiology... 15
1.4.6 Egg S ize...15
1.4.7 Clines in Drosophila... 16
1.4.8 Body Size in Drosophila...17
1.4.9 Development Time in D rosophila... 17
1.4.10 Egg Size in Drosophila...18
1.4.11 Ovariole Number in Drosophila...18
1.4.12 Starvation Resistance and Fat Content in Drosophila... 19
1.4.13 Desiccation Resistance in Drosophila... 20
1.4.14 Physiological Variation in D rosophila... 20
1.4.15 Inversion Frequency in Drosophila...21
1.4.16 Allozyme Frequency in D rosophila...21
1.4.17 Summary of Latitudinal Clines in Drosophila... 22
1.5 Environmental Variation with Latitude... 23
1.6 The Evolutionary Effect of Temperature on Ectotherm s...24
1.6.1 Laboratory Thermal Selection in D rosophila... 24
1.7 Developmental Effect of Temperature in Ectotherms... 25
1.7.1 Body Size... 25
1.7.2 Development Time and Growth R ate...27
1.7.3 Growth Efficiency... 28
1.8 Summary of the Effects of Temperature... 28
1.9 Latitudinal Variation in Drosophila...30
1.10 Outline of Thesis...31
2. General Materials and M ethods...33
2.1 Populations of Drosophila m elanogaster...33
2.1.1 South American Populations...33
2.1.2 Australian Populations...33
2.1.3 Dahomey Population... 34
2.1.4 SM5/bw TM3/TM6 Balancer S to c k ...34
2.2 Rearing M ethods... 37
2.2.1 Culture M edia...37
2.2.2 Stock M aintenance... 39
2.3 General M ethods...40
2.3.1 Egg Collection...40
2.3.2 Standard Density C ulture... 40
2.3.3 Wing Area Measurement... 41
2.4 Statistical Analysis...42
3. Starvation Resistance and Adult Body Composition in a Latitudinal Cline of Drosophila m elanogaster...43
3.1 A bstract... 43
3.2 Introduction...44
3.3 Materials and M ethods... 45
3.3.1 Experimental Measurements...46
3.3.2 Statistical Analysis... 47
3.4.1 Wet Weight, Dry Weight, Water Content, Fat Content and Starvation
Resistance... 48
3.4.2 Relationship Between Fat Content and Starvation Resistance... 55
3.5 Discussion... 57
4. Temperature and Clinal Variation in Larval Growth Efficiency in Drosophila melanogaster...60
4.1 A bstract... 60
4.2 Introduction...61
4.3 Materials and M ethods... 63
4.3.1 Fly Populations...63
4.3.2 Measurement of Larval Growth Efficiency...63
4.3.3 Experimental Groups and Treatments...64
4.3.4 Statistical Analysis... 65
4.4 Results...66
4.4.1 Larval Growth Efficiency M ethod... 66
4.4.2 Larval Growth Efficiency in Clines from Australia and South America 66 4.4.3 Larval Growth Efficiency at Two Temperatures... 67
4.5 Discussion... 78
5. Chromosome Substitution Analysis of Body Size in Two Parallel Latitudinal Clines of Drosophila melanogaster...80
5.1 A bstract...80
5.2 Introduction... 81
5.3 Materials and M ethods...83
5.3.1 Fly Populations... 83
5.3.2 Chromosome Substitution... 83
5.3.3 Wing Area Measurement...88
5.3.4 Statistical Analysis...88
5.4 Results...88
5.5 Discussion... 96
6. Discussion...99
6.1 Latitudinal Variation in Ectotherms...99
6.2 Latitudinal Variation in Drosophila melanogaster... 99
6.3 The Target of Selection...102
6.4 Selective Agents...103
6.5 Developmental Effect of Temperature... 106
6.6 The Genetic Basis of Latitudinal V ariation...107
6.7 Comparing Latitudinal Variation Across Continents... 110
6.8 Further W o rk ... I l l 7. Literature Cited... 113
Tables
Table 2.1 The locations and latitudes of the collection sites of the South
American populations...36
Table 2.2 The locations and latitudes of the collection sites of the Australian populations... 37
Table 3.1 Mean values for (a) wet weight, (b) relative water content, (c) relative
fat content and (d) starvation tim e... 50
Table 3.2 Minimum adequate model analysis of covariance with (a) Wet weight, (b) dry weight, (c) water content, (d) relative water content, (e) fat content, (f)
relative fat content and (g) starvation resistance as dependent variables,
latitude as covariate and sex and density as independent variables... 53
Table 3.3 Minimum adequate multiple regression model with starvation resistance as the dependent variable, latitude and relative fat content as
continuous factors and sex and density as discrete factors... 56
Table 4.1 Least squares regression analysis of variance of wing area of food restricted flies among South American populations... 72
Table 4.2 Analysis of variance of wing area of food restricted Australian
populations with replicate populations nested within latitude... 73
Table 4.3 Analysis of variance of wing area of food restricted Australian and South American populations at 18°C and 25° C ... 76
Table 5.1 Five-way analysis of variance of wing area with chromosomes 1, 2,
Figures
Figure 2.1 The landmarks on the wing that are used to measure wing area 41
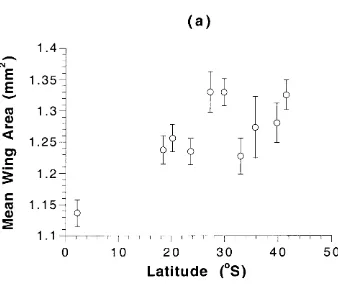
Figure 4.1 Mean wing area and 95% confidence intervals for adult flies
produced from food-restricted larvae...68
Figure 4.2 Mean wing area and 95% confidence intervals of food restricted flies against temperature... 74
Figure 5.1 The scheme of crosses required to insert one big (B) chromosome into the small (S) background for each of the three chrom osom es... 85
1. General Introduction
1.1 Spatial Variation
The phenotype of most species varies geographically. This spatial
variation occurs as a result of the developmental and evolutionary effects of the
environment that the organism inhabits. Organisms respond to the environmental
conditions that they occupy and their phenotype adjusts accordingly, either as a
short-term or long-term measure. Spatial variation within a species can be the
result of phenotypic plasticity or genetic variation. Phenotypic plasticity is purely
the effect of the organism’s environment on the expression of its phenotype
(Scheiner 1993).
An organism’s response to the environment can occur on 3 different time scales. The first 2 levels of response occur within the lifetime of an individual.
The immediate environment that an organism occupies can elicit an immediate
response in a trait. Traits which can respond as quickly as a change in the
environment can occur are known as labile (Scheiner 1993). The second level of
response occurs over a slightly longer time scale, but still within an organism’s
lifetime. This response can take from minutes to months to occur (Huey and
Berrigan 1996), it may be reversible or non-reversible. For example,
developmental temperature has an effect on adult body size in ectotherms. If the
temperature is changed after the critical developmental period the size will not
change. Thirdly, spatial variation in the environment can persist over a number of
generations. This type of spatial variation can lead to a genetic, evolutionary
response.
Examples of these 3 types of response can be provided by the ways in
An acute (labile) response occurs when an ectotherm experiences a heat shock.
When Drosophila are exposed to a high temperature for a short period they
produce an immediate response by producing heat shock proteins to counteract
the effect of the high temperatures (Lindquist 1986). The second level of
response can be illustrated by physiological acclimation caused by changing
temperature. When fish are exposed to cold temperatures, the mitochondrial
volume density of their muscle increases (Guderley and St Pierre 1996). This
process occurs as the fish acclimatise to colder temperatures. The third level of
response, at the evolutionary genetic level, can be illustrated by metabolic rates in
flies that have evolved at different temperatures. When measured at the same
temperature, the metabolic rate of Drosophila melanogaster that have evolved at
low temperature was higher than that of flies which had evolved at high
temperature (Berrigan and Partridge 1997).
Although spatial variation in phenotype may be the result of the response of organisms to spatial environmental variation, this phenotypic variation is not
necessarily adaptive. Although adaptive explanations can be found for many of
these responses to changing environment, these explanations must be tested
thoroughly before it can be assumed that they are correct. Spatial genetic
variation may be the result of adaptation due to natural selection but it could also
be due to genetic drift or migration and gene flow (Slatkin 1987). If genetic
variation is adaptive, it is likely that it will be replicated under similar conditions,
either elsewhere in the world, or in the laboratory. It can be more complex to
determine whether short-term responses to environmental variation are adaptive
(Guderley and St Pierre 1996; Huey and Berrigan 1996; Huey et al. 1999). It
must be determined whether these responses result in an increase in fitness that
would not otherwise be present.
Spatial variation of the environment can occur on a narrow or a broad
scale. An example of narrow scale variation, is variation in local habitat. For
which is not in shade. An example of broad-scale environmental variation is
variation with latitude. The environment varies greatly with latitude; this results in
a large amount of variation in organisms and the characteristics that they exhibit.
Latitudinal variation is a good example of spatial variation and the study of
latitudinal variation provides an excellent opportunity to study evolution in action
and to try to uncover the mechanisms by which evolution operates.
1.2 Genes and the Environment
The spatial variation in phenotype which many species exhibit is
determined by both their genotype and their environment. The extent to which this variation is genetic can be determined by common garden experiments where
organisms from different populations are reared in a common environment, or by
reciprocal transplant experiments where organisms are transplanted into opposite
environments (Conover and Schultz 1995).
The association between genetic and environmental variation can follow 3
patterns (Conover and Schultz 1995). Firstly, there may be no covariance between genotype and phenotype. The genetic variation is unlikely to be a
product of the environmental conditions. The second type of relationship
between genes and environment is termed co-gradient variation. In co-gradient
variation, the genetic effect on the phenotype is in the same direction as the
environmental effect. An example of co-gradient variation is body size variation
with latitude in Drosophila, thought to be caused by low temperatures at high
latitudes. Drosophila melanogaster are larger at high latitudes in the wild, they
are genetically larger and a low developmental temperature also acts to make them
larger (James et al. 1997). The genetic effect acts to reinforce the effect of the
environment on the phenotype. The third pattern of environmental and genetic
the effect of the environment on the phenotype. Examples of counter-gradient
variation are quite widespread and there may be many more examples as yet
undiscovered because the effect of counter-gradient variation can be to produce
little phenotypic variation with large amounts of environmental variation.
Examples of counter-gradient variation in growth rate occur in the Atlantic
silverside, the striped bass and the wood frog (Berven 1982b; Conover and
Present 1990; Conover et al. 1997). In the Atlantic silverside, larval growth rate
is genetically faster in high latitude populations but the low environmental
temperature at high latitudes acts to slow growth rate. Growing seasons are
shorter at high latitudes so there is also less time to reach the required size. A
large size at the end of the growing season is important to survive the winter
(Schultz et al. 1998). So at high latitudes fish are selected to grow faster in a
shorter period of time in order to achieve a large size before the winter (Conover
and Present 1990; Conover et al. 1997). Wood frog larvae originating from higher altitudes grow faster, they are able to reach metamorphosis faster and at a
larger size. This counteracts the developmental effects of temperature at high
altitude which slow the rate of growth (Berven 1982b).
1.3 Latitudinal Clines
The term d in e was first proposed by Huxley in 1938 (Huxley 1938) to
mean “a gradation in measurable characters”. These gradations in measurable
characters have been much studied since the term was first introduced. Endler
defines a d ine as "a geographic gradient in a measurable character, or gradient in
gene, genotype, or phenotype frequency" (Endler 1977). In his book (Endler
1977), Endler concentrates mainly on those dines that occur in the hybrid zones
between species. These often occur in quite small geographic areas and may be
However, there are also many dines in characters that are not due to
hybrid zones and are instead due to large-scale geographic change and the way
that an organism adapts to occupy the environmental conditions that occur
throughout its range. Latitude and altitude both have a large effect on the
environmental conditions that an organism will encounter. Many species occupy
a large geographic range and are affected by the environmental changes that
occur across latitudes. The effect of a change in latitude (or altitude) and the
accompanying environmental change can be purely a developmental reaction to
the environment or a genetic adaptation due to natural selection exerted by
climatic conditions. Genetic changes over a geographic range could also be
caused by random genetic drift.
Latitudinal dines in various characters have been found in ectotherms
from many parts of the world. These dines may be the result of genetic or
environmental responses or a combination of the two. In order to demonstrate
the genetic basis of a dine the organisms must be removed from their natural environment and reared under standard laboratory conditions, a 'common garden'
experiment. If the variation between populations persists even under standard
conditions then it can be inferred that there is a genetic component to the dine.
1.4 Genetic Clines in Ectotherms
Geographic variation in ectotherms has been widely studied. Clines can
be genetic or can be caused by the developmental effect of environmental
variation. Here I discuss genetic dines; the genetic nature of the dines in the
studies mentioned was confirmed by repeating the measurements after a number
of generations of laboratory culture, or by performing reciprocal transplantation
experiments. The widespread occurrence of dines related to latitude in ectotherm
1.4.1 Body Size
Studies of clinal variation in ectotherms have commonly focused on body
size and other morphological traits. Latitudinal dines in body size characters
have been found in a number of ectotherm species. Body size variation has been
found in Apis mellifem (honey bee) (Alpatov 1929), Musca domestica (house
fly) (Bryant 1977), Mynneleon immaculatus (ant lion) (Arnett and Gotelli 1999)
Scottolana canadensis (a crustacean copepod) (Lonsdale and Levinton 1985) and
Littorina obtusata (an intertidal snail) (Trussell 2000). In these species larger
body size occurs at high latitudes. In addition to clinal variation with latitude, altitudinal dines also occur in ectotherms. The frogs Rana climitans and Rana
sylvatica exhibit larger larval body size at both high latitudes and high altitudes
(Berven et al. 1979; Berven 1982b; Berven and Gill 1983; Riba and Berven
1991).
1.4.2 Growth Rate
Latitudinal dines in a related trait to body size, growth rate, have also been
found in ectotherm species. The rate at which an animal grows can have a
significant effect on its ability to survive. Faster growth could be beneficial as it
allows the animal to reach maturity quicker. However, in birds and mammals
where males grow faster than females, males have higher juvenile mortality rate
particularly when food resources are limited (Clutton-Brock et al. 1985). This
suggests that high growth rates may be a disadvantage when food is scarce.
Species which exhibit clinal variation in growth rate are the ant lion, Mynneleon
(striped bass) (Conover et al. 1997), Fundulus heteroclitus (mummichog)
(Schultz et al. 1996), and Menidia menidia (Atlantic silverside) (Conover and
Present 1990). Similarly to body size, growth rate is seen to increase with
increasing latitude. The growth rate of the frogs Rana climitans and Rana
sylvatica is higher at both high latitudes and high altitudes (Berven et al. 1979;
Berven 1982b; Berven and Gill 1983; Riha and Berven 1991).
1.4.3 Development Time
Development time is also a trait that is highly significant in terms of the
ability of an animal to survive in its surroundings. An animal with a faster
development time will reach maturity and be able to produce its own offspring
sooner than one with a slow development time. However, selection for decreased development time is correlated with a decrease in pre-adult survival in Drosophila
(Chippindale et al. 1997). Development time in the ant lion has been found to
decrease with latitude of origin (Arnett and Gotelli 1999). Ant lions originating
from high latitudes develop quicker to reach a larger adult size than those
originating from low latitudes. Similarly, the frogs Rana climitans and Rana
sylvatica develop faster at both high latitudes and high altitudes (Berven et al.
1979; Berven 1982b; Berven and Gill 1983; Riha and Berven 1991).
1.4.4 Growth Efficiency
How efficiently an animal can make use of the food resources available to
it in terms of growth can have a large impact on its fitness. The ability to grow
efficiently where limited resources are available can provide an animal with a
great advantage over its fellows. Efficiency of growth in ectotherms has most
silverside increases with latitude of origin (Present and Conover 1992). When
provided with excess food, a fish which has evolved at high latitude can grow
more efficiently than one which has evolved at low latitude, (Present and Conover
1992; Billerbeck et al. 2000). However, when the fish were given limited food
there was no difference in the growth efficiency of the populations (Billerbeck et
al. 2000). The increase in efficiency with latitude can in part explain the
difference in growth rate with latitude (Conover and Present 1990), however food
consumption also increases with latitude (Present and Conover 1992; Billerbeck
et al. 2000).
1.4.5 Physiology
All the traits that have been discussed above are affected by the
physiology of the organism. A greater understanding of the underlying
physiology of these traits would help us to understand the selective forces behind
the clinal variation. Unfortunately, although differences in ectotherm physiology with latitude have been observed, only a small number of ‘common garden’
studies have been performed (see Garland and Adolph 1991 for review). In the
Atlantic silverside, routine metabolism (Oj consumption) varies with latitude of
origin when measured at high temperature. Respiration is faster in a population
originating from high latitude. (Billerbeck et al. 2000). However at 2 lower
temperatures, no difference was found between populations originating from high
and low latitudes.
1.4.6 Egg Size
exhibit egg size variation include the water strider Aquarius remigis,
(Blanckenhom and Fairbaim 1995) and the wood frog, Rana sylvatica (Berven
1982aX
1.4.7 Clines in
Drosophila
The ectotherm in which clinal variation has been most widely studied is
Drosophila. Drosophila are found throughout the world and exist at a wide-
range of latitudes and altitudes. In Drosophila, clinal variation occurs over a very
broad geographic range and in a number of characteristics. The widespread
occurrence of such variation in Drosophila species and particularly in
Drosophila melanogaster makes this a particularly appropriate model organism for the study of such a phenomenon. The existence of dines in different
continents allows for comparison between continents and provides evidence for
the adaptive nature of the dines. Latitudinal variation has been found in more
than one continent in Drosophila characters such as body size, development time,
egg size and ovariole number and also to some extent in starvation resistance and
fat content. Clinal variation has also been found at the molecular level in a
number of allozyme loci and in a number of chromosomal inversions. Much of
this variation persists in laboratory studies when populations from different
latitudes are kept in a common environment and can therefore be considered to be
genetic. The fact that these genetic dines are repeated in more than one continent
indicates that they are the result of an adaptation due to natural selection rather
than genetic drift.
The suite of traits that are seen to vary with latitude, could be the result of
pleiotropy, with selection acting on one trait and other traits being affected as a
consequence. Alternately, selection could be acting on individual traits
to understand what the target or targets of selection may be. In Chapter 5 , 1
assess the chromosomal contribution to latitudinal variation in body size, this is a
first step towards identifying the genes involved.
1.4.8 Body Size in
Drosophila
A large number of geographic dines in body size in a number of
Drosophila species have been found. Latitudinal variation in body size has been
found in D. robusta (Stalker and Carson 1947), D. simulans (David and
Bocquet 1975b; Watada et al. 1986; Capy et al. 1993), D. subobscura (Misra
and Reeve 1964; Huey et al. 2000), D. kikkawai (Karan et al. 1998c; Parkash et
al. 1999), D. obscura (Pegueroles et al. 1995), and also in D. melanogaster. In
D. melanogaster, latitudinal variation in body size has been found throughout the
geographic range of the species. Latitudinal dines in body size have been found
in North America (Coyne and Beecham 1987), Eastern Europe, the Caucasus and
Central Asia (Imasheva et al. 1993), Australia (James et al. 1995), South America
(V an't Land et al. 1999), France and Africa (David and Bocquet 1975b) and
Japan (Watada et al. 1986). In all these case, individuals that evolve at higher
latitudes achieve a larger adult body size than those that evolve at lower latitudes.
In contrast to these findings a nonmonotonic d in e in body size in D.
melanogaster from North America has also been seen (Long and Singh 1995),
with larger flies found at middle latitudes and smaller flies at high and low
latitudes.
1.4.9 Development Time in
Drosophila
growth occurred at a constant rate, then it would be expected that it would take longer for a larger adult fly to develop. In laboratory size selection experiments,
an increase in body size is correlated with an increase in development time
(Partridge and Fowler 1993; Partridge et al. 1999). However, this is not the case
in latitudinal dines of Drosophila. Development time has been studied in D.
melanogaster originating from both Australia (James and Partridge 1995) and
South America (V an't Land et al. 1999). Development time varies with latitude,
with flies originating from high latitudes developing faster. Drosophila
melanogaster that evolve at higher latitudes are therefore able to reach a larger
adult size in a shorter time.
1.4.10 Egg Size in
Drosophila
Egg size is an important life-history character because it reflects the
degree of maternal investment in an individual and is associated with the fitness
of the offspring (for review see Azevedo et al. 1997). Egg size has been found to vary with latitude in D. melanogaster from both South America and Australia
with larger eggs being produced by individuals from higher latitudes (Azevedo et
al. 1996).
1.4.11 Ovariole Number in
Drosophila
Ovariole number is an important life-history characteristic related to
fitness in Drosophila. Ovariole number is related to the maximum daily rate of
egg laying in females, although the relationship between rate of egg laying and
ovariole number is not linear (David 1970; Bouletreau-Merle et al. 1982).
Latitudinal dines in ovariole number in D. melanogaster from Australia, Europe,
and Bocquet 1975b; Watada et al. 1986; Azevedo et al. 1996). Clines in ovariole
number in D. simulans in Europe, Africa and America (David and Bocquet
1975b; Watada et al. 1986; Capy et al. 1993) and D. kikkawai from India have
also been found (Karan et al. 1998c; Parkash et al. 1998). Larger numbers of
ovarioles are found in populations originating from high latitudes.
1.4.12 Starvation Resistance and Fat Content in
Drosophila
In addition to variation in morphological and life history traits, some
evidence for latitudinal variation has also been found in traits related to
environmental stress such as starvation resistance. Starvation resistance is
strongly correlated with fat content in Drosophila (David et al. 1975; Zwaan et al. 1991; Zwaan et al. 1995b; Zwaan et al. 1995a), although variation in metabolic
rate can affect this correlation (Hoffmann and Parsons 1989).
Little research has been performed on latitudinal variation in starvation
and fat content in ectotherm species other than Drosophila. Latitudinal dines in
starvation resistance have been found in Drosophila melanogaster, D.
ananassae, D. kikkawai and Zaprionus indianus in India, with higher starvation
resistance occurring at lower latitudes (Karan et al. 1998a; Karan and Parkash
1998). Other studies in India have also found latitudinal trends in starvation
resistance in smaller numbers of populations of Drosophila melanogaster
(Shamina et al. 1993), D. kikkawai (Parkash and Vandna 1994) D. bipectinata
and D. malerkotliana (Parkash et al. 1994). Although some inter-population
differences in starvation resistance have been found in other countries (e.g. Da
Lage et al. 1990), a d in e in starvation resistance has only been found in India
1.4.13 Desiccation Resistance in
Drosophila
Similarly to starvation resistance, desiccation resistance is associated with
environmental stress. Desiccation resistance has been studied in many of the
same populations and species of Drosophila as starvation resistance (Shamina et
al. 1993; Parkash et al. 1994; Parkash and Vandna 1994; Karan et al. 1998a;
Karan and Parkash 1998). Clines in desiccation resistance are in the opposite
direction to those in starvation resistance. While starvation resistance in India
decreases with increasing latitude, desiccation resistance increases with increasing
latitude. Like starvation resistance, dines in desiccation resistance have so far
only been found in India.
1.4.14 Physiological Variation in
Drosophila
Accompanying the latitudinal variation in morphological and fitness-
related traits in Drosophila some physiological changes would be expected.
Studies of physiological variation with latitude in Drosophila concentrate on metabolic rate variation. When measured at high temperatures, metabolic rate in
Drosophila melanogaster has been found to be higher in high latitude
populations (Giesel et al. 1991; Berrigan and Partridge 1997). In addition, the
metabolic rate of high latitude populations is more sensitive to increasing
temperature (Giesel et al. 1991). The higher metabolic rates in high latitude
populations could go some way to explaining differences in growth rate and
efficiency with latitude, if growth rate and efficiency are a function of metabolic
rate. However differences in growth rate between populations have not been
1.4.15 Inversion Frequency in
Drosophila
Drosophila melanogaster exhibits a high degree of polymorphism for
chromosome inversions (Mourad and Mallah 1960; Watanabe 1967; Singh and
Das 1990). A number of these inversions are found in all the main continents,
and dines in their frequency have been found throughout the world. The
repeatability of these dines in different continents suggests that they may have an
adaptive value.
One inversion that has been widely studied is In(2L)t. The frequency of
In(2L)t has generally been found to be higher further away from the equator, in
studies performed in Japan (Inoue and Watanabe 1979, Inoue, 1984 #37),
Australasia (Knibb et al. 1981), India (Singh and Das 1990) and South America
(V an't Land et al. 2000). However, In(2L)t frequency in the USA has been
found to be higher in more northerly populations (Stalker 1976) and in southern populations (Mettler et al. 1977). It does appear that there is a world-wide din e
in In(2L)t frequency but the results seem less conclusive than for the phenotypic
traits. After a relatively short period of time under laboratory conditions
populations lose their inversions (Inoue 1979) which suggest that these
inversions may not be related to the clinal genetic variation that is maintained even
after long periods of laboratory culture.
1.4.16 Allozyme Frequency in
Drosophila
Clines in the frequency of a number of allozymes, in particular Adh and
a-G pdh have been found (Vigue and Johnson 1973; Oakeshott et al. 1982).
There is significant linkage disequilibrium between these loci and the In(2L)t
inversion (Langley et al. 1974; Mukai et al. 1974; Alahiotis et al. 1976; Watanabe
evidence that the dines in inversion and allozyme frequencies are linked (Voelker
et al. 1978; Oakeshott et al. 1982; Knibb 1983), the inversion dines do not
always account for the whole of the allozyme din e (Voelker et al. 1978; but see
Knibb 1983).
1.4.17 Summary of Latitudinal Clines in
Drosophila
As has been described above, a large number of characters in Drosophila
are affected by latitude. The most striking factor among this latitudinal variation
is that the flies that evolve at higher latitudes appear to be at an unconditional
advantage. High latitude flies are larger, develop faster, lay larger eggs and have
more ovarioles. All these traits would be advantageous to Drosophila living at
any latitude, and it would therefore be expected that if selection were not acting to
prevent the evolution of these characters then they would evolve in low latitude populations as well. There must therefore be a trade-off occurring. Although
dines in Drosophila have been studied extensively, not a great deal of evidence
for negative fitness components related to high latitude populations has been
found. James and Partridge (James and Partridge 1998) studied competitive
ability in a latitudinal d ine of Drosophila melanogaster. They found no
differences in competitive ability with latitude, but the body size of the high
latitude populations was found to be more sensitive to increases in density and
temperature and the combined effects of temperature and density. The high larval
densities used in the competition experiments led to relatively high rates of
survival. If higher densities were used, latitudinal differences in competitive
abilities might be revealed. It would appear that the efficient growth of high
latitude populations is adversely affected by stressful conditions of high density
and temperature. If Drosophila at low latitudes in the wild experience high
the din e with latitude. More information about conditions experienced by
Drosophila in the wild would be helpful in determining whether this is the case.
This may not be the sole reason for maintenance of the dine. There may be other
factors, including behavioural differences, which are also involved in maintaining
this dine. Establishing whether competition levels in the wild vary with latitude
and the search for other factors which maintain the d in e is a challenge for the
future and will increase the understanding of latitudinal variation in Drosophila
greatly.
1.5 Environmental Variation with Latitude
The genetic variation with latitude described above is an adaptation to environmental variation. It is not entirely clear what the main target of selection is
or what the selective agent is. There are many environmental factors which vary
with latitude, these include, temperature, humidity, rainfall, availability of food resources, levels of competition, day length, number of generations per breeding
season and impact of biological enemies.
There is strong evidence that temperature might have a significant role in
the evolution of latitudinal variation because in nature, in addition to variation with
latitude, similar variation is also seen with altitude and with season (Stalker and
Carson 1948; Stalker and Carson 1949; Tantawy 1964; Berven 1982b).
Temperature is highly correlated with altitude and season as well as with latitude,
and so temperature does appear to be a prime candidate for the selective agent.
Temperature is also known to have a large effect on the development of
ectotherms (Atkinson 1994).
In order to establish which of these factors are responsible for latitudinal
variation, that factor must be manipulated independently of the other factors.
experiments using temperature as the varying factor have been performed widely
and have produced evidence that evolution at different temperatures has a large
effect on a number of traits.
1.6 The Evolutionary Effect of Temperature on
Ectotherms
There is evidence that temperature may be a major selective force in the
evolution of latitudinal variation in ectotherms. In order to test this hypothesis,
ectotherms must be allowed to evolve at different temperatures with all other
factors controlled. Laboratory thermal selection experiments are one way to do
this. Animals are kept under controlled temperature conditions for a large
number of generations. Laboratory thermal selection experiments on ectotherms
have most commonly been performed on Drosophila species.
1.6.1 Laboratory Thermal Selection in
Drosophila
The effect of laboratory thermal selection is very similar to that seen in
latitudinal dines. Drosophila melanogaster and Drosophila pseudoobscura
increase in size when adapted to low temperature in the laboratory (Anderson
1966; Cavicchi et al. 1985; Partridge et al. 1994a). Replicate selection lines were
used in order to confirm that differences between lines were due to natural
selection and not genetic drift. In addition to these replicated studies, an increase
in size in low temperature evolved Drosophila willistoni was found in an
unreplicated study (Powell 1974). Accompanying the increase in body size in
low temperature evolved populations of D. melanogaster and D. pseudoobscura
and Partridge 1995), so flies can grow to a larger size in a shorter time. Egg size
has also been seen to increase in low temperature adapted populations of D.
melanogaster (Azevedo et al. 1996). All the traits mentioned above vary in the
same way with laboratory thermal selection as they do in natural geographic
variation. This suggests that temperature is likely to have a major involvement in
the evolutionary response to latitudinal variation. In addition to these factors,
larval growth efficiency is also increased in low temperature selected populations
of D. melanogaster (Neat et al. 1995). Larvae from populations that have
evolved at low temperature can produce a larger fly from a given amount of food
than can high-temperature-evolved larvae. Larval growth efficiency in latitudinal
dines is discussed in Chapter 4.
1,7 Developmental Effect of Temperature in Ectotherms
In addition to the evolutionary effects of temperature, the temperature at
which an ectotherm is reared has very significant effects on all aspects of its life
cycle. Organisms exhibit a wide range of phenotypes when reared in different environments. This variation in phenotype depending on the environment is
called phenotypic plasticity. Developmental temperature has a large effect on the
phenotype that an organism exhibits.
1.7.1 Body Size
Body size is a character that is much related to many aspects of fitness in
ectotherms. The temperature at which an organism develops can have a
significant effect on its size and ectotherm size tends to increase at lower
studied the effect of developmental temperature on 17 species, including a
number of species of Drosophila, the toad Bufo boreas and the frog Rana
sylvatica. It was found that 75% of the species studied increased in body size at
lower rearing temperatures. The comprehensive review of Atkinson (Atkinson
1994) studied evidence of temperature effects on body size from 109 studies of
ectotherms, plants and protists. Over 80% of the organisms within this study
showed a significant reduction in size with increasing temperature.
The body size of species of Drosophila is affected by developmental
temperature. Drosophila melanogaster and Zaprionus indianus increase in
body size with decreasing temperature (David et al. 1994; Karan et al. 1998b;
Karan et al. 1999a; Karan et al. 1999b). In both these species body size reaches
a maximum with decreasing temperature and then begins to decrease again as
temperature is reduced further. The maximum size of Drosophila melanogaster
is reached at around 17°C, but varies depending on the specific trait measured as
an index of size.
An increase in body size with decreasing temperature appears to be very
widespread in ectotherms. This is a similar pattern to that which has been found
in endotherms. Bergmann’s rule (Bergmann 1847) states that in warm-blooded
animals, decreasing temperature leads to a increased body size and therefore a
lower relative surface area which will allow less heat loss. Larger warm-blooded animals are therefore better equipped to conserve heat than smaller animals.
Bergmann’s rule as applied to endotherms is somewhat controversial (Geist
1990; Paterson 1990). Bergmann’s explanation for size variation can also be
questioned in ectotherms. Small ectotherms such as Drosophila, are not able to
thermoregulate, they take on the temperature of their surroundings and thus the
explanation of heat-loss avoidance cannot be applied to Drosophila (Stevenson
1985).
There is evidence that the increase in body size in ectotherms with
found that cell size increased with increasing rearing temperature in the nematode
Caenorabditis elegans and in fish (hybrids of Oreochromis) (Van Voorhies
1996; but see Partridge and Coyne 1997). In Drosophila melanogaster, the
developmental body size response to temperature is caused by an increase in cell
size (Robertson 1959; Delcour and Lints 1966; Cavicchi et al. 1985; Partridge et
al. 1994b; Partridge et al. 1994a; De Moed et al. 1997). It has yet to be
established what mechanisms underlie this developmental response to
temperature.
1.7.2 Development Time and Growth Rate
In ectotherms as a general rule, development time increases and growth
rate decreases as developmental temperature decreases. In Atkinson’s review of body size and temperature, growth rates were studied in a number of species. At
low temperature ectotherms reach a larger adult size but take longer to achieve
that size (Atkinson 1994). Growth rate has been shown to be slowed with
decreasing temperature in a number of ectotherm species including Fundulus
heteroclitus, Morone saxtilis, Menidia menidia and Rana sylvatica (Conover and
Present 1990; Riha and Berven 1991; Schultz et al. 1996; Conover et al. 1997).
Similarly, development time has been shown to increase with decreasing
temperature in a large number of ectotherm species including Drosophila
melanogaster, Sepsis cynipsea and Scathophaga stercoraria (Schultz et al.
1996; James et al. 1997; Blanckenhom 1999). Development at low temperatures
1.7.3 Growth Efficiency
There has not been a great deal of work into what factors might underlie
the developmental response to temperature in ectotherms. Both body size and
development time are increased at lower temperatures - the animal becomes
larger but takes longer to do it. If colder temperature caused an increase in the
efficiency of growth this could allow a larger size to be achieved at low
temperatures. In the Atlantic silverside, efficiency of growth increases at low
temperatures (Present and Conover 1992). However, larval growth efficiency in
Drosophila has been seen to decrease at low temperatures (Neat et al. 1995).
Larval growth efficiency in Drosophila is discussed more fully in Chapter 4.
1.8 Summary of the Effects of Temperature
Temperature has a significant effect on many aspects of an ectotherm’s
life, both in terms of evolution and development. The strong similarities between the evolutionary response to temperature and the evolutionary response to latitude
suggest that temperature plays a major role in the evolution of latitudinal
variation. The developmental effect of temperature may be one reason why an
evolutionary response to temperature occurs. The evolutionary response to
temperature has often been seen to be the opposite of the developmental response
as in counter-gradient variation (Conover and Schultz 1995). The effect of
developmental temperature can also occur in the same direction as the effect of
evolutionary temperature. An example of this is Drosophila body size which
increases with both low developmental temperature and low evolutionary
temperature (Partridge et al. 1994a). The plastic response of ectotherm
plasticity is the result of environmental conditions, the extent and form of the
plastic response to the environment shows genetic variation and can evolve, and
may or may not be adaptive (Scheiner et al. 1991; Scheiner and Lyman 1991;
Scheiner 1993).
Determining whether or not plasticity is an adaptation is not simple
(Gotthard and Nylin 1995). In order for plasticity to be demonstrated to be an
adaptation it must first be shown to have a genetic basis. It must also be shown
to confer an advantage to the organism that has the plastic genotype. This can be
done by using transplantation experiments. Individuals adapted to specific
environments can be transferred to alternative environments and, if the different
phenotypes produced by the same genotypes are shown to have the highest
fitness in their own environment, this indicates that the plasticity is adaptive. An
example of adaptive plasticity has been seen in Atlantic silverside (Scheiner and Lyman 1989; Conover and Present 1990), where growth rate in high latitude
populations is affected more by temperature than it is in low latitude populations. The adaptive nature of this variation was inferred from predictions based on the
environmental conditions experienced by the fish in the wild and was confirmed
by laboratory experiments. A similar example is found in frogs, where tadpoles
from high altitudes grow faster in a cold environment and those from low altitudes grow faster in a warmer environment. The adaptive nature of this
variation was demonstrated by reciprocal transplant experiments (Berven et al.
1979; Berven and Gill 1983).
Phenotypic plasticity of body size in response to temperature occurs in a
number of species of Drosophila (e.g. David et al. 1994; David et al. 1997;
Karan et al. 1998b; Karan et al. 1999a). Plasticity in Drosophila melanogaster
can be selected for in artificial selection experiments, and has been demonstrated
to be heritable (Scheiner and Lyman 1989; Scheiner and Lyman 1991).
However, it is not clear whether plasticity evolves as an adaptation to
selection experiments have shown no evolutionary response in levels of plasticity
of body size with temperature (Partridge et al. 1994a). Similarly, no latitudinal
differences in plasticity were found in a latitudinal d in e of Drosophila
melanogaster (James et al. 1997). Plasticity in Drosophila may be adaptive but
the level of plasticity does not evolve as a result of temperature, or latitude.
Levels of plasticity may respond to fluctuating thermal environment, with higher
levels of plasticity occurring in more variable environments. However, laboratory
studies have not so far shown any changes in phenotypic plasticity of body size
and larval development time in Drosophila that had evolved in fluctuating thermal
environments (M. Reeve, personal communication).
1.9 Latitudinal Variation in
Drosophila
All ectotherms seem to evolve in response to their environment and
particularly in response to temperature. A greater understanding of the
mechanisms by which this adaptation occurs will give us further insight into how
and why this variation occurs. It is clear that spatial variation in ectotherms is due
to a combination of developmental and genetic effects resulting from variation in
the environmental conditions that the animals encounter. Developmental and
genetic effects can act in the same direction or can oppose each other. In
addition, the many different environmental factors the animals encounter may
combine or interact to produce differing phenotypes and genotypes. In
particular, temperature is known to have a significant effect on many ectotherms,
both developmentally and evolutionarily. Understanding the trade-offs at work in
adaptation to life in different environments will reveal what physiological factors
are of fundamental importance to the lives of these animals.
The existence of world-wide dines in Drosophila melanogaster make it
Studying geographic variation in Drosophila will lead to a greater understanding
of geographic variation and its similarities and differences between continents. A
wider understanding of geographic variation in Drosophila will provide
indications to the basis of geographic variation in other ectotherm species.
1.10 Outline of Thesis
This thesis considers a number of aspects of latitudinal variation in
Drosophila melanogaster populations originating from South America and
Australia. I have tried to increase the understanding of the range of traits that
vary with latitude world-wide and the underlying basis of the variation in these traits.
In Chapter 3 I assessed whether latitudinal variation in starvation
resistance and fat content exists in South American populations of Drosophila
melanogaster which have previously been found to exhibit latitudinal variation in a number of other traits. Latitudinal variation in starvation resistance has
previously only been found in India, and my results will help to establish whether
starvation resistance and fat content can be considered to be among the suite of
traits that vary with latitude throughout the world.
In Chapter 4 1 assessed larval growth efficiency in populations of
Drosophila melanogaster originating from both South America and Australia.
Latitudinal dines in body size and development time have previously been found
in these populations and variation in efficiency of growth could be the reason for
this variation. In addition to studying the genetic latitudinal variation of larval
growth efficiency, I also studied the developmental effects of temperature on
larval growth efficiency in flies from the 2 continents.
In Chapter 5 I assessed the chromosomal contribution to the latitudinal
has attempted to uncover the genetic basis of latitudinal variation in this way by
studying both sexes of flies in 2 independent dines from separate continents. I
was able to compare the chromosomal basis of genetic latitudinal variation in
body size between continents, and assess whether selection and the response to
selection might be occurring in the same or in different ways in the separate
2. General Materials and Methods
2.1 Populations of
Drosophila melanogaster
2.1.1 South American Populations (Chapters 3, 4 & 5)
The 10 South American populations were collected in 1995 by Jan Van ‘t
Land and Pim Van Putten (University of Groningen, The Netherlands) along a
latitudinal range from 2.22°S to 41.5 °S (Table 2.1) In order to standardise for
factors other than latitude, the collection sites were chosen to be at similar
longitudes, and altitudes and similar distances from the sea. The longitudes of the collection sites varied between 70.17°W and 79.9°W and with the exception
of Linares (140m) and Copiapo (350m) the altitude of the collection sites was less than 100m. The populations have been maintained since collection in bottle
culture at 25°C. These flies have been found to exhibit latitudinal variation in
body size, development time and egg size when reared under standard laboratory
conditions (Azevedo et al. 1996; Van 't Land et al. 1999).
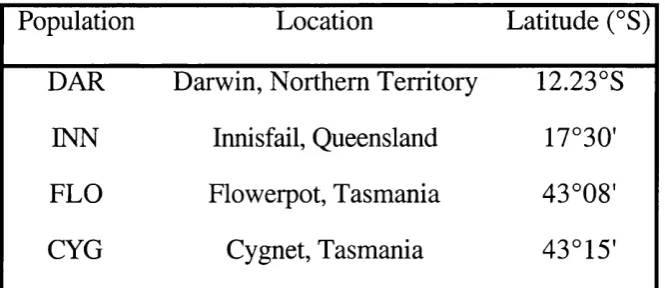
2.1.2 Australian Populations (Chapters 4 & 5)
The 4 Australian populations were collected in early 1997 from sites in
Tasmania, Queensland and the Northern Territory. The Tasmania and
Queensland populations were collected by Ary Hoffmann (La Trobe University,
Australia) and the Northern Territory population was collected by Linda
shown in Table 2.2. As with the South American populations the collection sites
were chosen to be of similar longitude, altitude and distance from the sea, in order
to minimise variation caused by factors other than latitude. The longitudes of the
populations were between 146°E and 147.1°E, except Darwin, which was at
130.44°E. All the Australian populations were collected from low altitude sites
near the coast. These populations have been maintained since collection in bottle
culture at 25 °C. The Australian populations form part of a din e that has
previously been found to exhibit latitudinal variation in body size, development
time, egg size and ovariole number (James et al. 1995; James and Partridge 1995;
Azevedo et al. 1996).
2.1.3 Dahomey Population (Chapter 4)
The Dahomey population was collected in 1970 in Dahomey, West
Africa (now Benin) and was maintained from collection in population cage
culture with overlapping generations at 25°C.
2.1.4 SM5/bw^*; TM3/TM6 Balancer Stock (Chapter 5)
The SM5/bw^^; TM3/TM6 stock contains balancer chromosomes. These
balancer chromosomes contain inversions, which prevent recombination and also
contain dominant visible markers that are used to indicate the presence of the
chromosome. The balancer chromosomes are homozygous lethal so a fly cannot
have 2 copies of the same balancer chromosome. SM5 is a second chromosome
balancer chromosome, which carries the curly wing mutation. The other second
chromosome contains the bw^' mutation which is a brown variegated eye colour
mutation, this mutation is associated with an inversion, and is homozygous lethal
not completely covered by inversions. The third chromosome balancers are TM3
and TM6, TM3 carries the serrate and stubble mutations and TM6 carries tubby
and humeral (Lindsley and Zimm 1992). Crossing schemes involving these
balancer stocks were used to perform chromosome substitutions in the South
American and Australian populations (Chapter 5). The combination of
inversions (to prevent recombination) and visible dominant markers enable the
isolation of individual wild type chromosomes which can then be substituted into
Table 2.1 The locations and latitudes of the collection sites of the South American populations
Population
Location
Latitude (°S)
GU
Guayaquil, Ecuador
2°13'
AR
Arica, Chile
18°28'
IQ
Iquique, Chile
20°13'
AN
Antofagasta, Chile
23°38'
CO
Copiapo, Chile
27°20'
CQ
Coquimbo, Chile
29°56'
VA
Valparaiso, Chile
33*05'
LI
Linares, Chile
35*48'
VD
Valdivia, Chile
39*48'
Table 2.2 The locations and latitudes of the collection sites of the Australian populations
Population
Location
Latitude (°S)
DAR
Darwin, Northern Territory
12.23°S
INN
Innisfail, Queensland
17°30'
FLO
Flowerpot, Tasmania
43°08'
CYG
Cygnet, Tasmania
43°15'
2.2 Rearing Methods
2.2.1 Culture Media
2.2.1.1 Standard food (ASG)
85g sugar
60g maize meal
20g dried yeast
lOg agar
25ml of 10% Nipagin solution in ethanol
1 litre of water
This medium is used for maintaining bottle and vial populations and also used
2.2.1.2 Sugar-yeast food (SY)
lOOg sugar lOOg dried yeast
20g agar
3 ml propionic acid
30ml of 10% Nipagin solution in ethanol
1 litre of water
This medium is used for maintaining the Dahomey cage population.
2.2.1.3 Grape juice medium
50g agar
600 ml grape juice 1 litre water
42.5ml of 10% Nipagin solution in ethanol
Used for collecting eggs in laying pots or from cages in petri dishes. Eggs or
first instar larvae can be easily picked from the surface of the medium.
2.2.1.4 Agar and yeast
5mg agar
1 litre water
Yeast in aqueous solution is added to the surface of 1ml of the autoclaved agar
medium in small vials (12mm diameter). This medium is used in larval growth
2.2.2 Stock Maintenance
2.2.2.1 Bottle stocks (South American and Australian populations)
Flies were transferred to a fresh 1/3 pint bottle containing 80ml of ASG
medium. The flies were allowed to lay in the bottle for a few hours until a
moderate density of eggs had been laid on the surface of the medium, the flies
were then removed from the bottle. This process was repeated after 14 days (at
25°C) when the majority of flies had eclosed.
2
.12.1
Vial stocksThese were maintained in the same way as bottle stocks (above), except
flies were transferred to vials (22mm diameter, 75mm height) containing 7ml of
standard food.
2.2.2.3 Cage (Dahomey)
3 bottles containing 80ml of SY food (See General Materials and
Methods) were added each week on a 4-week rotation. There were therefore
always 12 bottles in the cage, covering a 4-week period. The Dahomey cage is
2.3 General Methods
2.3.1 Egg Collection
2.3.1.1 Laying pots
Flies were placed in laying pots containing grape juice medium with a dab
of live yeast on the surface. An acclimatisation period of 12-24 hours was
allowed followed by a pre-lay period of 1 hour on fresh medium to encourage the laying of any retained eggs. The flies were then transferred to fresh medium for
egg collection.
2.3.1.2 Cage collection
A petri dish containing grape juice medium was placed into the cage for a short period.
2.3.2 Standard Density Culture
Where a standard, uncrowded, larval density was required, 50, first instar
larvae were picked from the grape juice medium in a laying pot or petri dish
using a mounted needle, and were placed in a vial containing approximately 7ml
of standard (ASG) medium. Where crowded larval conditions were required, 200
2.3.3 Wing Area Measurement
On emergence, flies were removed from vials under carbon dioxide anaesthesia and were frozen. The left wings of adult flies were then removed,
fixed with propanol and mounted on microscope slides using Aquamount.
Images of the wings were captured on a PowerMacintosh 8600/200 computer
with a video camera attached to a compound microscope. A good approximation to total wing area was achieved by measuring the area between 6 points
(including the 4 points where veins intersected the edge of the wing) as illustrated in Figure 2.1. Wing area was measured using Object Image 1.60p software (by
Norbert Vischer, based on the public domain NIH Image program, available at http://simon.bio.uva.nl/obJect-image.html).
2.4 Statistical Analysis
All statistical analysis was performed using IM P 3.2.2 for the Macintosh (SAS
3. Starvation Resistance and Adult Body
Composition in a Latitudinal Cline of
Drosophila melanogaster
3.1 Abstract
Although dines in many traits of Drosophila melanogaster have been
found throughout the world, a d in e in starvation resistance and fat content in
Drosophila melanogaster has so far been found only in India. Here we
investigate starvation resistance and fat content in 10 populations from South
America, in which dines in body size, egg size and development time have
previously been found (See General Materials and Methods). We find no evidence for a dine in starvation resistance or fat content in South America. We
therefore suggest that the d ine in starvation resistance in India may have evolved
3.2 Introduction
The work described in this chapter has been accepted for publication in Evolution
(Robinson et al. in press, see Appendix).
Latitudinal dines in starvation resistance have been found in Drosophila
melanogaster, D. ananassae, D. kikkawai and Zaprionus indianus in India, with
higher starvation resistance occurring at lower latitudes (See General Introduction
and Karan et al. 1998a; Karan and Parkash 1998). Other studies in India have
also found latitudinal trends in starvation resistance in smaller numbers of
populations of Drosophila melanogaster (Shamina et al. 1993), D, kikkawai
(Parkash and Vandna 1994) D. bipectinata and D. malerkotliana (Parkash et al.
1994). In Europe and Africa, differences in starvation resistance have been found
between populations of D. melanogaster, but these differences were not related
to latitude (Da Lage et al. 1990). The latitudinal differences in starvation resistance in India may be explained by ecological and/or climatic factors other
than temperature, which also vary with latitude (Karan et al. 1998a). Starvation
resistance has often been used as an indirect measure of fat content, because
these 2 characters are highly correlated (David et al. 1975; Zwaan et al. 1991;
Zwaan et al. 1995b; Zwaan et al. 1995a). However, studying fat content directly
would eliminate other factors such as metabolic rate that may affect starvation
resistance (Hoffmann and Parsons 1989). It should also be noted that some of
the latitudinal ranges studied may not have been wide enough to detect
correlations with latitude.
In the present study, starvation resistance and fat content were measured
in 10 populations from a transect along a wide latitudinal range in South
America. Temperature varies with latitude over this transect, while a number of
Land 1997). The collection sites for these populations were low altitude, coastal
sites, in order to minimise variation caused by factors other than latitude.
The aims of the present study were: (i) to establish whether starvation
resistance and fat content are among the suite of traits that vary with latitude and
for which temperature is implicated as the selective agent, and (ii) to establish
whether there is clinal variation in body composition in South America. Because
these populations are known to increase in body size with latitude, we investigate
whether fat content also increases with latitude, which could indicate an ability of
high latitude flies to acquire more food or to utilise food more efficiently.
Alternatively, increased body size may be achieved by utilising the fat reserves for
extra growth. Larval crowding has been shown to influence fat content and
starvation resistance in temperate (Zwaan et al. 1991) and tropical (V an't Land 1997) populations of D. melanogaster. Therefore, this experiment was
performed using adult flies that had been kept at either high or low density as
larvae in order to assess whether differing larval density affects fat content, starvation resistance or the relationship of fat content and starvation resistance
with latitude.
3.3 Materials and Methods
Starvation resistance and fat content were measured in the South
American populations (See General Materials and Methods)
Standard density cultures of 50 and 200 larvae per vial (See General
Materials and Methods) were set up for each of the populations (3 vials per
density per population). The 2 densities were used to test whether crowding had
any effect on starvation resistance. Eclosing adults were collected on ice as
virgins and were transferred in single sex groups of 5 to vials containing fresh