Improving Teaching Effectiveness Through
The Application Of SPC Methodology
David Cadden, Quinnipiac University, USA Vincent Driscoll, Quinnipiac University, USA Mark Thompson, Quinnipiac University, USA
ABSTRACT
One method used extensively to aid in determining instruction effectiveness is Student Evaluations of Instruction (SEI). This paper examines the use of statistical Process Control charts as a way to correctly measure teaching effectiveness. This field studying SEIs has produced a significant literature. It is not surprising that there is considerable controversy over the efficacy of such instruments in measuring instructor performance or student learning. Numerous factors that may influence the outcome of SET score have been identified. These include: class size, workload level of subject taught, and the nature of the subject. Clayson’s (1999) review found a profound impact due to personality variables, such as instructors’ age, and teaching experience. It is clear that SEI results can be influenced by many factors. Interestingly, this extensive literature provides no clear guidance on how to interpret SET results in order to make comparative evaluations of instructors’ performance. The research proposed in this paper suggests that variations of Statistical Process Control methods could be used in such evaluations. Only one prior paper (Marks and O’Connell, 2003) has suggested this approach. Our research examines six semesters of SET responses for all courses in our business school – a data base of nearly 30,000 responses. The paper examines what measure should be used as the standard by which an instructor’s performance should be evaluated. Specifically, it evaluates whether a school-wide, department-wide or course specific measure should be used as the standard. Statistical analyses are conducted to determine if there are significant differences on a standard measure across departments and across semesters. The goal is to develop a system that can accurately gauge faculty members whose evaluations are statistically superior or inferior. Such a system would enable department chairs and the administration to determine the relative effectiveness of faculty in teaching particular courses.
INTRODUCTION
olleges and Universities are under increasing pressure to demonstrate accountability. This has lead for many institutions a greater emphasis on teaching and the need for specific and measurable evaluation of teaching [Frost and Fukami (1997)]. The appropriate evaluation of the effectiveness of instruction is a matter of major importance to all educational institutions. One method used extensively to aid in determining
instruction effectiveness is Student Evaluations of Instruments (SEI).SEIs have been used in American Universities
for over eighty years [D’Apolloni and Abrami (1997)]. Currently, they play a key role in pay raises, promotion and tenure. Seldin (1993) has pointed out that administrators place the greatest emphasis on SEI to determine the quality of faculty teaching. Becker and Watts (1999) have argued that the measurement derived from SEIs contributed 50% to 60% of the overall evaluation of teaching effectiveness. Hobson and Talbot (2001) and Richardson (2005) have stated that universities use SEIs as their primary method for evaluating teaching effectiveness. Comm and Matthasiel (1998) found that 94% of business schools responding to a survey use SETs as one the means of evaluation instruction. This high proportion may be due to assessment requirement of AACSB (1994).
Not surprisingly, given their importance, SEIs have generated a rather significant literature. Cashin (1995) stated that there were over 1,500 books and articles on SEIs. Wilson (1998) reported that since their first use there
has been over 2, 000 articles on this subject. In2007, Al-Issa and Sulieman (2007) identified almost 3,000 articles
and books on SEIs that were published during the fifteen year period of 1990 and 2005. Given this immense literature it isn’t terribly surprising to find that a number of factors that may impact the outcome of SEIs have been analyzed and researched – the effectiveness of SEI application, their validity, a broad number of contextual variables that may influence their outcomes, and personality variables of both students and instructors that may influence outcomes. Nor should it be unexpected that this literature has generated considerable controversy with no clear consensus on how these factors unambiguously affect the outcomes of SEIs.
LITERATURE REVIEW
Validity
The most important and central issue to this literature must be whether student evaluation instruments accurately measure an instructor’s teaching effectiveness. Simply put, are SEIs valid? A considerable portion of the literature [Rodin and Rodin (1973); Sopher (1973); Greenwald (1997); McKeachie (1997); Morgan et al. (2003); Clayson and Sheffet (2006); and Glynn et al. (2006)] addresses this question of validity. Although most of the aforementioned articles tend to support the argument that SEI are valid instruments there are there have been several studies [Wachtel (1998); and Aleamoni (1999)] that raised significant questions as to their effectiveness with respect to measuring a teacher’s effectiveness in the class.
There is the question of whether students are in a position to accurately evaluation the teaching capabilities of their professors. Some argue that students cannot evaluate [Caskin (1983); Selden (1984), Newton (1988); Bures, DeRidder and Tong (1990); and Richer (1996)].
What appears to be relatively uncontested is the issue that student evaluation instruments may be
influenced by a variety of contextual and behavioral variables. Some of these variables include: personality, course
workload and organization, type of course (requirement for the business core, requirement for the major, or an
elective), grading leniency (inflation), and other instructor variables.
Personality, Behavioral And Demographic Variables
Many researchers have found that demographic and personality characteristics have an impact of the results of Student Evaluation Instruments. These results, of course, can bring in question the overall validity of these instruments. Researchers who have found that personality characteristics of the instructor influence SEI results
include: Naftulin, Ware & Donnelly (1973); Aigner and Thum (1986);Feldman (1984); Ortinau & Bush (1987);
Hewett, Chastain & Thurber (1988); and Sauber & Ludlow (1988)].A recent study by Clayson and Sheffet (2006)
found a strong relationship between students’ perception of the instructor’s personality and their evaluation of
instructional effectiveness. Williams and Ceci (1997) found that SEI ratings are significantly influenced by
instructors’ personality factors such as, warmth, confidence and dominance. Clayson (1999) argued that between 50% and 80% of variance in SEI results could be attributed to personality. However, not all authors [Centra (1993) and Braskamp et. al. (1944)] agree with the notion that personality is a major determinant of SEI results.
In addition to personality issues, demographic factors have also been studied. The gender and race of instructors have also been investigated as possible. As far back as 1971 Bledsoe examined the impact of gender on
evaluations. More recent studies have examined the role of race in SEI outcomes. A study of female Hispanic
faculty [Smith and Anderson (2005)] found that they received lower scores on their SEIs than their Anglo
counterparts. As late as 2007, a study by Smith reported that Black faculty had lower mean scores as their white
colleagues.
Another segment of this body of research [Leslie, Kellams & Gunne (1982); Gappa (1984); and Bruno
(2003)]has looked at the employment status of the instructor and has found that full-time faculty members generally
Researchers have looked at the impact of course workload on SEIs. Not surprisingly several studies
[Stapelton et al. (2001) and Paswan and Young (2002)]clearly indicated a negative relationship between increased
course demands (materials, workload, and homework) and the results of student evaluations of their instructors. Course demands (as measured by hours per week required outside of class) were found by Aigner and Thum (1986) findings also supported that had a significant negative impact. However, a more recent study focusing only on
engineering courses illustrated no correlation between workload and overall instructor performance (Dee, 2007).
Course Type
A sizeable body of research has looked at the relationship between the type of course (requirement for the
school core, requirement for the major, or an elective) and the student’s evaluation of the professor.Two studies
[Marsh (1987) and Feldman (1978)] found that elective courses are rated higher than non-elective courses. These same studies found that required courses outside the student’s major receive the lowest ratings. The difference between required and elective courses was also investigated by Mulford and Schneider (1988) and Deberg and Wilson (1990).
Quality Education
Martin (1998) critiques the entire concept of SEI’s from the Deming perspective of quality. He argued from Deming that the vast majority of variation is attributable to system-wide factor rather than individual differences. He identified 26 system-wide factors that could contribute to variations and points out that even amongst the 34 teacher related characteristics not all are under the complete control of the professor. The inevitable ranking that may come from the use of SEIs is counter to key elements of the Deming philosophy of management. There is no “explicit operational definition of high quality teaching” (Martin, 1998, pg 1080). Bruno (2003) stated that “no clear definition or understanding of Quality as it relates to education”. Pg 2
Some have argued that student evaluation instruments might actual contribute negatively toward quality education. Wallace and Wallace (1998) and Becker and Watts (1999) both have argued SEIs have led to grade inflation and a decline in educational standards. This issue of SEIs leading to grade inflation has been examined by [Nelson and Lynch (1984); Mehdizadeh (1990); Stratton et al. (1994); Isley and Singh (2005); and McPherson
(2006)].
METHOD
Student Evaluation Instrument
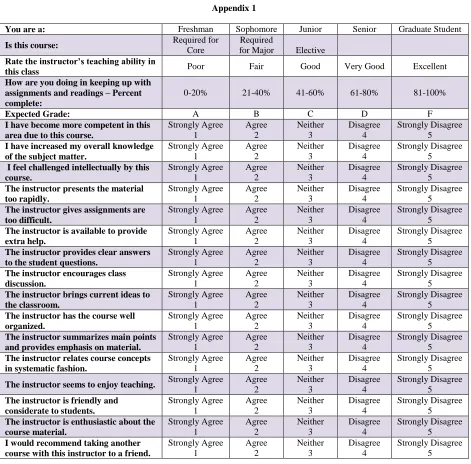
As part of the Quinnipiac School of Business’ quest for AACSB fifteen year ago we initiated an assessment program. Key, at that time, to this program was the development and use of a student evaluation instrument. The instrument has twenty-one closed end questions and two open-ended questions – a copy is provided in Appendix 1.
In order to assure anonymity no demographic questions other than other than the student’s status (freshman,
sophomore, junior, senior or graduate student) is collected. Data is also collected on the categorization of the
course: a business core, a major’s core or an elective.We also inquire the extent to which the student is keeping up
with materials for the course; and the expectation of their grade. The remaining seventeen closed end questions
focus on the student’s perception of particular aspects of the course and their instructor’s teaching ability. These
questions are scored on a five-point Likert scale.Two items, students’ evaluation of the instructor’s Teaching Ability
and whether the student would Recommend this instructor to a friend, are of particular importance during the
evaluation process. This paper will singularly focus on the Teaching Ability score. This question is coded such that
the more favorable the evaluation of the instructor’s teaching ability the higher the score (1-Poor~5-Excellent).
Sample
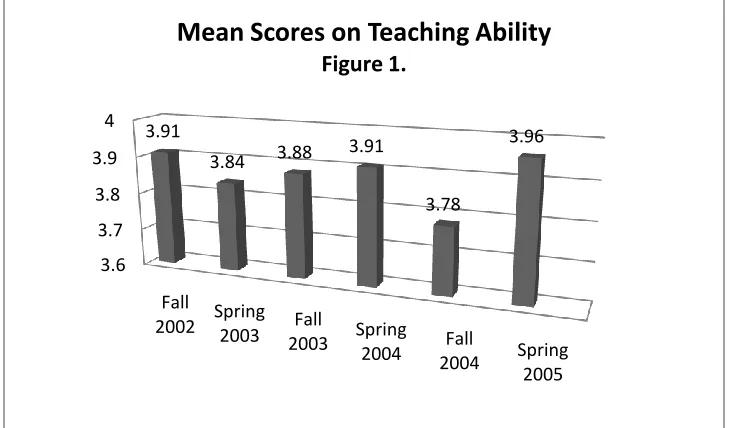
Evaluation Instrument for six semesters (three years) for the entire School of Business. The results yielded nearly 30,000 useable responses across all business majors. Table 1 presents the total number of surveys for each of the six
semesters along with the means and standard deviations of the Teaching Ability score. Figure 1 plots the mean
values for the six semesters on this measure.
Table 1: Means and Standard Deviations for Teaching Ability Question for all Six Semesters
Count Mean Std. Dev.
Fall 2002 4312 3.91 1.07
Spring 2003 4605 3.84 1.10
Fall 2003 5348 3.88 1.08
Spring 2004 5395 3.91 1.04
Fall 2004 5212 3.78 1.16
Spring 2005 4724 3.96 1.05
Measurement Standard
The vast majority of studies of SEIs focus on a single department. Although the literature regarding factors impacting SEIs is extensive, it often does not consider the standard by which to measure performance. Further, most studies focus on a single department. If a study does focus on multiple departments there does not appear to be a distinction made amongst departments. Therefore, they do not have to consider the standard – university-based,
school-based or department-based - by which to measure performancekey aspect of this research is to examine the
impact of using different performance standards to evaluate faculty members.Obviously use of a global standard
would be preferable and easier given the uniformity it would provide. However, the existence of statistical
differences between departments for Teaching Ability would bring into question the validity and more importantly,
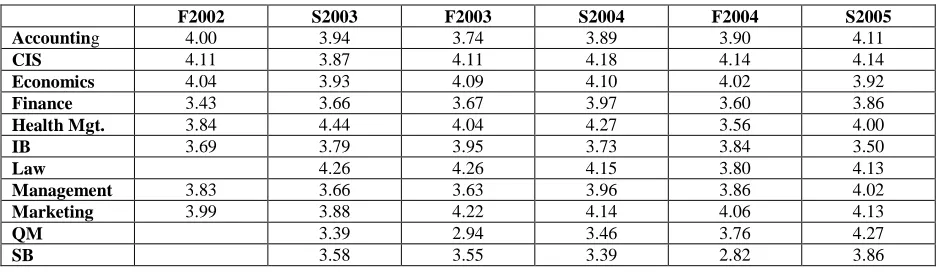
the fairness of using a single global measure. To this end, we provide a breakdown of the Teaching Ability score for all departments across all six semesters in Table 2.
3.6 3.7 3.8 3.9 4
Fall
2002 Spring 2003 Fall
2003 Spring 2004 Fall
2004 Spring 2005 3.91
3.84 3.88 3.91
3.78
3.96
Mean Scores on Teaching Ability
Table 2: Mean Score for Teaching Ability for All departments Across the Six Semesters
F2002 S2003 F2003 S2004 F2004 S2005
Accounting 4.00 3.94 3.74 3.89 3.90 4.11
CIS 4.11 3.87 4.11 4.18 4.14 4.14
Economics 4.04 3.93 4.09 4.10 4.02 3.92
Finance 3.43 3.66 3.67 3.97 3.60 3.86
Health Mgt. 3.84 4.44 4.04 4.27 3.56 4.00
IB 3.69 3.79 3.95 3.73 3.84 3.50
Law 4.26 4.26 4.15 3.80 4.13
Management 3.83 3.66 3.63 3.96 3.86 4.02
Marketing 3.99 3.88 4.22 4.14 4.06 4.13
QM 3.39 2.94 3.46 3.76 4.27
SB 3.58 3.55 3.39 2.82 3.86
In Table 3, we provide the results of an ANOVA test for the diffrence among means for the eight largest
departments. [It should be noted that starting with Spring of 2003, we added the results from three additional
departments. One of these departments – School of Business courses was, in effect, created starting in that semester. The other two smaller departments were categorized as separate entities beginning with the Spring 2003 semester. Therefore, we ran this ANOVA test with the other eight departments.] The results clearly indicate that on the Teaching Ability measure there is an extremely significant statistical difference amongst the departments. Is the variation between departments due to the quality of teaching in each department or is it due to a wide variety of other factors unrelated to teaching effectiveness such as the subject material covered? These are the factors will be discussed in the conclusions and future research section of this paper. We will argue that the failure to consider variations across departments can inflate a particular faculty evaluation or unjustly penalize the result.
Table 3: ANOVA Results for Teaching Ability Measure for Six Semesters
Sum of Squares df Mean Squares F Significance
Between Groups 1201.19 7 117.60 150.83 > .001
Within Groups 32030.25 28153 1.14
Total 33231.44 28160
STATISTICAL PROCESS CONTROL CHARTS
Interestingly, the extensive literature on SEIs provides no clear guidance on how to interpret SEI results in order to make comparative evaluations of instructors’ performance. This research adopts a quality focus by advocating the use of statistical process control charts (SPCC) to evaluating student evaluation instruments. Statistical process control charts date back to the 1920s. They are most often used to detect anomalistic observations in manufacturing processes although they can, and are, used in service environments such as hospitals. One begins
with processes that are statistical stable or in “control”. Limits (generally 2 or 3 standard deviations away from a
predetermined mean) are determined based on the normal variation within the process. Observations that lie outside
these limits have a small probability of occurring naturally; therefore, they are viewed as being due to special
causes.There are also instances in which observations that lie with limits but display non-random patterns. These
observations may signal the presence of special causes. It is absolutely vital to understand that the correct
application of statistical process control charts centers on facilitating the identification of the root causes of the
would include information on the particular course, student enrollment, status of course (business core, major core or elective; undergraduate vs. graduate) and instructor workload.
We know of only one other paper – Marks and O’Connell (2003) - that advocates the use of this powerful approach. Those authors investigated not only the application used a control chart approach, but continued with a method to remove possible biases associated with the students anticipated grade
This paper examines what measure should be used as the standard (mean value) by which an instructor’s performance should be evaluated. Specifically, we evaluate whether a school-wide, department-wide measures should be used as the standard. The goal is to develop a system that adopts an analytical basis for accurately gauge faculty members whose evaluations are statistically superior or inferior. Such a system would enable department chairs and the administration to determine the relative effectiveness of faculty in teaching particular courses.
In this study we focus on four departments – Accounting, economics, Finance and Management. All four departments had a large number of undergraduate and graduate courses, and they were taught by both full-time and part-time faculty. These values are summarized in Table 4. We computed the mean and standard deviation for each course. We also computed the means and standard deviations, on this measure, for each of the four departments for each of the six semesters.
Table 4: Breakdown of Classes for Four Departments
Accounting Economics Finance Management
Total Number of Classes 181 255 113 185
Undergraduate Classes 146 242 93 151
% of Undergraduate Classes 88.66% 94.90% 82.30% 81.62%
Classes Taught by Full-Time Faculty 126 122 102 129
% of Classes Taught by Full-Time Faculty 69.61% 47.84% 90.27% 69.73%
There are a variety of charts for various situations. We chose to use a S (standard deviation) chart because we treated each course section as a sample and the sample size (class size) was almost always over ten. The control limits were calculated in the following manner:
_
Upper Control Limit (UCL) = Xi + 3(Sij/ C4)
_
Lower Control Limit (LCL) = Xi - 3(Sij/ C4)
_
Where: Xi = Grand Mean for either the School or the Department in semester i
Sij = Standarddeviation for course j in semester i
C4 = a constant determined by the sample size
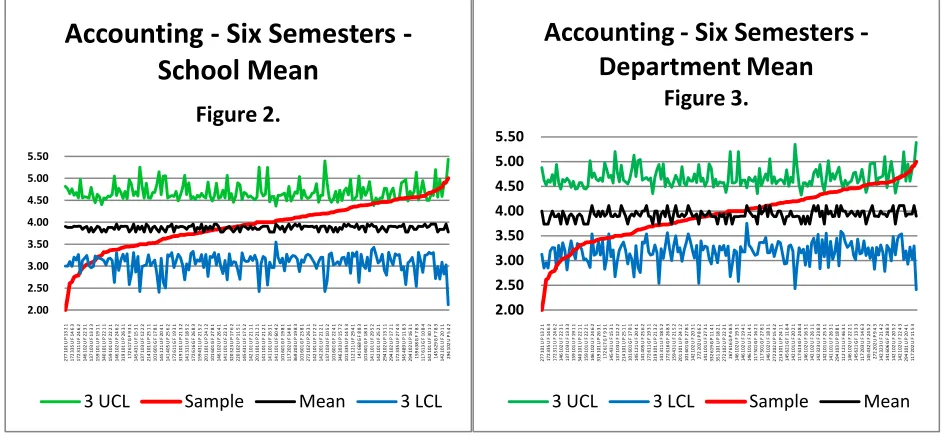
In Figures 3 and 4, we provide statistical process control charts for the the Accounting Department across the six semesters. Figure 3 uses the school mean as the grand mean while Figure 4 shows the use of the department mean. The data for these 181 courses was sorted so that the mean score for each class from the lowest to the highest. This was done to a visually clearer result. It produces the characteristic S-shaped curve in all of the department-wide charts – Figures 2, 3, 6, 7, 10, 11, 14 and 15. We performed this sort so that we can easily see those courses that were above or below the Upper and Lower Control Limits. The results indicate that when the school’s mean was
used 12 of the 181 courses fell below the Lower Control Limit which would signify particular poor performance.
When the department mean was used this number rises to 16 courses – a rather significant difference. When we look
at courses that scored above the Upper Control Limit – which would indicate superior performance - based on the
this is that the selection of a particular standard – school or department - will impact on the determination of statistical “outliers”.
The most likely use of Statistical Process Control charts will be used for evaluating individual instructors. In Figures 4 and 5, we provide plots for two different faculty members. For simplicity’s sake, we only present charts
that used the school’s mean. This shouldn’t be taken as an endorsement of this mean as the appropriate standard.The
results for both faculty members are interesting and they illustrate the potential power of this technique. The values on the x-axis represent the course that the instructor taught. We could include additional information about the course such as its staus (business core, major core or elective), students’ average status,expected grade, etc.. These other factors were not placed on the x-axis for the purpose of simplicity of presentation. If you examine Accounting Faculty Member 1 you see that the Teaching Ability scores for all courses are above the school’s average and that four of the sixteen courses score above the Upper Control Limit which imply statistically significant superior performance. This chart can be seen as clear evidence of superior teaching as evaluated by the students. Accounting Faculty 2 presents a different and a somewhat challenging case. At first glance, it appears that the majority of scores are below average, with three courses having scores below the Lower Control Limit. Thus indicating particularly poor performance in the students’ eyes. However, if we carefully examine the results on sees that the first two
courses – one is statistically significant on the positive side while the second is statistically significant on the
negative. Further examination showed that these were two sections, of the same course, in the same semester. Both had the same staus of students and the class sizes were essentially identical. The only difference was when the classes were offered – one in the morning and one in the late afternoon. These results bring into question the “universal” validity of student evaluation instruments.
2.00 2.50 3.00 3.50 4.00 4.50 5.00 5.50 2 7 7 1 0 1 U P 1 3 2 1 1 7 2 3 3 5 U F 1 4 6 3 1 7 2 3 1 1 U F 2 4 6 2 1 4 6 1 0 2 U F 2 2 3 1 1 3 7 1 0 3 U F 1 3 3 3 1 5 9 1 0 1 U F 1 9 1 1 3 4 0 1 0 1 U P 2 2 1 1 1 5 9 1 0 1 U F 2 2 2 1 1 4 6 1 0 2 U F 2 4 6 2 3 1 9 1 0 1 U P 2 6 3 1 1 7 2 6 1 7 G F 9 3 1 1 4 5 4 3 1 U F 1 5 3 1 1 3 7 1 0 3 U F 1 2 2 2 2 1 4 1 0 1 U P 2 5 1 1 1 0 1 6 0 1 G F 1 7 8 1 1 4 5 1 2 1 U F 2 0 4 1 1 4 1 4 0 5 U F 2 5 6 2 1 7 2 6 1 1 G F 1 9 3 1 3 1 9 1 0 1 U P 2 1 3 2 1 4 1 3 1 1 U F 1 8 5 2 1 7 2 6 1 6 G F 2 6 8 3 1 5 9 4 3 1 U F 2 1 5 2 2 0 1 1 0 1 U P 2 4 1 2 1 0 1 6 0 1 G F 2 7 8 1 1 4 6 1 0 2 U F 2 6 4 1 1 4 1 1 0 1 U F 2 2 3 1 3 2 0 3 2 3 U P 1 7 6 2 2 2 0 1 0 2 U P 1 1 5 1 1 4 5 4 3 1 U F 1 7 5 2 1 4 2 1 0 1 U F 2 1 1 1 2 0 1 1 0 1 U P 2 1 2 1 1 4 1 1 0 1 U F 2 1 2 1 1 4 1 1 0 1 U F 2 6 3 1 1 4 1 1 0 1 U F 6 0 4 2 1 0 1 6 0 1 G F 1 9 8 1 1 1 7 2 0 2 U F 1 4 8 1 3 6 9 2 0 3 U P 1 9 8 3 1 0 1 6 0 1 G F 2 3 8 1 2 7 2 1 0 2 U P 2 6 3 1 1 4 2 1 0 1 U F 1 7 2 2 1 4 2 2 0 1 U F 2 1 2 1 1 3 7 1 0 3 U F 1 0 5 2 1 0 1 6 0 1 G F 2 2 4 1 3 4 6 2 0 3 U P 1 5 7 2 1 0 1 3 3 5 U F 1 4 5 3 1 1 2 1 2 1 U F 2 9 4 1 1 4 1 6 6 8 G F 8 8 3 1 0 1 6 0 1 G F 1 8 3 1 1 4 1 1 0 1 U F 2 9 5 2 1 4 2 1 0 1 U F 2 5 2 1 2 9 4 1 0 2 U P 1 3 1 1 2 9 4 1 0 2 U P 1 7 2 1 1 7 2 3 3 5 U F 2 7 4 3 3 4 5 4 8 9 U P 1 1 8 3 2 9 4 1 0 2 U P 1 6 3 1 1 5 9 6 3 8 G F 7 8 3 1 1 7 6 1 3 G F 1 0 8 4 1 4 2 1 0 1 U F 3 0 1 2 1 4 5 6 2 9 G F 7 8 3 1 4 2 1 0 1 U F 2 0 1 1 2 9 4 1 0 2 U P 5 4 2
Accounting Six Semesters
-School Mean
Figure 2.
3 UCL Sample Mean 3 LCL
2.00 2.50 3.00 3.50 4.00 4.50 5.00 5.50 2 7 7 1 0 1 U P 1 3 2 1 1 7 2 3 3 5 U F 1 4 6 3 1 7 2 3 1 1 U F 2 4 6 2 1 4 6 1 0 2 U F 2 2 3 1 1 3 7 1 0 3 U F 1 3 3 3 1 5 9 1 0 1 U F 1 9 1 1 3 4 0 1 0 1 U P 2 2 1 1 1 5 9 1 0 1 U F 2 2 2 1 1 4 6 1 0 2 U F 2 4 6 2 3 1 9 1 0 1 U P 2 6 3 1 1 7 2 6 1 7 G F 9 3 1 1 4 5 4 3 1 U F 1 5 3 1 1 3 7 1 0 3 U F 1 2 2 2 2 1 4 1 0 1 U P 2 5 1 1 1 0 1 6 0 1 G F 1 7 8 1 1 4 5 1 2 1 U F 2 0 4 1 1 4 1 4 0 5 U F 2 5 6 2 1 7 2 6 1 1 G F 1 9 3 1 3 1 9 1 0 1 U P 2 1 3 2 1 4 1 3 1 1 U F 1 8 5 2 1 7 2 6 1 6 G F 2 6 8 3 1 5 9 4 3 1 U F 2 1 5 2 2 0 1 1 0 1 U P 2 4 1 2 1 0 1 6 0 1 G F 2 7 8 1 1 4 2 1 0 2 U F 2 0 3 1 27 2 2 0 2 U P 8 6 2 1 4 1 1 0 1 U F 2 7 3 1 3 3 2 6 1 9 G P 1 1 4 1 3 5 1 1 0 1 U P 1 8 2 1 2 7 2 1 0 2 U P 2 2 3 1 2 6 7 6 1 6 G P 6 8 5 1 4 6 1 0 2 U F 1 9 3 1 1 4 6 1 0 2 U F 1 9 4 1 1 4 6 1 0 1 U F 2 1 4 1 1 1 7 5 0 1 G F 1 6 2 1 1 1 7 5 0 1 G F 2 7 8 1 1 4 6 1 0 2 U F 1 8 3 1 2 7 2 2 0 2 U P 1 5 4 2 2 1 4 1 0 1 U P 2 4 1 1 1 4 5 6 2 1 G F 1 1 8 4 1 4 2 1 0 1 U F 2 0 2 1 1 1 7 6 1 3 G F 2 4 8 4 1 4 6 1 0 2 U F 1 6 3 1 1 4 2 1 0 2 U F 2 6 1 1 1 4 2 3 2 3 U F 2 3 8 3 1 4 2 1 0 1 U F 2 5 3 1 1 4 1 1 0 1 U F 2 6 3 1 2 9 4 1 0 3 U P 1 8 8 1 1 1 2 1 2 1 U F 4 6 3 1 1 4 6 1 0 2 U F 2 2 2 1 1 4 5 6 2 1 G F 1 3 3 3 1 1 7 2 0 3 U F 1 4 6 3 1 4 5 4 3 2 U F 2 4 5 2 27 2 2 0 2 U P 9 4 3 1 4 2 3 2 3 U F 2 1 4 2 1 4 1 6 0 6 G F 2 8 8 3 1 4 2 1 0 2 U F 2 0 5 2 1 4 2 1 0 2 U F 2 2 4 3 2 9 4 1 0 1 U P 2 0 4 1 1 1 7 2 0 2 U F 1 1 5 3
Accounting Six Semesters
-Department Mean
Figure 3.
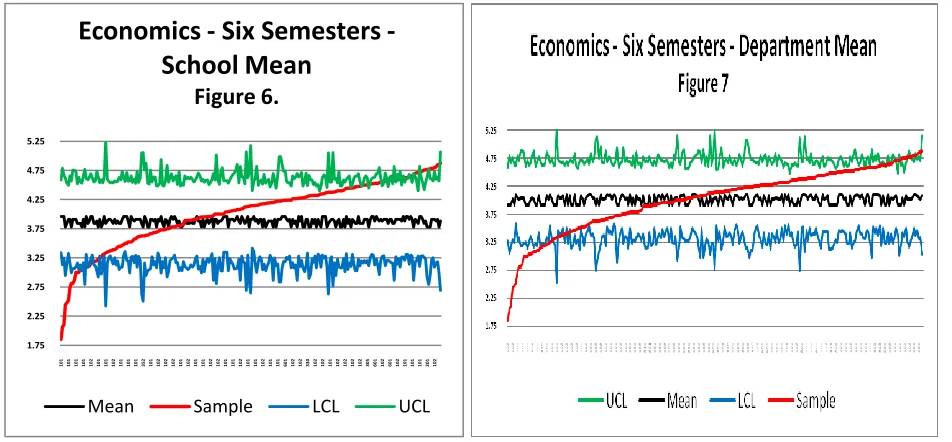
In Figures 6 and 7, we present the results for all Economics courses using the school mean and department mean, respectively. This department clearly illustrates the impact of using different standads. When using the
school mean there were 21 courses that were below the Lower Control Limt – which signifies negative performance;
however, when the department mean was used that number rises to 33 courses. When we look at the number of courses above the Upper Control Limit, one finds that there were 30 courses with the school mean. When the department mean is used this number drops to 17 courses. These are significant differnces that could have profound meaning for some faculty.
2.90 3.30 3.70 4.10 4.50 4.90
101 101 323 101 102 101 101 101 101 101 101 101 102 102 102 102
Accounting Faculty Member
1 - School Mean
Figure 4.
UCL LCL Sample Mean
2.00 2.50 3.00 3.50 4.00 4.50 5.00
335 335 618 311 311 616 335 611 617 411 616
Accounting Faculty 2 - School
Mean
Figure 5.
3 UCL 3 LCL Sample Mean
1.75 2.25 2.75 3.25 3.75 4.25 4.75 5.25
101 101 101101 102101 101 102101 101101 352 101102 102 102101 102101 101 102102 101101 102 101101 102101 101 601102 102330 102 102101 102102 102 102305 601102 601 102101 101 101201 102
Economics Six Semesters
-School Mean
Figure 6.
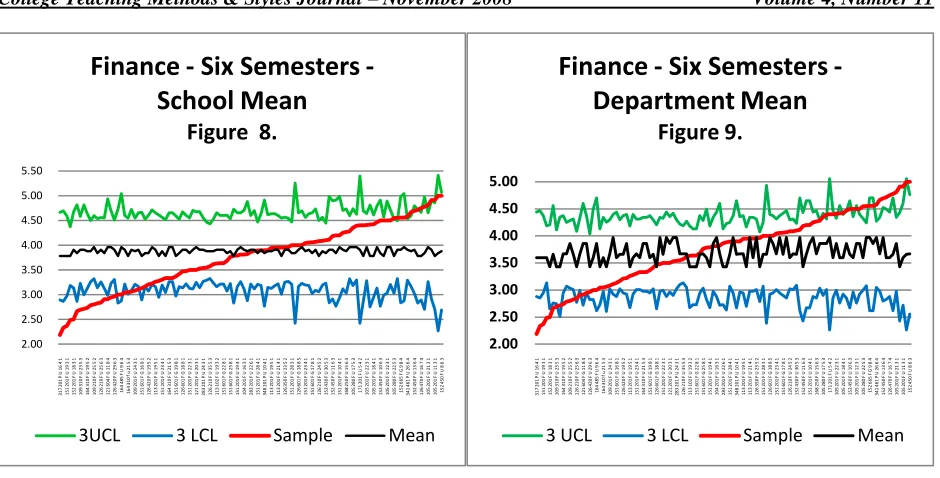
We examine the results for the Finance Department in Figures 8 and 9. Once again, we find significant differences between the school mean and the department when identifying outliers. When using the school mean there were 21 courses that had scores lower than the Lower Control Limit. This drops to only 12 courses when the departmean is used. When we examine those courses with scores above the Upper Control Limit – those the would
represent statistically significantly superior performance – we find only 8 courses based on the school mean. This
number rises to 18 courses when the department is used as the standard. Again, these represent significant diffrences.
The impact of such differences on an individual faculty member can be demonstrated in Figures 10 and 11. In the first figure (10) – where the standard is the school mean - this instructor had 4 courses where the scores were below the Lower Control Limit, no course scores above the Upper Control Limit. Only 41% of the instructor’s scores are above the school mean. However, when the department mean is used the instructor has 2 courses where the scores were below the Lower Control Limit, 1 course scores above the Upper Control Limit, and 55% of the courses’ scores are above the standard mean. These changes could play a role in this instructor’s overall teaching evaluation.
The results for the Management Department – see Figures 12 and 13 – show that when the school’s mean is used as the standard there were 26 courses that were below Lower Control Limit. When the department’smean was used as the standard 23 coureses were below Lower Control Limit. When we examine the number of courses above the Upper Control Limits we found that when the school’s mean was used as the standard there were 2o courses. This number rises to 24 when the department’s mean was used as the standard.
2.00 2.50 3.00 3.50 4.00 4.50 5.00 5.50 3 1 7 2 0 1 P U 1 6 4 1 1 5 1 2 0 1 F U 1 9 3 1 1 5 2 2 0 1 F U 1 8 3 1 1 0 9 3 1 0 F U 2 3 5 3 1 6 4 3 1 0 F U 1 9 5 2 1 0 9 2 1 0 F U 2 5 5 2 1 2 6 2 1 0 F U 2 5 6 3 1 2 1 6 0 4 F G 1 1 8 4 1 2 6 4 2 0 F U 2 9 6 3 1 6 4 4 8 5 F U 9 6 4 1 6 4 3 1 0 f u 2 1 5 3 1 0 9 2 0 1 F U 2 4 3 1 1 5 1 6 0 1 F G 1 6 8 1 1 2 6 4 2 0 F U 1 9 5 2 1 1 3 2 0 1 F U 1 9 5 1 1 5 1 2 0 1 F U 2 3 4 1 1 6 4 3 1 0 F U 2 1 5 3 1 5 1 6 0 1 F G 1 9 8 1 1 2 6 6 0 1 F G 1 8 8 1 1 5 1 2 0 1 F U 2 2 3 1 1 2 1 2 0 1 F U 2 0 3 1 2 8 3 2 0 1 P U 2 4 3 1 1 2 6 2 1 0 F U 3 5 5 3 1 1 3 1 0 2 F U 1 9 3 2 1 5 1 6 0 1 F G 2 2 8 1 1 5 1 6 0 1 F G 2 5 8 1 1 5 1 2 0 1 F U 1 9 4 1 1 0 4 2 0 1 F U 1 6 3 1 2 8 3 2 0 1 F U 2 2 6 1 1 5 1 2 0 1 F U 2 8 4 1 3 4 8 2 0 1 P U 1 0 4 1 1 1 3 2 0 1 F U 1 9 5 1 1 1 3 2 0 1 F U 2 1 4 1 1 2 6 3 5 0 F U 2 3 5 2 1 5 1 2 0 1 F U 2 8 3 1 1 2 6 6 0 1 F G 1 8 8 5 1 5 1 2 0 1 F U 2 3 4 1 1 5 1 6 0 1 F G 1 7 8 1 1 2 6 2 1 0 F U 2 4 5 2 1 5 2 4 3 0 F U 3 0 5 3 1 5 2 4 5 0 F U 1 1 6 3 1 5 1 2 0 1 F U 1 0 4 1 1 6 8 2 5 0 F U 1 5 6 3 1 0 5 2 8 0 F U 1 7 5 3 1 7 1 2 0 1 F U 5 4 2 1 0 5 2 0 1 F U 2 2 3 1 1 0 5 2 0 1 F U 1 8 4 1 1 5 2 4 5 0 F U 1 0 6 3 1 0 5 2 0 1 F U 1 2 3 1 1 0 5 2 8 0 F U 2 2 5 3 1 5 2 6 6 5 F G 9 8 4 3 4 1 4 6 1 P U 2 6 6 4 1 5 2 4 5 0 F U 1 3 6 4 1 2 6 4 7 0 F U 1 6 7 4 1 0 5 2 0 1 F U 2 1 3 1 1 0 5 2 0 1 F U 1 1 3 1 1 5 2 4 5 0 F U 8 6 3
Finance Six Semesters
-School Mean
Figure 8.
3UCL 3 LCL Sample Mean
2.00 2.50 3.00 3.50 4.00 4.50 5.00 3 1 7 2 0 1 P U 1 6 4 1 1 5 1 2 0 1 F U 1 9 3 1 1 5 2 2 0 1 F U 1 8 3 1 1 0 9 3 1 0 F U 2 3 5 3 1 6 4 3 1 0 F U 1 9 5 2 1 0 9 2 1 0 F U 2 5 5 2 1 2 6 2 1 0 F U 2 5 6 3 1 2 1 6 0 4 F G 1 1 8 4 1 2 6 4 2 0 F U 2 9 6 3 1 6 4 4 8 5 F U 9 6 4 1 6 4 3 1 0 f u 2 1 5 3 1 0 9 2 0 1 F U 2 4 3 1 1 5 1 6 0 1 F G 1 6 8 1 1 2 6 4 2 0 F U 1 9 5 2 1 1 3 2 0 1 F U 1 9 5 1 1 5 1 2 0 1 F U 2 3 4 1 1 6 4 3 1 0 F U 2 1 5 3 1 5 1 6 0 1 F G 1 9 8 1 1 2 6 6 0 1 F G 1 8 8 1 1 5 1 2 0 1 F U 2 2 3 1 1 2 1 2 0 1 F U 2 0 3 1 2 8 3 2 0 1 P U 2 4 3 1 1 2 6 2 1 0 F U 3 5 5 3 1 1 3 1 0 2 F U 1 9 3 2 1 5 1 6 0 1 F G 2 2 8 1 1 5 1 6 0 1 F G 2 5 8 1 1 5 1 2 0 1 F U 1 9 4 1 1 0 4 2 0 1 F U 1 6 3 1 2 8 3 2 0 1 F U 2 2 6 1 1 5 1 2 0 1 F U 2 8 4 1 3 4 8 2 0 1 P U 1 0 4 1 1 1 3 2 0 1 F U 1 9 5 1 1 1 3 2 0 1 F U 2 1 4 1 1 2 6 3 5 0 F U 2 3 5 2 1 5 1 2 0 1 F U 2 8 3 1 1 2 6 6 0 1 F G 1 8 8 5 1 5 1 2 0 1 F U 2 3 4 1 1 5 1 6 0 1 F G 1 7 8 1 1 2 6 2 1 0 F U 2 4 5 2 1 5 2 4 3 0 F U 3 0 5 3 1 5 2 4 5 0 F U 1 1 6 3 1 5 1 2 0 1 F U 1 0 4 1 1 6 8 2 5 0 F U 1 5 6 3 1 0 5 2 8 0 F U 1 7 5 3 1 7 1 2 0 1 F U 5 4 2 1 0 5 2 0 1 F U 2 2 3 1 1 0 5 2 0 1 F U 1 8 4 1 1 5 2 4 5 0 F U 1 0 6 3 1 0 5 2 0 1 F U 1 2 3 1 1 0 5 2 8 0 F U 2 2 5 3 1 5 2 6 6 5 F G 9 8 4 3 4 1 4 6 1 P U 2 6 6 4 1 5 2 4 5 0 F U 1 3 6 4 1 2 6 4 7 0 F U 1 6 7 4 1 0 5 2 0 1 F U 2 1 3 1 1 0 5 2 0 1 F U 1 1 3 1 1 5 2 4 5 0 F U 8 6 3
Finance Six Semesters
-Department Mean
Figure 9.
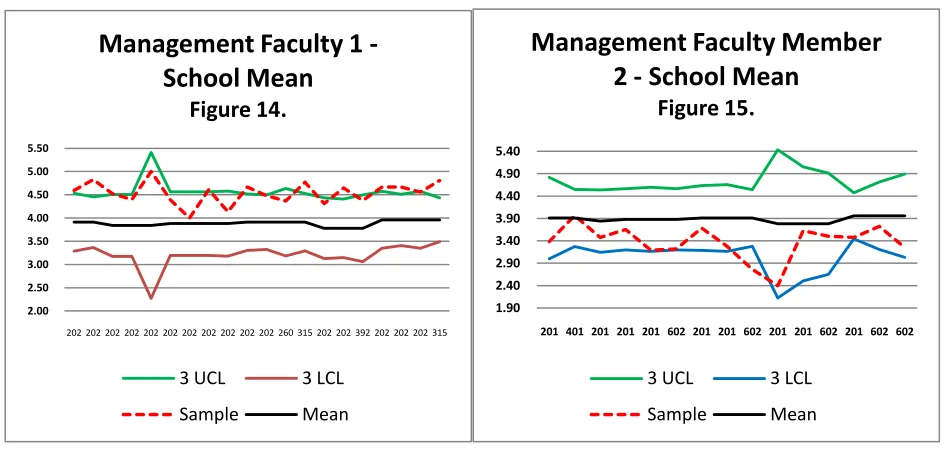
If we examine control charts for two individual management department faculty members – Figures 14 and 15 – we have what appears to be a clear distinction between a faculty member (Figure 14) who has received superior
score (every observation is above the mean and 50% of the courses are above the Upper Control Limit on the
Teaching Ability measure vs. a faculty member (Figure 15) whose scores are almost always below the mean. At first glance, this might be prima facea evidence of a significant difference in ability between the two faculty. Fortunately, the control chart format allows for a more comprehensive investigation. On the x-axis we plotted the courses being taught. What stands out is that the instructor in Figure 14 teaches courses that cover behavioral topics taught in a experiential format while the instructor in Figure 15 taught all the the quantitative courses in the management curriculum. The differences in the scores may not be singularly attributable to individual teaching ability, but may be heavily influenced by the material covered.
2.25 2.75 3.25 3.75 4.25 4.75 201201640201335601201601201601201601201361601
Finance Faculty Member
-School Mean
Figure 10.
3 UCL 3 LCL Sample Mean 2.25 2.75 3.25 3.75 4.25 4.75 201201640201335601201601201601201601201361601
Finance Faculty - Department
Mean
Figure 11.
3 UCL 3 LCL Sample Mean 1.25 1.75 2.25 2.75 3.25 3.75 4.25 4.75 5.25 3 5 1 2 0 1 U P 2 6 4 2 1 1 8 2 0 2 U F 1 9 3 1 1 3 5 2 0 1 U F 5 6 1 1 1 8 2 0 2 F U 1 6 5 1 1 1 8 1 0 1 U F 1 8 3 1 1 1 8 2 0 2 U F 2 2 3 1 1 5 6 6 0 1 F G 2 0 8 1 2 5 7 4 0 1 U P 2 3 7 2 1 6 3 1 0 1 U F 2 8 3 1 2 5 7 6 0 3 G P 1 5 8 4 1 3 5 2 0 1 U F 2 1 5 2 1 3 5 6 0 2 G F 2 3 8 1 1 5 5 1 0 1 F P 1 8 3 1 2 3 1 2 0 2 U P 3 2 3 1 2 3 1 2 0 2 U F 2 3 5 1 1 5 5 6 0 1 G F 2 5 8 1 1 2 9 6 0 1 G F 3 0 8 1 1 3 5 2 0 1 F U 1 3 6 2 3 4 9 3 7 1 U P 1 6 5 3 3 6 5 1 0 1 U P 2 9 3 1 1 3 5 6 0 2 G F 1 0 8 1 1 6 3 2 0 3 U F 2 4 5 3 1 6 3 2 0 2 U F 1 5 4 2 2 3 1 2 0 2 U F 2 5 5 1 1 1 8 2 0 2 U F 1 2 3 1 1 6 3 1 0 1 U F 2 1 1 2 1 5 5 6 0 1 G F 3 5 8 1 2 2 4 3 3 3 U P 2 2 6 2 2 8 7 1 0 1 U P 2 8 1 1 1 0 4 2 1 0 F P 1 9 5 2 1 2 9 2 5 5 U F 1 5 6 4 2 5 4 2 4 0 U P 1 8 5 2 1 0 4 6 0 2 U F 2 6 8 1 2 8 7 1 0 1 U P 1 8 3 1 1 0 2 2 0 2 U F 2 3 5 1 1 5 5 6 0 1 G F 1 6 8 1 1 6 3 1 0 1 U F 2 5 3 1 2 8 7 1 0 1 U P 2 6 2 2 1 0 2 2 0 2 U F 2 2 3 1 1 6 3 1 0 1 F U 2 0 3 1 2 2 4 3 3 3 U P 2 9 6 3 2 2 4 3 0 1 U P 3 1 5 2 1 5 6 4 3 3 U F 1 6 5 3 1 0 2 2 6 0 U F 1 9 5 4 2 5 7 3 0 1 U P 8 5 3 2 8 7 1 0 1 U P 2 3 2 1 3 0 0 2 4 0 U P 1 7 5 2 1 6 3 2 0 3 U F 2 2 5 2 1 6 3 1 0 1 F U 2 0 3 1 1 5 6 1 0 1 U F 2 0 3 1 3 0 0 2 4 0 U P 2 3 5 2 1 5 5 5 0 1 G F 7 8 1 1 3 2 3 3 2 U F 1 9 5 3 1 0 2 2 0 2 U F 2 3 5 1 3 0 0 1 0 1 P U 5 3 1 1 1 0 2 2 0 2 U F 2 7 4 1 1 0 2 2 0 2 U F 3 3 4 1 1 5 6 4 3 5 U F 1 2 6 3 2 8 7 4 0 1 U P 1 4 6 2 2 8 7 2 0 3 U P 6 4 2 3 0 0 2 4 0 P U 1 5 5 3 1 1 8 3 7 0 U F 7 5 4
Management Six Semesters
-Department Mean
Figure 13.
CONCLUSIONS AND FUTURE RESEARCH
Statistical Control Charts offer a new method for a comprehensive evaluation of teaching effectiveness. They can provide insights not only on idividual instructor’s effectiveness, but allow for the consideration of possible Additional explanatory variable such as the course taught, course and student status, expected grade, and class size. The purpose of any true assessment system should be to provide a basis for total system improvement rather than just a reward or punishment program for individuals.
In Table 5 we present a summary of the outliers for each department using the school mean and department mean as a standard. We have also included data for outliers above and below the two standard deviation levels because those values are often included in heuristic evaluations of SPC systems. It is clear that the selection of either standard leads to different results and that this must be considered when selecting a standard for evaluation.
A careful review of the data in Table 5 points to several areas of future research. The total number of outliers appear to be “excessive”, beyond the expected numbers. This may be due to the fact that the system is not in statistical control, that is to say, there are multiple sources of variation (type of course, course and student status, expected grade, etc.) that prevents a truly stable system. The authors are currently investigating how these sources can be identified and a stable system created so that true outliers can be identified.
Part of this investigation has identified an issue that has not been discussed in any prior piece of research in this voluminous literature – this the question of assumption of normality in the data. It appears the the scores for Teaching Ability and other items in this assessment instrument are not normal in their distribution. This may well be the reason for our findings of the system not being in control. The authors are investigating the use of transformations of the data and the use of statistical process control charts for non-normal data.
2.00 2.50 3.00 3.50 4.00 4.50 5.00 5.50
202 202 202 202 202 202 202 202 202 202 202 260 315 202 202 392 202 202 202 315
Management Faculty 1
-School Mean
Figure 14.
3 UCL 3 LCL Sample Mean
1.90 2.40 2.90 3.40 3.90 4.40 4.90 5.40
201 401 201 201 201 602 201 201 602 201 201 602 201 602 602
Management Faculty Member
2 - School Mean
Figure 15.
Table 5: Summary Comparison of SPC Chart Results
Accounting Economics Finance Management
School Mean
Depart. Mean
School Mean
Depart. Mean
School Mean
Depart. Mean
School Mean
Depart. Mean
Under 2 LCL 35 29 37 49 32 26 50 41
% Under 2 LCL 19.34% 16.02% 14.12% 19.22% 28.32% 23.0% 27.03% 22.16%
Under 3 LCL 12 16 21 33 21 12 26 23
% Under 3 LCL 6.63% 8.84% 8.24% 12.94% 18.58% 10.6% 14.05% 12.43%
Over 2 UCL 26 29 81 56 17 28 51 51
% Over 2 UCL 14.36% 16.02% 31.71% 21.96% 15.04% 24.8% 27.57% 27.57%
Over 3 UCL 11 10 30 17 8 18 20 24
% Over 3 UCL 6.08% 5.52% 11.76% 6.67% 7.08% 15.93% 10.81% 12.97%
Appendix 1
You are a: Freshman Sophomore Junior Senior Graduate Student
Is this course: Required for
Core
Required
for Major Elective
Rate the instructor’s teaching ability in
this class Poor Fair Good Very Good Excellent
How are you doing in keeping up with assignments and readings – Percent complete:
0-20% 21-40% 41-60% 61-80% 81-100%
Expected Grade: A B C D F
I have become more competent in this area due to this course.
Strongly Agree 1
Agree 2
Neither 3
Disagree 4
Strongly Disagree 5
I have increased my overall knowledge of the subject matter.
Strongly Agree 1
Agree 2
Neither 3
Disagree 4
Strongly Disagree 5
I feel challenged intellectually by this course.
Strongly Agree 1
Agree 2
Neither 3
Disagree 4
Strongly Disagree 5
The instructor presents the material too rapidly.
Strongly Agree 1
Agree 2
Neither 3
Disagree 4
Strongly Disagree 5
The instructor gives assignments are too difficult.
Strongly Agree 1
Agree 2
Neither 3
Disagree 4
Strongly Disagree 5
The instructor is available to provide extra help.
Strongly Agree 1
Agree 2
Neither 3
Disagree 4
Strongly Disagree 5
The instructor provides clear answers to the student questions.
Strongly Agree 1
Agree 2
Neither 3
Disagree 4
Strongly Disagree 5
The instructor encourages class discussion.
Strongly Agree 1
Agree 2
Neither 3
Disagree 4
Strongly Disagree 5
The instructor brings current ideas to the classroom.
Strongly Agree 1
Agree 2
Neither 3
Disagree 4
Strongly Disagree 5
The instructor has the course well organized.
Strongly Agree 1
Agree 2
Neither 3
Disagree 4
Strongly Disagree 5
The instructor summarizes main points and provides emphasis on material.
Strongly Agree 1
Agree 2
Neither 3
Disagree 4
Strongly Disagree 5
The instructor relates course concepts in systematic fashion.
Strongly Agree 1
Agree 2
Neither 3
Disagree 4
Strongly Disagree 5
The instructor seems to enjoy teaching. Strongly Agree
1
Agree 2
Neither 3
Disagree 4
Strongly Disagree 5
The instructor is friendly and considerate to students.
Strongly Agree 1
Agree 2
Neither 3
Disagree 4
Strongly Disagree 5
The instructor is enthusiastic about the course material.
Strongly Agree 1
Agree 2
Neither 3
Disagree 4
Strongly Disagree 5
REFERENCES
1. Aigner, Dennis J., and Frederick D. Thum. 1986. On student evaluation of teaching ability. Journal of
Economic Education 17 (4): 243-265.
2. Aleamoni, L.M. 1999. Student rating myths versus research facts from 1924 to 1998. Journal of
Personnel Evaluation in Education 13 (2): 153-166.
3. Al-Issa, A. & Sulieman, H. 2007. Student evaluations of teaching: perceptions and biasing factors. Quality
Assurance in Education 15 (3): 302-317.
4. Bledsoe, R., 1971. Factors Related to Pupil Observation and Attitudes Toward Their Teacher. Journal of
Educational Research.(November): 119-126.
5. Braskamp, L., Brandenburg, D. and Ory, J. 1984. Evaluating Teaching Effectiveness: A Practical Guide.
Newbury park, CA: Sage.
6. Bures, A., 1990. An Empirical Study of Accounting Faculty Evaluation Systems. The Accounting
Educators Journal (Summer):68-76
7. Cashin, W. 1995. Student Ratings of Teaching: The Research Revisited. IDEA paper No. 20. Center for
Faculty Evaluation and development, Kansas State University.
8. Caskin, W., 1983. Concerns About Using Student Ratings in Community Colleges. In Evaluating Faculty
and Staff: New Directions for Community Colleges, edited by A. Smith, San Francisco, CA: Jossey-Bates.
9. Centra, J. 1993. Reflective Faculty Evaluation: Enhancing Teaching and Determining Faculty
Effectiveness. San Francisco: Jossey-Bass.
10. Clayson, Dennis E., and Mary Jane Sheffet. 2006. Personality and the student evaluation of teaching.
Journal of Marketing Education 28 (2): 149-160.
11. Comm, C.L., and Mathaisel, D. 1998. Evaluating teaching effectiveness in America's business schools:
implications for servicemarketers. Journal of Professional Services Marketing 16 (2): 163-170.
12. D’Apollonia, S. and Abrami, P. 1997. Navigating Student Ratings of Instruction. American Psychologist 52
(11): 1198-1208.
13. Deberg, C., and Wilson, J. 1990. An Empirical Investigation of the Potential Confounding Variables in
Student Evaluation of Teaching. Journal of Accounting Education (Spring) : 37-62.
14. Dee, Kay C., 2007. Student Perceptions of High Course Workloads are Not Associated with Poor Student
Evaluations of Instructor Performance. Journal of Engineering Education 96(1), 69-78.
15. Feldman, K.A. 1984. Class size and college students’ evaluations of teachers and courses: a closer look.
Research in Higher Education 21 (1): 45-116.
16. Feldman, K.A. 1978. Course characteristics and variability among college students in rating their teachers
and courses: A review and analysis. Research in Higher Education 9: 199-242.
17. Frost, P. and Fukami, C. 1997. Teaching Effectiveness in the Organizational Sciences: Recognizing and
Enhancing the Scholarship of Teaching. Academy of Management Journal 40 (6): 1271-81.
18. Gappa, J. 1984. Employing Part-Time faculty: Thoughtful Approaches to Continuing Problems. AAHE
Bulletin, 37 (2): 3-7.
19. Glynn, Joseph G., Paul L. Sauer, and Gregory R. Wood. 2006. Dimensionality of a student evaluation of
teaching scale: A ten year review. Academy of Educational Leadership Journal 10 (2): 45-53.
20. Greenwald, A. 1993. Validity Concerns and Usefulness of Student Ratings of Instructors. American
Psychologist 52 (11): 1182-6.
21. Hewett, L., Chastain, G., and Thurber, S., 1988. Course Evaluations: Are Students’ ratings Dictated by
First Impressions? Paper presented at the Rocky Mountain Psychology Association. April 21-22, Snowbird, Utah.
22. Hobson, S. M., & Talbot, D. M. 2001. “Understanding student evaluations.” College Teaching 49(1),
26-31.
23. Isely, Paul., & Singh, Harinder. (2005). Do Higher Grades Lead to Favorable Student Evaluations? Journal
of Economic Education 36 (1): 29-42.
24. Leslie, D., Kellams, S., and Gunne, G. 1982. Part-time Faculty in American Higher Education. New York:
Praeger Publishers.
25. Marks, N. and O’Connell, R. 2003 Using Statistical Control Charts to Analyze Data from Student
26. Marsh, H.W. 1987. Students’ evaluations of university teaching: Research findings, methodological issues,
and directions for future research. International Journal of Educational Research 11 Whole Issue No. 3).
27. Martin, J. 1998. Evaluating Faculty Based on Student Opinions: Problems, Implications and
recommendations from Deming’s Theory of management Perspective. Issues in Accounting Education. 13
(4): 1079-94.
28. McKeachie, W. 1931. Student Ratings of Teaching. (ACLS Occasional Paper No. 33). The Professional
Evaluation of Teaching. (http://www.acls.org/op33.htm
29. McPherson, Michael A. 2006. Determinants of how students evaluate teachers. Journal of Economic
Education 37(1): 3-21.
30. Mehdizadeh, Mostafa, 1990. Loglinear models and student course evaluations. Journal of Economic
Education 21 (1): 7-21.
31. Morgan, Donald A., John Sneed and Laurie Swinney. 2003. Are student evaluations a valid measure of
teaching effectiveness: Perceptions of accounting faculty members and administrators. Management
Research News 26 (7): 17-32.
32. Mulford, C., and Schneider, A. 1988. An empirical study of structural and controllable factors affecting
faculty evaluations. Advances in Accounting 205-215.
33. Naftulin, D., Ware, J., and Donnelly, F. 1973. The Dr. Fox Lecture: A Paradigm of Educational Seduction.
Journal of Medical Education. 48 (July): 630-35.
34. Nelson, Jon P., and Kathleen A. Lynch. 1984. Grade inflation, real income, simultaneity, and teaching
evaluations. Journal of Economic Education 14 (1): 21-37.
35. Newton, J. 1988. Using Student Evaluation of teaching I Administrative Control: The Validity Problem.
Journal of Accounting Education. 1-14.
36. Orsini, D. and Bush, R. 1987. The Propensity of College Students to Modify Course Expectations and Its
Impact on Course Performance Information. Journal of Marketing Education. 9 (Spring): 42-52.
37. Paswan, Audhesh, K., Young,Joyce A . 2002. Student evaluation of instructor: A nomological
investigation using structural equation modeling. Journal of Marketing Education 24(3): 193-202.
38. Richardson, J. T. E. (2005). Instruments for obtaining student feedback: A review of the literature.
Assessment & Evaluation in Higher Education 30(4): 387-415.
39. Seldin, P. 1993. The use and abuse of student ratings of professors. Chronicle of Higher Education 39
(46): A40.
40. Smith, G. & Anderson, K.J. 2005. Students’ ratings of professors: The teaching style contingency for
Latino/a professors. Journal of Latinos and Education 4(2): 115-136 (in Smith).
41. Sopher, John C., 1973. Soft research: Student evaluations reconsidered. Journal of Economic Education 5
(1): 22-26.
42. Stapelton, Richard J., and Gene Murison. 2001. Optimizing the fairness of student evaluations: A study of
correlations between instructor excellence, study production, learning production, and expected grades.
Journal of Management Education 25 (3): 269-291.
43. Stratton, Richard W., Myers, Steven C., and King, Randall H. 1994. Faculty behavior, grades, and student
evaluations. Journal of Economic Education 25 (1): 5-15.
44. Wallace, j. and Wallace, W. 1998. Why the Costs of Student Evaluations have Long Since Exceeded Their
Value. Issues in Accounting Education 13 (2), 443-7.
45. Watchtel, H.K. 1998. Student evaluation of college teaching effectiveness: A brief review. Assessment
and Evaluation in Higher Education 23(2): 191-211.
46. Wilson, R. 1998. New research casts doubt on value of student evaluations of professors. The Chronicle of