FORMULATIO DEVELOPMET AD EVALUATIO OF
SUSPESIO OF GATIFLOXACI USIG SUSPEDIG
AGET
Rajendra Jangde1*, Sanjay J. Daharwal1, Ram Kumar Sahu2, Jagdish Singh3
1. University Institute of pharmacy, Pt. Ravishankar Shukla University, Raipur (C.G.)-492010, India,
2. Department of Pharmacognosy, Oriental College of Pharmacy, Bhopal (M.P.)-462021, India.
3. Department of Technical Education, Govt. of Punjab, Chandigarh, India.
For e. mail correspondence: rjangdepy@gmail.com
Summary
In the present investigation, an attempt has been made for formulation and evaluation of gatifloxacin suspension by adding acacia powder in different ratio in all five formulations. The five suspensions (F1 to F5) of gatifloxacin were prepared by using different ratio of acacia powder (0.5, 1.0, 1.5, 2.0, and 2.5% w/v). These formulations were evaluated for sedimentation volume, pH measurement, viscosity measurement, particle size, and drug release at various time intervals for 3 months. As part of preformulation studies, FT-IR and Differential scanning calorimetry was used to investigate the physicochemical compatibility between gatifloxacin and various excipients used in suspension manufacturing. The gatifloxacin was found to be compatible with different excipients. The results of the study indicated on increasing the concentration of acacia powder in suspensions improved the physical stability. Formulation F3 and F5 shows satisfactorily physical stability while F4 containing 2.0% w/v concentration of acacia showed better physical stability, and was found to be optimum concentration. Among the formulated suspensions F4 showed better in vitro drug release profile as well as better physical stability compared to other
formulated suspensions.
Keywords: Gatifloxacin, suspension, excipients, compatibility
Introduction
It should be used only to treat or prevent infections that are proven or strongly suspected to be caused by bacteria. As a result, it is approved by the Food and Drug Administration for the treatment of community- acquired pneumonia, acute bacterial exacerbations of chronic bronchitis, sinusitis, and urinary tract infections. The gatifloxacin is commercially available only as tablets may be because of its bitter taste and instability in liquids. A number of patients, especially pediatric and geriatric patients, have difficulty in swallowing solid dosage forms hence formulation of a suspension will be most suitable but product may not be physically and chemically stable [3-6].
A major challenge to formulation of oral suspensions is that of thermodynamically unstable, thus, making it necessary to include in the dosage form, a stabilizer or suspending agent which reduces the rate of settling and permits easy redispersion of any settled particulate matter both by protective colloidal action and by increasing the consistency of the suspending medium. Suspending agents may be inorganic materials, synthetic compounds, or polysaccharides. Natural gums or synthetic polymer have been wildly used as tablet binders, emulgents and thickeners in cosmetics and suspensions as film-forming agents and transitional colloids [7,8]. Gatifloxacin was chosen for this investigation because it is a typical representative of practically insoluble drug which would require a suspending agent to be formulated as liquid dosage form. Present study shows the effect on physical stability of gatifloxacin suspension which also includes formulation and evaluation.
Materials and Methods
Materials: Gatifloxacin was received as gift sample from Dr. Reddy Pvt. Limited, Hyderabad, India. The Polyvinyl alcohol (PVA), Methylparaben, Hydroxypropyl methylcellulose (HPMC) and Acacia were procured from Loba Chemie, Pvt. Ltd. Mumbai.All other chemicals and reagents used in the study were of analytical grade.
Physico-chemical characterization of the drug-polymer mixtures
Fourier transforms infrared radiation measurement (FT-IR): FT-IR spectra of drug and drug-excepients blend were recorded on an FT-IR spectrophotometer (Shimazdu, 8400S and Shimazdu Corporation) in the frequency range between 4000 and 500 cm-1.
Differential scanning calorimetry (DSC) study: Differential scanning calorimetry study of suspension was performed using a Diamond (Mettler Star SW 8.10) DSC to determine the drug excipients compatibility study. The analysis was performed at a rate 10 ºC min-1 from 25 to 300 0C temperature range under nitrogen flow of 25 mL min-1 [9,10].
Evaluation of suspension
Sedimentation volume: Sedimentation volume (F) is a ratio of the final volume of sediment (Vu) to the original volume of sediment (Vo) before settling. 50ml of each suspension were transferred to 50 ml measuring cylinders and the volume of sediment formed was noted at every 24 hr for 7 days. The sedimentation volume F (%), was calculated using the formula:
F = 100 Vu/ Vo
Viscosity measurement: The viscosity of the samples was determined at 25oC using the Brookfield Synchro- lectic viscometer, model LVF (Brookfield Laboratories, Massachusetts) at 30 revolution/min (Spindle ≠ 4).
Particle size measurement: The particle size of gatifloxacin particles in the prepared suspensions was measured by optical microscopy using a trinocular microscope at 100x (10×10) magnification. The size of 100 particles were measured and the average particle size of was determined.
Drug release: The release studies were carried out at 37± 0.5oC by using a beaker method rotating cellophane membrane apparatus. A 1000 ml volume of the 0.1N HCL of the release media. The cellophane membrane containing 5.00 ml of solution or a suspension of the suspension salt was placed inside the vessel at time zero. Release of the drug salt from the cellophane membrane into the aqueous sink condition studied from the following type of test preparation; (i) a solution of the salt, (ii) salt suspensions, (iii) suspensions formed in situ in cellophane membrane cell. Salt solutions were obtained from dissolving in 0.1 N HCL. After 15 min taking 5 ml solution was withdrawn and maintained sink condition. Samples were withdrawn after time interval 30, 45, 60, 75, 90, 105, 120 and 135 min. Maintaining sink condition, the taking solutions were further diluted with 0.1 N HCL and absorbance measured in double beam UV-spectrophotometer (Schimadzu, UV-1700 and Schimadzu Corporation) [14-18].
Results
Compatibility testing of drug with polymer
Differential scanning calorimetry: The Figure 2 shows different DSC thermogram for drug and drug with different polymers. DSC thermogram showed that there was no any major difference in onset temperature and peak temperature, when compared with pure drug thermogram. In majority of the cases, melting endotherm of drug was well preserved with slight changes in terms of broadening or shifting towards the lower temperature. It has been reported that the quantity of material used. Especially in drug-excipients mixtures, affects the peak shape and enthalpy. Thus the minor changes in the melting endotherm of drug could be due to the mixing of drug and excipients, which lower the purity of each component in the mixture and may not necessarily, indicate potential incompatibility. Hence, it was confirmed that there was no incompatibility between drug and various polymers.
Evaluation of suspension
Sedimentation volume: The sedimentation volume of F1 to F5 was found to be 99.75%, 97.31%, 96.25%, 98.45% and 97.14% respectively at the end of 24 hours (Table 2). After one week suspension F1 found in a clumpy mass which was not pourable from the container, while F2 resulted clumpy mass after one month. After long time it was found that, in F3 to F5 the sedimentation volume gradually decreases from 96.25% to 37.26%, 98.45% to 83.15% and 97.14% to 81.40% respectively. The formulation F3 to F5 revealed good flow from container. This indicates that on increasing the concentration of suspending agent it increases the stability of suspensions.
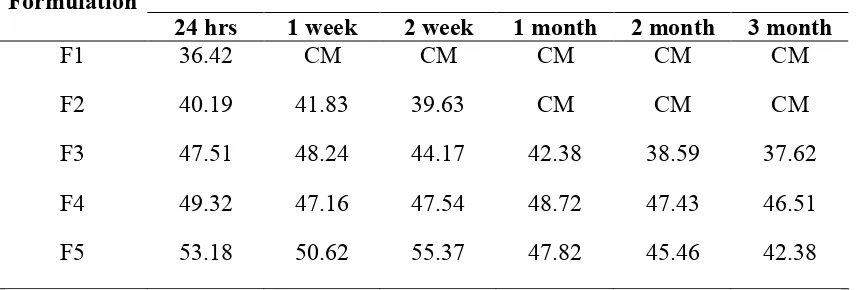
Viscosity measurement: The formulation F1 has clumpy mass so that it fails to measure the viscosity, while F2 shows decrease in viscosity during 24 hrs to 2 weeks but it fail to measure the viscosity of suspension after one month. When the concentration of suspending agent increased from F3 to F5, a slight increase in viscosity was found (Table 3). When solution kept for long time the viscosity of F3, F4 and F5 has decreased from 47.51, 49.32 and 53.18 to 37.62, 46.51 and 42.38 respectively. The change in viscosity in case of F4 was less indicating that F4 is relatively a stable formulation.
pH: The pH value of F1 was found to be 7.12, when it kept for long time formulation exhibited in a clumpy mass so that determination of pH was not possible. The other formulations F2 to F5 showed a more or less constant pH value. This indicates that there is no chemical change when kept for long time except F2 (Table 5).
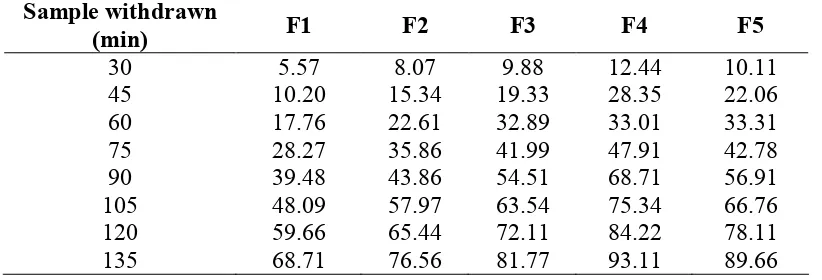
Drug release: All the formulations showed acceptable properties as shown in table 6.
The result of the drug release study indicating that F1 and F2 released 68.71 and 76.56 at the end of 135 min, respectively. Formulation F3, F4 and F5 released 81.77, 93.11 and 89.66 at the end of 135 min (Table 6). The results indicated that F4 release maximum drug in media.
Discussion
The suspension F1 to F5 was prepared by adding different concentration such as 0.5, 1.0, 1.5, 2.0, and 2.5% w/v of compound acacia powder. These formulations were evaluated for various quality parameters to determine their stability such as sedimentation volume, viscosity, particle size, pH and drug release for 3 months time in regular intervals. The data obtained from the determination of sedimentation rates revealed that the formulations prepared with higher concentration of acacia possessed higher sedimentation volume when compared with other formulations. Among the five formulations of suspension, the F4 showed nearby constant sedimentation volume after two week, this indicates more stable suspensions. When the concentration of suspending agent increases in suspensions a slight increase in viscosity was found. When kept the suspension for long time, the change in viscosity in case of F4 was less indicating that F4 is relatively a stable formulation. With increasing the concentration of suspending agent, the particle size of the suspension was found to be decreased except F5. The pH values of all the formulations were complied as per I.P. requirements. Suspensions formulation (F4) employing 2.0% concentration acacia gave higher drug release rate among all the formulations. Hence 2.0% concentration of acacia was found to be optimum concentration.
Conclusion
The results of the study indicated on increasing the concentration of acacia powder in suspensions improved the physical stability. Among the formulated suspensions F4 showed better in vitro drug release profile as well as better physical stability
compared to other formulated suspensions.
Acknowledgements
Table 1: Formulations of Gatifloxacin oral suspension
Formulations (gm) S. o. Ingredient
F1 F2 F3 F4 F5
1 Drug 10 10 10 10 10
2 Tween80 1.0 1.0 1.0 1.0 1.0
3 Methylparabean 1.0 1.0 1.0 1.0 1.0
4 PVA 0.5 0.5 0.5 0.5 0.5
5 Acacia 0.5 1.0 1.5 2.0 2.5
6 HPMC 1.0 1.0 1.0 1.0 1.0
7 Sucrose 2.25 2.25 2.25 2.25 2.25
8 Purified water q.s. q.s. q.s. q.s. q.s.
HPMC-Hydroxypropyl methylcellulose; PVA-Polyvinyl alcohol
Table 2: Values of sedimentation volume (%) suspension using different concentration suspending agents
Sedimentation volume (%) Formulation
24 hrs 1 week 2 week 1 month 2 month 3 month
F1 99.75 CM CM CM CM CM
F2 97.31 85.52 78.19 CM CM CM
F3 96.25 48.24 44.17 42.38 38.59 37.62
F4 98.45 85.19 83.67 83.48 83.74 83.15
F5 97.14 88.35 87.43 87.12 84.56 81.40
CM- Formation of clumpy mass
Table 3: Viscosity values of different formulations for 3 month period
Viscosity (25 rpm.) in cps Formulation
24 hrs 1 week 2 week 1 month 2 month 3 month
F1 36.42 CM CM CM CM CM
F2 40.19 41.83 39.63 CM CM CM
Table 4: Particle size determination values of different formulations for 3 month period
Formulation 24 hrs 1 week 2 week 1 month 2 month 3 month
F1 59.34 CM CM CM CM CM
F2 52.12 51.38 52.62 CM CM CM
F3 47.75 43.15 44.53 42.81 42.62 38.28
F4 42.54 38.27 33.19 33.59 32.48 32.16
F5 48.67 46.52 45.31 44.72 44.17 42.39
CM- Formation of clumpy mass
Table 5: pH values of different formulations for 3 month period
pH Formulation
24 hrs 1 week 2 week 1 month 2 month 3 month
F1 7.12 CM CM CM CM CM
F2 6.24 6.36 6.28 CM CM CM
F3 6.53 6.41 6.74 6.12 6.25 6.08
F4 6.75 6.84 6.57 6.72 6.67 6.75
F5 6.15 6.10 5.98 6.28 6.16 6.18
CM- Formation of clumpy mass
Table 6: Drug release of Gatifloxacin suspensions in 0.1 HCL
Sample withdrawn
(min) F1 F2 F3 F4 F5
30 5.57 8.07 9.88 12.44 10.11
45 10.20 15.34 19.33 28.35 22.06
60 17.76 22.61 32.89 33.01 33.31
75 28.27 35.86 41.99 47.91 42.78
90 39.48 43.86 54.51 68.71 56.91
105 48.09 57.97 63.54 75.34 66.76
120 59.66 65.44 72.11 84.22 78.11
(a)
(b)
45 50 55 60 65 70 75 %T
500 1000
1500 2000
3000 4000
1/cm 65
70 75 80 85 90 95 100 105 110 115 120 125 %T
(d)
Figure 1: FT-IR spectra of pure (a) Gatifloxacin, (b) Gatifloxacin+ Acacia, (c) Gatifloxacin+ PVA and (d) Gatifloxacin + HPMC
a b
c d
Figure 2: DSC thermograms of pure (a) Gatifloxacin, (b) Gatifloxacin+ Acacia, (c) Gatifloxacin+ PVA and (d) Gatifloxacin + HPMC
500 1000
1500 2000
3000 4000
1/cm 65
70 75 80 85 90 95 100 105 %T
References
1. Atyabi F, Sharma HL, Mohammad HA and Fell JT. Controlled drug release from coated
floating ion exchange resin beads. J Control Release 1996; 42: 25–28.
2. Siahi MR, Barzegar‐Jalali M, Monajjemzadeh F, Ghaffari F, Azarmi S. Design and
evaluation of 1‐ and 3‐Layer matrices of verapamil hydrochloride for sustaining its
release. AAPS Pharm Sci Tech 2005; 6(4): E626‐632.
3. Shah VN, Karavadara NR, Shah DS, Shah BK. Gatifloxacin-induced prolongation of
QTC interval. Indian Journal of Pharmacology 2006; 38(1): 60-61.
4. Perry CM, Barman Balfour JA, Lamb HM. Gatifloxacin. Drugs 1999; 58(4): 683-696.
5. Takei M, Fukuda H, Yasue T. Inhibitory activities of gatifloxacin (AM-1155), a newly
developed fluoroquinolone, against bacterial and mammalian type II topoisomerases. Antimicrobial Agents Chemotherapy 1998; 42(10): 2678-2684.
6. Jones RN, Croco MAT, Pfaller MA. Antimicrobial activity evaluations of gatifloxacin, a
new fluoroquinolone: contemporary pathogen results froma global antimicrobial resistance surveillance program (SENTRY, 1997). Clin Microbiol Infect 1999; 5(9): 540-546.
7. Zografi G, Schott H, Swarbric J. In: Remington’s Pharmaceutical Sciences. Philadelphia
College of Pharmacy and Science, Mack Publication, 1990; 257.
8. Odeku OA, Akinlosotu OD. A preliminary evaluation of khaya gums as an emulsifying
agent. West Africa J. Pharm 1997; 11: 30-33.
9. Macedo RO, Nascimento TG. Thermo analytical study of glinbenclamide and excipients.
Thermochim Acta 2002; 392: 687.
10. Joshi BV, Patil VB, Pokharkar VB. Compatibility Studies between cabamazepine and
tablet Excipients. Drug Dev Ind Pharm 2002; 28: 687-690.
11. Suthar AM, Patel MM. Formulation and Evaluation of taste masked Suspension of
Metronidazole. Int J App Pharma 2011; 3(1): 16-19.
12. Akram M, Naqvi SBS, Gauhar S. Development of new ophthalmic Suspension
prednisolone acetate 1%. Pak J Pharm Sci 2010; 23(2): 149-154.
13. Ancha MJ, Kumar KLS and Jackson DD. Formulation and Evaluation of pediatric
azithromycin suspension. Int J Pharm Bio Sci 2010; 1(2): 1-4.
14. Ganesan V, Sandhya KG and Remi SL, Physical stability and dissolution rate of
flurbiprofen suspension employing its solid dispersions. The Ind Pharmacist 2004; 3(23): 59-62.