A
A CRITICAL REVIEW OF THEIR CONSTITUTION
AND PROPERTIES
By
A.
s.
Darling,
Ph.D., A.M.1.Mech.E. Research Laboratories, Johnson Matthey & Co. LimitedOwing to their extensive employment, alloys of rhodium and platinum have an industrial significance greater than that of any other noble metal system.
Rhodium was first isolated in the opening years of the nineteenth century, and shortly after this Russia began to devclop her plati- num resources in the Urals. Ore from this source frequently contained twelve times as much iridium as rhodium. Platinum-rhodium- iridium alloys, obtained by the direct fusion of crude platinum, were found to be very resistant to corrosion and were frequently employed for coinage and for chemical plant
Interest in the binary rhodium-platinum alloys developed only after Le Chatelier's demonstration in 1887 that reproducible temperature measurements could be obtained with the 10 per cent rhodium-platinum thermocouple (3). Since 1927 the Inter- national Temperature Scale, over the range
660" to 1063°C has been defined in terms of the e.m.f. generated by the 10 per cent rhodium-platinum thermoelement, and in- dustrial pyrometry depends very largely upon the thermal stability of this alloy system.
The Constitutional Diagram
Immediately below the solidus platinum and rhodium form a continuous series of solid solutions. The true equilibrium structure at lower temperatures is still uncertain. The first melting point determinations were made by Wartenberg in 1910 (4). Twenty years later Feussner and Miiller used a photo- electric pyrometer for melting point deter- (1, 2).
minations which embraced the entire com- position range (5). Only one arrest point was detected, and the authors concluded that solidus and liquidus curves were very close together. Acken's melting point determina- tions, reported in 1934(6), were made with a disappearing filament pyrometer. The impurity content of the materials employed was probably less than 0.001 per cent. The pyrometer was focused on the bottom of an axial hole drilled in 75 g ingots which were slowly heated in thoria crucibles in a high frequency furnace. Alloys containing less than 40 per cent of rhodium were melted in air, those of higher rhodium content being vacuum melted. As in the work of Feussner and Miiller, only one melting arrest was detected. Acken's results were, in general, approximately 20°C higher than those of the German investigators. Both sets of values, together with the recently determined melting points of platinum and rhodium (7, 8) are plotted on the diagram in Fig. I . The shape
of this curve suggests the existence, imme- diately beneath it, of a continuous series of solid solutions. X-ray determinations, first reported by Weerts in 1932 (g), repeated by Goldschmidt and Land in 1947 (IO), and confirmed by Raub (I I), showed that in this region the lattice parameter/atomic compo- sition curve had only a slight positive dlevia- tion from linearity. Fig. 2 illustrates Raub's
X-ray diffraction data.
Although Acken was unable to detect any phase changes in his alloys, he concluded that slight irregularities in melting points, Brine11 hardness, resistivity and thermoelectric force
WEIGHT PER CENT RHODIUM
Fig. 1 Constitutional diagram of the rhodium-platinum system
might indicate some departure from complete miscibility. Nemilov and Voronov (12), on the other hand, concluded that the physical and metallurgical characteristics of the system were those of a typical solid solution. A detailed study of the evidence suggests that the system may not be so simple as hitherto supposed. Hildebrandt’s magnetic suscepti- bility measurements (13), when plotted as a
function of composition, exhibit a fairly sharp inflexion over the range 20-25 atomic per cent rhodium. Although originally interpreted as being indicative of an order-disorder reaction, this behaviour could be caused by a simple change in solubility. Wide miscibility gaps are exhibited in the platinum-iridium, palladium- rhodium and palladium-iridium systems, and Raub ( I I) predicts the occurrence of a similar
3 92
ul z t
I 3.88
z a
x W
c
W
5
3 8 4U
4
(L
W
2
c
3
3.803 . 7 9
ATOMIC P E R CENT RHODIUM
Fig. 2 Lattice parameter curve for rhodium-platinum alloys rapidly cooled from below the solidus (Reference 11)
gap, having a critical tem- perature of approximately 780°C in the platinum- rhodium system.
Allotropic modifications in pure rhodium have been reported by several investi- gators but the evidence is not conclusive. Jaeger and Zanstra (14) concluded that alpha rhodium, stable up to 12oo0C, had a simple cubic structure of lattice parameter 9.211A, while beta r h o d i u m , s t a b l e a b o v e
IZOOOC,
had a face centredTEMPERATURE
ATOMIC PER CENT RHODIUM
3
f 2 0=
15 0a
u-
W U
z
4
I-
ul
w
R !!! 10
u
k 5
n U
w II)
2 0 4 0 6 0 8 0 100
ATOMIC PER CENT RHODIUM
Fig. 3 Resistivity and temperature coeficient of annealed rhodium-platinum alloys
cubic structure with a 3.7957A. Simi- lar findings were reported by E. T. Dixon (15) and Jaeger and Rosenbohm (16). Rudnitsky, Polyakova and Tyurin (17) studied the thermoelectric behaviour of rhodium by a refined thermoelectric technique and con- cluded in 1956 that the alpha-beta trans-
formation occurred at 1030" 35°C. Although constitutional studies in the palladium- rhodium system (18) appeared to confirm this temperature, more recent work by Raub, Beeskow and Menzel(19) did not show any change of crystal structure in rhodium up to 15ooOC. The high temperature lattice para- meter data of Raub and his co-workers dis- agree with those of Bale (20:1, and the subject could be profitably investigated in greater detail.
Electrical Properties
Fig. 3, based on the work of several investi- gators, indicates that the highest resistivity of the series, approximately 30 microhm-cm, is developed by alloys containing approximately 30 atomic per cent of rhodium. The 45 atomic per cent alloy has the lowest temperature coefficient. An interesting feature of the
resistivity curve is the slight nega- tive inflexion over the range 70 to 80 per cent rhodium which has been confirmed by several workers. Although no systematic ex- periments on the effect of heat treatment have been reported, the resistivities of quenched and slowly cooled alloys are not appreciably different.
Resistance variations at high temperatures are presented in Fig. 4, which illustrates the nega- tive curvature of the pure rhodium line first observed by Holborn and Wien in 1895 (21).
Thermoelectric Properties
The thermoelectric properties of rhodium-platinum alloys have been the subject of fundamental and industrial concern since the pioneer work ofLe Chatelier in 1886 (22). Holborn and Wien
(z1,23) demonstrated the stability of rhodium- platinum thermoelements over the period 1892-1899, and concluded that the 10 per cent rhodium or Le Chatelier couple com-
9 0
7 . 0
0
5
P3.0
I .o
5 0 0 10.00 I 5 0 0
TEMPERATURE OC
Fig. 4 High-temperature resistance variations of rhodium, platinum and two alloys (Reference 4 1 )
TEMPERATURE
COEFFICIENT
WEIGHT PER CENT RHODIUM
TEMPERATURE
-
C O E F F I C I E N T
'
R E S I S T I V I T Y
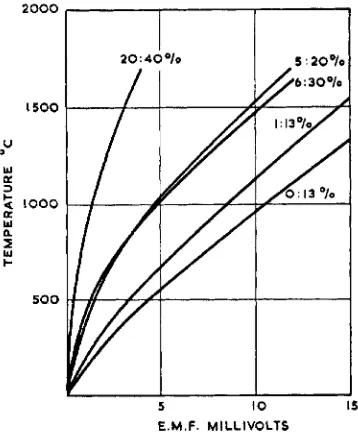
pared favourably with the platinum resistance thermometer for accurate temperature measurement. Com- menting upon the extremely rapid growth of industrial pyrometry, Henning and Moser (24) remarked that at the Physikalische Technische Reichanstalt alone 991 5 rhodium- platinum thermocouples were cali- brated between 1900 and 1930.
Fig. 5, taken largely from Caldwell's data (25), illustrates the thermo- electric force in millivolts generated between rhodium-platinum alloys and pure platinum at various tempera- tures. An important feature of these curves is the reasonably flat plateau displayed at lower temperatures by alloys containing 20 to 50 atomic per cent of rhodium. No evidence of a
phase change within the dotted area has yet been advanced.
A T O M I C PER CENT RHODIUM
Fig. 5 Thermoelectric force i n millivolts generated between rhodium-platinum alloys and pure platinum at various
temperatures (Reference 25)
The Le Chatelier thermocouple was in general use until 1922, when tests carried out by the U.S. Bureau of Standards showed that
10 per cent couples of British manufacture were less stable than their American counter- parts (26). Chemical analysis indicated the presence of up to 0.34 per cent of iron in the British alloy. Improved refining methods eliminated the iron, with the result that 13 per cent of rhodium was required to develop an e.m.f. comparable to that of the American 10 per cent couple. The 13 per cent couple
was
found to be very stable and is generally preferred in this country to the 10 per cent couple, which gives a lower e.m.f. British Standard 1826, 1952, defines the e.m.f.s generated by the two couples at temperatures up to the melting point of platinum. The values specified are based largely upon deter- minations carried out by C. R. Barber (7) at the National Physical Laboratory and represent average values maintained by manu- facturers for many years before 1950.Since I927 the 10 per cent rhodium-plati-
num : platinum thermocouple has been used to define the International Temperature Scale
over the interval from 660°C to the melting point of gold.
The high temperature stability of rhodium- platinum thermocouples is adversely affected by contamination, by slight preferential vola- tilisation of rhodium, and by gradual diffusion
of rhodium into the pure platinum limb. Although ultimate failure is usually due to attack by metallic or other vapours, prolonged heating at temperatures in the region of 1500°C may lead to appreciable change in calibration. Lead and zinc vapours, and sul-
the purest oxide refractories are not com- pletely free from this element. Experience has shown that the incidence of attack depends largely on the reduction potential of the atmosphere rather than on the silicon content of the refractory.
Silicon attack can, however, occur even when conditions do not appear to be reducing. Research on this problem was stimulated by the frequent thermocouple failures encoun- tered soon after the general introduction of the quick-immersion technique for liquid steel temperature measurement. Land (28)
and Reeve (29) confirmed that contamination did not occur in the absence of traces of oil. The complete mechanism of silicon transfer was finally established by Chaston (30)~ who showed that embrittlement was caused by the sulphur present in traces of oil left in the thermocouple. This sulphur, in the presence of carbon monoxide, reacts with the refractory to produce volatile silicon sulphide, which dissociates on the surface of the couple wires to form brittle silicides. The rhodium-plati- num limb is usually the more seriously em- brittled. The silicide forming in the rhodium alloy is a hard constituent with a bluish tint, while that in the platinum member is softer and grey in appearance (31). A further crystal boundary constituent is frequently found in the rhodium alloy. These three silicides have been studied microscopically and by X-ray diffraction techniques. A contraction of lattice parameter indicates a slight solubility of silicon in platinum but the exact composition of the silicide phases has not been precisely determined (10). This type of attack can, in practice, be avoided by baking out the steel protection tubes at dull red heat in the presence of a current of air.
Prolonged heating in air in the complete absence of sulphur can frequently induce appreciable change of thermoelectric force even though mechanical failure need not occur. The pure platinum limb of the couple is generally most affected by this type of deterioration. Chaussain (32) reported that whereas at 1300°C silica and alumina affected
the thermoelectric characteristics of pure platinum considerably more than those of the rhodium-platinum alloy, thoria appeared to be inert to both couple legs. Tests by Ehringer (33) led to similar conclusions. At
I40Ooc in air the resistance to attack by pure alumina, mullite or silica increased with rhodium contents up to 30 per cent, which was the richest alloy studied. Although reducing conditions accelerated the rate of attack, rhodium alloys in contact with pure alumina was not appreciably contaminated. Lapp and Maksimova (34) confirmed the high stability of rhodium alloys heated in contact with alumina for long periods at 1500°C.
Additional tests with alumina, beryllia, magnesia and thoria showed that all these refractories were equally stable towards rhodium-platinum, and that the most stable alloy contained 30 per cent of rhodium. Experiments by Bennett (35) had results which suggested that couple deterioration of this type may be primarily induced by im- purities in the refractory rather than by the refractory itself.
Rhodium and platinum both volatilise from
2000
I 5 0 0
U
W K
3
c
w
a 1000 a
a
2
I-5 0 0
I I
E.M.F. MILLIVOLTS
Fig. 6 Calibration curves of 1:13, 5:20, 6:30 and 20:40 per cent rhodium-platinum thermocouples compared with that of the standard 13 per cent
the surface of heated noble metal thermocouples, al- though the effect of such evaporation on the calibra- tion is frequently exagger- ated. Bennett (35), for example, has heated a com- plete platinum : 13 per cent rhodium-platinum thermo- couple between terminals in free air at 15ooOC for 30 hours. Although a total loss in weight of 16.5 per cent occurred, the e.m.f. generated at the gold point had decreased by only 3°C.
Symbol R e f e r e n c e
0 6
+
4118
-
14
I
Data on the
2 0 4 0 6 0 80 LOO
WEIGHT PER CENT RHODIUM
Fig. 7 Density of rhodium-platinum alloys
relative evaporation rates of rhodium and platinum from couple wires are rather con- tradictory. Mrs. McQuillan (36), as a result of tests carried out at 16oo0C, concluded that platinum evaporated slightly more than rhodium. Jewel1 and Knowles (37) reported a slight preferential evaporation of rhodium. The more recent results of Raub and Plate (38) indicate that rhodium evaporates from the alloy less readily than platinum.
A gradual diffusion of rhodium into the pure platinum limb is probably the most important factor contributing to the deterio- ration of thermocouples heated for long periods above 1400'C. Very slight contami- nation of the pure platinum limb by rhodium results in a pronounced decrease in the e.m.f.
generated by the couple. Rhodium is trans- ferred from the alloy limb of the couple by diffusion through the hot junction and by evaporation, the latter effect being predomi- nant. Volatilisation of rhodium from adjacent furnace windings often contributes to the deterioration of the pure platinum couple limb.
Small additions of rhodium are frequently made to the pure platinum limb to minimise the effects of rhodium diffusion. Although such additions lower the couple e.m.f., its thermal stability is greatly improved. The I per cent rhodium-platinum : 13 per cent rhodium-platinum thermocouple is sometimes used in this country (39), while the 0.5 per cent rhodium-platinum : 13 per cent rhodium- platinum thermocouple is used to a limited
Q
*
2.5
8
-
).I
x
> 2 . 0
2
m
n I-
W U
UI 2 1.5
-
2 0 0 - 150-
100-
5 0 0+
5 0TEMPERATURE 'C
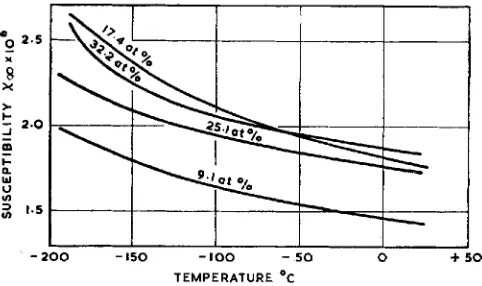
Fig. 8 Variation of mass-susceptibility with temperature for uurious rhodium-platinum alloys (Reference 13)
A
1
10 2 0WEIGHT PER CENT RHODIUM
Fig. 9 Young's modulus, modulus of rigidity, and Poisson's ratio of alloys containing up to 20 per
cent by weight of rhodium (Reference 41)
is also as high as possible, and three rhodium- platinum thermocouples of this type are now in general use. British practice favours the 5 per cent rhodium-platinum: 20 per cent rhodium-platinum couple as having the best general properties, while the 6 per cent rhodium-platinum : 30 per cent rhodium- platinum thermocouple is used in Germany
(33).
4 0
3 0
W
4
# a
g
2 0K W n
#
z
e
10WEIGHT PER CENT RHODIUM
Fig. 10 Yield point and ultimate tensile strength of annealed rhodium-platinum alloys (Reference 41)
The 20 per cent rhodium-platinum: 40 per cent rhodium-platinum thermocouple is suitable for use up to rgoo"C and has been used for measuring the temperature of oxygen- blown stainless steels (40). Fig. 6 contrasts the calibration curves of these couples with those of the standard 13 per cent rhodium- platinum couple. Because these special couples generate very low e.m.f.s at room temperature cold junctions and compensating leads are not generally required.
Physical
and
Mechanical Properties
As illustrated in Fig. 7, the density of the annealed alloys varies with rhodium content in a continuous manner over the entire com-I
20 I
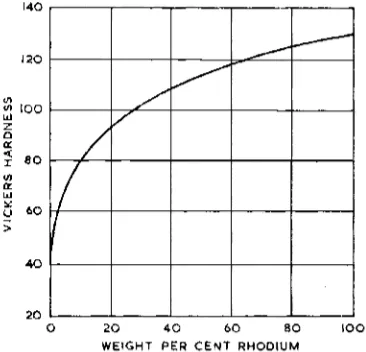
2 0 40 6 0 8 0 100 WEIGHT PER CENT RHODIUM
0
Fig. 11 Diamond pyramid hardness of annealed rhodium-platinum alloys (Reference 4 1 )
position range. Magnetic susceptibility deter- minations display discontinuities which were at one time interpreted by Hildebrandt (13) as being indicative of an ordering reaction based on the 25 atomic per cent rhodium composition. Fig. 8 shows the variations of mass susceptibility with temperatures for alloys containing respectively 9.1, 17.4, 25.1, and 32.2 atomic per cent of rhodium.
Annealed alloys have a Young's modulus which increases uniformly with rhodium content until a value of 31 x I O ~ lb per sq. in. is reached at 20 per cent by weight of rhodium
ELASTIC
MODULI
(LE
PER
SQUARE
(41). Work hardened material has a direct modulus which is lower than that of t h e annealed alloys over the range 9 to 14 per cent of rhodium. T h e modulus of rigidity of annealed alloys is approximately 8 per cent higher than that of hard drawn material over
the complete composition range. Poisson’s ratio, calculated from t h e data of Fig. 9, decreases from a value of 0.27 for pure platinum t o 0.094 for t h e 20 per cent rhodium alloy.
T h e ultimate tensile strength of annealed alloys increases from 10.5 tons per sq. in. for pure platinum to 30 tons per sq. in. for a
rhodium content of 30 per cent. As illustrated i n Fig. 10, however, t h e yield point remains roughly constant a t about 6 tons per sq. in.
up to a rhodium content of a t least 20 per
cent, T h e curve relating hardness with com- position displays no inflexions, although small additions of rhodium rapidly harden the alloy.
Fig. 11 illustrates the hardness of annealed specimens of alloys up t o IOO per cent by weight of rhodium (41).
Tho concluding part of Dr. Darling’s article mill
be published in the July issue of “Platinum Metals Review”.
References
I W. E. Newton, Repertory Pat. Invent., 1858,
P. 375
2 H. Sainte-Claire Deville and H. Debray,
Ann. Chim. Phys., 1859, 56, 385-496 3 H. Le Chatelier,J. de Phys., 1887, 6 , (z), 23 4 H. V. Wartenberg, Verhandl deut. Physik.
Ges., 1910, 12, 121-127
5 0. Feussner and L. Muller, Heraeus Fest- schrift, 1930, pp. 1-17. (Also Ann. Physik.,
6 J. S . Acken, U S Bur. Stand.3. Research, 1934,
12, 249-258, Research Paper No. 650 7 C. R. Barber, Proc, Phys. SOC., 1950, 63, B,
492-501
8 C. W. Haworth and W. Hume-Rothery, J . Inst. Metals, 1958-1959, 87, (8), 265-272 9 J. Weerts, Z. Metallkunde, 1932, 24, 138-141
10 H. J. Goldschmidt and T. Land, J . Iron &
11 E. Raub,
3.
Less-Common Metals, 1959, I,I93O1 7 J 9-47)
Steel Znst., 1947, 155, (2), 221-226
3-18
12 V. A. Nemilov and N . M. Voronov, Zzvestia Platinogo Znstituta (Ann. Znst. Platine), 1935, (121, 27-35
13 E. Hildebrandt, Ann. Physic, 1937, 30, (7), 593-608
14 F. M. Jaeger and J. E. Zanstra, Proc. Akad.
15 E. T. Dixon, Phys. Rev., 1931, 38, 6 16 F. M. Jaeger and E. Rosenbohm, Proc. Akad.
Amsterdam, 1931, 34, 85
17 A. A. Rudnitsky, R. S. Polyakova and I. I. Tyurin, Zzvest. Sekt. Platiny (Akad. Nauk
18 A. A. Rudnitsky, R. S . Polyakova and I. I.
Tyurin, Zzvest. Sekt. Platiny (Akad. Nauk
SSSR), 1955, 29, 190-196
19 R. Raub, H. Beeskow and D. Menzel, Z. Metallkunde, 1959, 50, (7), 428-431
20 E. S. Bale, Platinum Metals Rev., 1958, 2,
61-63
21 L. Holborn and W. Wien, Wiedemann’s Ann. der Physik, 1895, 56, (2) 360-396
22 H. Le Chatelier, Compt. rend., 1886, IOZ, 8x9 23 L. Holborn and W. Wien, Wiedemann’s Ann.
der Physik, 1892, 47, 107-134
24 F. Henning and H. Moser, Heraeus Fest- schrift, 1930, 52-68
25 F. R. Caldwell, U S Bur. Stand. J. Research, 1933, LO, 373-380, Research Paper No. 537 26 C. 0. Fairchild and H. M. Schmitt, Chem.
Met. Eng., 1922, 26, 158-160
27 Hutter, Korrosion Suppt. to Chern. Appa-
28 T. Land,J. Iron & Steel Znst., 1947, 155, (2),
29 L. Reeve and A. Howard, J . Iron &3 Steel Znst., 1947, 155, (2), 216-220
30 J. C. Chaston, R. A. Edwards and F. M. Lever, J . Iron & Steel Inst., 1947, 155,
31 R. C. Jewel1,J. Iron &3 Steel Znst., 1947, 155,
32 M. Chaussain, Proc. Inst. Brit. Foundrymen,
33 H. Ehringer, MetalZ, 1954, 8, (15-16), 596-
34 G. B. Lapp and V. L. Maksirnova, Zhur.
35 H. E. Bennett, Noble Metal Thermocouples,
36 M. K. McQuillan,
3.
Sci. Instruments, 1949,37 R. C. Jewel1 and E. G. Knowles,
3.
Sci.38 E. Raub and W. Plate, Z . Metallkunde, 1957, Amsterdam, 1931, 34, 15
S S s R ) , 1955, 29, 183-189
ratur, 1929, 4, 49-50; 1930, 5, 5-6
2 14-2 I5
(’)J 229-231
(21, 231-234
1951,449 6-77
598
Neorg. Khim., 1957, 2, 2589-2597
Johnson, Matthey & Co. Ltd., 1956
26, 329-331
Instruments, 1951, 28, 353
4% 529
39 A. G.-Metcalfe, Brit.
3.
Appl. Phys., 1950, I, (IO), 256-25840 R. C. Jewcll, E. G. Knowles and T. Land,
41 Johnson, Matthey Research Laboratories, Metal Znd., 1955, 87,217-221