Original Research Article
Association between adherence to iron intake and anaemia prevalence
among women in Cambodia and India: new evidence from recent global
demographic and health surveys
Manoj Kumar Raut
1*, J. C. Reddy
1, Md. Ataur Rahman
2INTRODUCTION
Anaemia is a problem affecting both developing and developed countries with major consequences for human health as well as social and economic development. It occurs at all stages of the life cycle but is more prevalent in pregnant women and young children. The average estimates for all-cause anaemia attributable mortality (both direct and indirect) were 6.37, 7.26 and 3.0% for Africa, Asia and Latin America, respectively.1 Globally,
it is estimated that 32 million (95% CI: 28—36) pregnant women, 496 million non- pregnant women (95% CI: 409-595) and 273 million (95% Credibility Interval [CI]: 241—303) children are anaemic.2 In 2012, participants in the Sixty-fifth World Health Assembly pledged to reduce the global prevalence of anaemia in women of reproductive age by 50% by 2025.
Anaemia prevention programs through iron folic acid (IFA) supplementation have been implemented across
ABSTRACT
Background: Anaemia is a global public health problem affecting around 800 million children and women worldwide. Anaemia, defined as a reduced haemoglobin concentration, is associated with increased peri-natal mortality, increased child morbidity and mortality, impaired mental development, impaired immune competence, increased susceptibility to lead poisoning, and decreased performance at work.
Methods: This paper attempts to understand the determinants underlying iron and folic acid intake and correlates of anaemia prevalence in two countries in the Asia region using multivariate binary logistic regression analyses of recent data from the Demographic and Health Surveys of Cambodia and India. The individual level data was analysed, using Predictive Analytics Software for Windows (PASW) 18.0 release.
Results: After adjusting for standard co-variates, reading newspaper and watching television was significantly associated with coverage, while reading newspaper and listening to radio was significantly associated with adherence to iron tablets or syrup in India. In case of both Cambodia and India, those who received at least three antenatal care visits were much more likely to adhere to at least 90 days of iron tablet or syrup or iron and folic acid tablets, more so in Cambodia compared to India. Those who reported to have adhered to at least 90 days of iron and folic acid tablets in India were more likely to be not anaemic unlike in case of Cambodia.
Conclusions: Antenatal care-seeking visits seem to be a particularly effective ways of reaching women and in increasing the likelihood of intake of iron only or iron and folic acid supplements.
Keywords: Anaemia, Antenatal care, Iron and folic acid tablets/syrup supplementation, Mass media
1
Research and Evaluation, Asia, Nutrition International, Asia Regional Office, New Delhi, India
2Health and Nutrition Advisor, Field Support Services Project of Global Affairs Canada, Bangladesh
Received: 19 April 2018
Revised: 31 May 2018
Accepted: 01 June 2018
*Correspondence:
Dr. Manoj Kumar Raut,
E-mail: [email protected]
Copyright: © the author(s), publisher and licensee Medip Academy. This is an open-access article distributed under the terms of the Creative Commons Attribution Non-Commercial License, which permits unrestricted non-commercial use, distribution, and reproduction in any medium, provided the original work is properly cited.
many countries through supply and demand driven approaches include promoting a diversified diet, iron-folic acid (IFA) supplementation during pregnancy, iron fortification of staple foods, prevention and treatment of malaria, use of insecticide-treated bed nets, helminth prevention and control, delayed cord clamping, increased birth spacing and social awareness programmes etc. But levels of anaemia are still high because of the levels of iron supplementation is quite low with low adherence to IFA, poor dietary intake, chronic blood loss due to infection such as malaria and hookworm infestation and social myths regarding some foods.
The literature review reveals some significant studies, which document impact on reduction of anaemia through awareness program on consumption of IFA (Srivastava et al) and in one study in Cambodia, which reported on the implementation of a weekly IFA supplementation government programme with secondary-school girls (n= 423), women employed in garment factories (n=478) and rural women (n=639), showed substantial improvements in knowledge about the causes, consequences and prevention of anaemia following promotion through social marketing strategies.3,4 Certain socio-demographic factors that were significantly associated with the non-use of antenatal IFA supplements were, living in one of the districts in Pakistan (AOR: 1.72), maternal age 45 years and above (AOR: 1.97), no maternal education (AOR: 2.36), no paternal education (AOR: 1.58), belonging to the lowest household wealth index quartile (AOR: 1.47), and no use of antenatal care (ANC) services (AOR: 13.39).5 In settings where the prevalence of anaemia
among pregnant women is lower than 20%, intermittent use of iron and folic acid supplements by non-anaemic pregnant women is recommended to prevent anaemia and improve gestational outcomes.6
In this regards, this paper attempts to understand the determinants underlying iron intake and anaemia in two countries in Asia using multivariate statistical analyses of the most recent data from the Demographic and Health Surveys in Cambodia and India. Cambodia was selected as the adherence to IFA is about three-fourths compared to less than a third in case of India. There seems to be an opportunity for India to learn from Cambodia to act towards an increase in adherence to IFA.
Socio-demographic health and nutrition profile of the two countries: The projected population in the mid- year of 2017 in Cambodia is about 16 million and about 1,339 million in India (UN, 2017). The population density of Cambodia is 49 and 382 in case of India. The total fertility rate is 2.7 in Cambodia and 2.44 births per woman in India and the crude birth rate varies from 24.5 births per thousand mid-year population in Cambodia to 20.0 in case of India. The infant mortality rate varies from 25 infant deaths per thousand live births in Cambodia to as high as 37 in case of India. The under-five mortality rate varies from 29 under-under-five deaths per thousand live births in case of Cambodia to as high as 43 in case of India (SOWC, UNICEF, 2017). The maternal mortality ratio varies from 161 maternal deaths per 100,000 live births in Cambodia to as high as 174 in case of India.
Table 1: Socio-demographic, health and nutrition indicators in Cambodia and India.
Indicators Cambodia India
Projected population, 2017 (in million) 16.0 1,339.2
Population density (persons per sq. km.) 49 382
Overall sex ratio (Males / Females *100) (country censuses) 105 94.3
Life expectancy at birth (in years) 67.6 67.6
Total fertility rate (lifetime births per woman) 2.70 2.44
Crude birth rate (2010-15) (no. of live births per thousand mid-year
population) 24.5 20.0
Stunting (height-for-age) (moderate and severe) (%) 32.4 39.0
Wasting (weight-for-height) (moderate and severe) (%) 9.6 15.0
Underweight (weight-for-age) (moderate and severe) (%) 23.9 29.0
Infant mortality rate (no. of infant deaths per thousand live births) 25 37
Under five mortality rate (no. of under-five deaths per thousand live births) 29 43
Maternal mortality ratio (no. of maternal deaths per 100,000 live births) 161 174
Status of human development, UNDP, 2015 (Rank) 143 131
Level of human development, UNDP (2015) Medium Medium
GDP per Capita (current US$), World Bank, 2016 1,269.9 1,709.4
World Bank classification, World Bank (June 2017) Lower middle
income
Lower middle income
Source: Demographic and Health Surveys, United Nations, Department of Economic and Social Affairs, Population Division. World Population Prospects: The 2017 Revision, Key Findings and Advance Tables. (2017). Working Paper No. ESA/P/WP/248. (https://esa.un.org/unpd/wpp/publications/Files/WPP2017_KeyFindings.pdf).
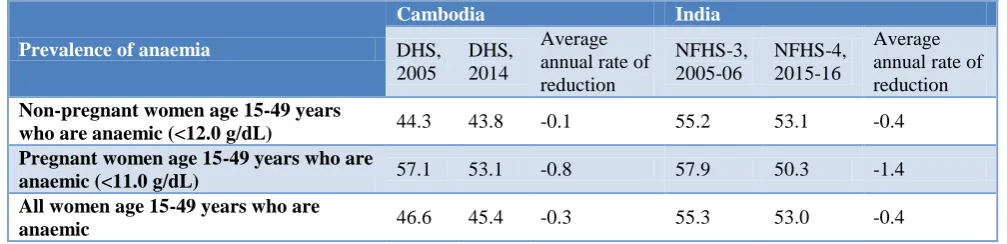
The comparative analyses of the two countries reveal that the women who took iron tablets/syrup or iron with folic acid for 90 days or more varies from 75.9% in Cambodia to 38.8% in India, while the anaemia prevalence varied from 45.4% in Cambodia to 53.0% in India. The trends in 90+ days of Iron adherence shows that there is an absolute increase of 4.3 times and a relative increase of 3.3 times between 2005 and 2014 in Cambodia in about 9 years compared to 1.7 and 0.7 times in case of India in
about 10 years between 2005-06 and 2015-16. The average annual rate of increase (AARI) was 17.56 between 2005 and 2014 in Cambodia and 5.28 between 2005-06 and 2015-16 in India. The trends in prevalence of any anaemia reveals that the average annual rate of reduction (AARR) from 2005 to 2014 in Cambodia is in range of 0.03 in case of all women aged 15 to 49 years of age, who were anaemic compared to 0.04 in case of India from 2005-06 to 2015-16.
Table 2: Trends in intake of iron tablets or syrup or iron with folic acid tablets adherence in Cambodia and India: 2005 to 2016 (%).
Intake of iron tablets or syrup or iron with folic acid tablets
Cambodia India
DHS 2005
DHS 2014
NFHS-3, 2005-06
NFHS-4, 2015-16
None 36.8 4.4 40.4 23.9
Less than 60 days 30.8 8.2 27.4 28.6
60-89 days 9.0 9.1 9.1 8.7
90+ days 17.6 75.9 23.2 38.8
Average annual rate of increase (AARI) in consumption of iron for 90+ days from 2005 to 2014 for Cambodia and 2005-06 to 2015-16 for India
- 17.63 - 5.28
Source: Demographic and Health Surveys
Table 3: Trends in anaemia prevalence in Cambodia and India: 2005 to 2016 (%).
Prevalence of anaemia
Cambodia India
DHS, 2005
DHS, 2014
Average annual rate of reduction
NFHS-3, 2005-06
NFHS-4, 2015-16
Average annual rate of reduction
Non-pregnant women age 15-49 years
who are anaemic (<12.0 g/dL) 44.3 43.8 -0.1 55.2 53.1 -0.4
Pregnant women age 15-49 years who are
anaemic (<11.0 g/dL) 57.1 53.1 -0.8 57.9 50.3 -1.4
All women age 15-49 years who are
anaemic 46.6 45.4 -0.3 55.3 53.0 -0.4
Source: Demographic and Health Surveys.
Study objectives
The objectives of the study are to examine the association between different socio-demographic characteristics, and iron and folic tablets or syrup adherence and likelihood of not being anaemic in two selected countries in the Asia region.
METHODS
This paper uses data from two Demographic and Health Surveys (DHSs) from Cambodia (2014) and India (2015-16). These surveys were carried out by ICF International, working in close conjunction with in-country research institutes. We used the existing weighted data of currently married women of reproductive age (15-49 years) for our analyses. Individual level datasets were analysed using PASW Statistics 18, Release 18.0 software. Binary logistic regressions were carried out to explore factors associated with adherence to iron tablets
or syrup and anaemia prevalence. Logistic regression can be used to predict a dependent variable on the basis of independent variables and to determine the percent of variance in the dependent variable explained by independent variables; to rank the relative importance of independents; to assess interaction effects; and to understand the impact of covariates. Logistic regression
applies maximum likelihood estimation after
variables were considered for the analysis. One is for coverage of iron tablets or syrup or iron with folic acid tablets or syrup and the other for consumption of iron tablets or syrup or iron with folic acid tablets or syrup for at least 90 days. The first dependent variable was coded as 1 if the mother had bought or in some other way received iron tablets or syrup and 0 if she had not purchased nor received iron tablets. The second dependent variable was coded as 1 if the mother had bought or in some other way consumed iron tablets or syrup for 90+ days and 0 if she had not consumed iron tablets for 90+ days. The third dependent variable was coded as 0 if the women had any anaemia and 1 if she did not.
Covariates in the model
Based on an extensive literature review, the analysis of these two surveys considered the following covariates:
Independent covariates
Background -community & household level covariates
Place of residence: urban/rural
Ownership of assets: wealth quintiles (poorest to richest)
Socio-economic covariates-individual level
Education of the mother
Mother’s employment status: Working currently/ not working currently
Demographic covariates-individual level
Age group of woman: seven five year age groups from 15 to 49 years of age
Total children ever born: Have 2 or more children/ have more than 2 children
Exposure to communication
Newspaper
Radio
Television
Receipt of antenatal care visits
Received less than three antenatal care visits/received three or more antenatal care visits.
Receipt of iron tablets or syrup of iron with folic acid or syrup
Received iron tablets or syrup or iron with folic acid tablets or syrup/did not receive iron tablets or syrup or iron with folic acid tablets or syrup
Adherence to iron tablets or syrup of iron with folic acid or syrup for at least 90 days
Consumed iron tablets or syrup or iron with folic acid tablets or syrup for 90 or more days/ did not consume iron tablets or syrup or iron with folic acid tablets or syrup for 90 or more days
Dependent variables
Receipt of iron tablets/syrup or iron and folic acid tablets/syrup.
Adherence to iron tablets/syrup or iron and folic acid tablets/syrup for at least 90 days.
Likelihood of not having anaemia.
RESULTS
Sub-national trends in anaemia prevalence and iron and folic acid adherence
The sub-national trends in AARR in Cambodia at the region (province) level shows that the highest reduction being observed is in Banteay Meanchey region followed by Siem Reap. In case of India, in the states and union territories, the highest reduction is observed in Sikkim and Mizoram followed by Assam. The highest increase in iron adherence for 90+ days is observed in Mondol Kiri/Rattanak Kiri followed by Kampong Thom. In India, the highest increase in iron and folic acid adherence for 90+ days is observed in Manipur followed by Meghalaya.
Results of the bivariate analyses
A bivariate analysis was conducted for receipt of iron tablets/syrup as well as for consumption of iron tablets/ syrup for 90+ days. The variables considered for analysis were various background level and individual level socio-demographic and socio-economic covariates. Results indicate that a significantly higher proportion of women residing in urban areas received iron tablets or syrup as compared to rural areas across all countries similarly, adherence for 90+ days was also found to be higher among the women residing in urban areas in both the countries and more so in Cambodia. The receipt and adherence to IFA was also higher among the literates, higher among those who had two or less two children, higher among the households belonging to the higher socio-economic status, higher among those who were exposed to mass media communication channels of newspaper, radio and television. Looking at the exposure to different mediums of communication, it was found that a significant proportion of women who read newspaper and watched television adhered to IFA as compared to those women who do not read newspaper and does not watch television across both the countries. A significant proportion of women who received at least 3 ANCs received and adhered to iron for at least 90 days in both the countries.
Table 4: Prevalence of anaemia in women of reproductive age group (15-49 years) in Cambodia by Province, 2005 to 2014 (%).
Sl.
No Country/Province
Any anaemia
Any anaemia
Average annual rate of reduction (AARR) in Anaemia
90+ adherence to iron
90+ adherence to iron
Average annual rate of increase (AARI) in adherence
DHS, 2005 DHS,
2014 DHS, 2005 DHS, 2014
Cambodia 46.7 45.4 -0.31 17.6 75.5 15.68
1 Banteay Meanchey 57.1 30.5 -6.73 22.9 88.3 14.45
2 Kampong Cham 41.3 52.0 2.59 6.2 65.5 26.59
3 Kampong Chhnang 55.9 53.0 -0.59 16.6 94.4 18.98
4 Kampong Speu 58.0 53.3 -0.93 16.0 79.2 17.34
5 Kampong Thom 57.4 44.6 -2.76 6.5 78.3 28.26
6 Kandal 45.9 49.4 0.82 11.9 79.0 20.84
7 Phnom Penh 29.3 41.7 4.00 16.0 79.2 17.34
8 Prey Veng 40.3 46.9 1.70 28.1 87.8 12.07
9 Pursat 52.4 46.6 -1.29 53.0 80.6 4.28
10 Svay Rieng 49.4 45.7 -0.86 39.3 78.2 7.12
11 Takeo 46.8 35.4 -3.05 18.9 86.7 16.45
12 Battambang/Krong Pailin 53.1 42.5 -2.44 8.7 50.1 19.13
13 Mondol Kiri/Rattanak Kiri 44.3 41.7 -0.67 5.2 63.3 28.39
14 Preah Vihear/Stueng Treng 62.6 53.7 -1.69 12.5 38.5 11.91
15 Kratie 38.5 46.2 2.05 18.0 74.0 15.18
16 Siem Reap 56.2 41.1 -3.42 18.4 73.1 14.79
17 Otdar Mean Chey 57.1 48.3 -1.84 15.6 76.8 17.28
18 Kampot/Krong Kep 42.3 44.1 0.46 21.9 80.0 13.83
19 Krong Preah Sihanouk/Kaoh
Kong 46.3 43.7 -0.64 26.7 66.7 9.59
Source: Demographic and Health Surveys: 2005 and 2014.
Table 5: Prevalence of anaemia in women of reproductive age group (15-49 years) in India by State, 2005-06 to 2015-16 (%).
Sl. No
Country/States/Union Territories
Any anaemia
Any anaemia
Average annual rate of reduction (AARR) in Anaemia
90+ adherence to IFA
90+ adherence to IFA
Average annual rate of increase (AARI) in adherence
NFHS–3, 2005 -06
NFHS–4, 2015-16
NFHS–3, 2005 -06
NFHS–4, 2015-16
India 55.3 53.0 -0.42 23.1 38.8 5.32
1 Andaman and Nicobar
Islands - 65.7 - - 67.0 -
2 Andhra Pradesh 62.9 60.0 -0.47 - 65.0 -
3 Arunachal Pradesh 50.6 40.3 -2.25 11.2 15.4 3.24
4 Assam 69.5 46.0 -4.04 16.2 42.8 10.20
5 Bihar 67.4 60.3 -1.11 9.7 14.2 3.88
6 Chandigarh - 75.9 - - 60.5 -
7 Chhattisgarh 57.5 47.0 -2.00 20.7 46.2 8.36
8 Dadra and Nagar Haveli - 79.5 - - 52.8 -
9 Daman and Diu - 58.9 - - 41.6 -
10 Goa 44.3 52.5 1.71 68.6 78.4 1.34
11 Gujarat 38.0 31.3 -1.92 37 45.4 2.07
12 Haryana 55.3 54.9 -0.07 26.7 44.5 5.24
13 Himachal Pradesh 56.1 62.7 1.12 37.9 64.8 5.51
14 Jammu & Kashmir 43.3 53.4 2.12 27.6 39.9 3.75
15 Jharkhand 52.1 40.3 -2.54 14.2 24.4 5.56
16 Karnataka 69.5 65.2 -0.64 39.3 52.9 3.02
Sl. No.
Country/ States/ Union Territories
Any anaemia
Any anaemia
Average annual rate of reduction (AARR) in Anaemia
90+ adherence to IFA
90+ adherence to IFA
Average annual rate of increase (AARI) in adherence
NFHS–3, 2005 -06
NFHS–4, 2015-16
NFHS–3, 2005 -06
NFHS–4, 2015-16
18 Lakshadweep 32.8 34.2 0.42 - 85.8 -
19 Madhya Pradesh 55.9 52.5 -0.64 12.4 32.7 10.18
20 Maharashtra - - - 31.4 51.4 5.05
21 Manipur 48.4 48.0 -0.08 13.1 48.0 13.87
22 Meghalaya 35.7 26.4 -2.97 16.7 49.8 11.55
23 Mizoram 47.2 56.2 1.76 24.7 58.9 9.08
24 Nagaland 38.6 22.5 -5.25 3.5 7.8 8.34
25 New Delhi - 23.9 - 39.5 60.8 4.41
26 Odisha 61.2 51.0 -1.81 33.8 44.6 2.81
27 Puducherry - 52.4 - - 69.4 -
28 Punjab 38.0 53.5 3.48 27.9 55.3 7.08
29 Rajasthan 53.1 46.8 -1.25 13.1 24.2 6.33
30 Sikkim 60.0 34.9 -5.27 38.7 78.6 7.34
31 Tamil Nadu 53.2 55.1 0.35 41.6 69.0 5.19
32 Telangana - 56.7 - - 62.9 -
33 Tripura 65.1 54.5 -1.76 18 26.8 4.06
34 Uttar Pradesh 49.9 52.4 0.49 8.8 18.1 7.48
35 Uttarakhand 55.2 45.2 -1.98 26.4 32.3 2.04
36 West Bengal 63.2 62.5 -0.11 25.7 42.8 5.23
Source: Demographic and health surveys: 2005-06 and 2015-16, Stat Compiler.
Table 6: Socio-economic, demographic and health variables in Cambodia and India, demographic and health surveys (%).
Predictors used in the model Cambodia, DHS 2014 India, NFHS -4, 2015-16
N 5,678 182,096
Background– Community level covariate
Place of residence
Rural 85.6 70.3
Urban 14.4 29.7
Background– Individual level covariates
Education of the Respondent
Non-Literate 13.2 27.6
Literate 86.8 72.4
Demographic covariates
Age group of the woman
15-19 years 3.4 3.4
20-24 years 24.3 31.3
25-29 years 29.9 37.6
30-34 years 26.2 18.3
35-39 years 10.3 6.9
40-44 years 4.3 1.9
45-49 years 1.5 0.6
Total children ever born
Have 2 or less than 2 children 65.8 68.1
Have more than 2 children 34.2 31.9
Socio-economic covariates
Respondent’s work status
Not working currently 34.8 97.0
Working currently 65.2 3.0
Predictors used in the model Cambodia, DHS 2014 India, NFHS -4, 2015-16
Wealth quintile
Poorest 22.9 23.4
Poorer 20.4 21.2
Middle 18.8 19.9
Richer 18 19
Richest 19.9 16.6
Communication exposure
Mass media
Newspaper
Does not read newspaper 79.8 65.1
Reads newspaper 20.2 34.9
Radio
Does not listen to radio 50.6 86.2
Listens to radio 49.4 13.8
Television
Does not watch television 29.3 28.6
Watches Television 70.7 71.4
Receipt of at least 3 ANCs
Received less than 3 ANCs 11.5 34.5
Received 3+ ANCs 88.5 65.5
Iron receipt
Did not receive or bought any iron supplements or syrup 4.3 22.0
Received or bought iron supplements or syrup 95.7 78.0
Iron adherence (90+ days of iron supplementation or
syrup)
Did not consume iron supplementation for 90 or more
days 24.1 61.2
Consumed iron supplementation or syrup for 90 or more
days 75.9 38.8
Source: Demographic and health surveys.
Table 7: Receipt of iron or iron and folic acid supplements by socio-economic and demographic variables in Cambodia and India (%).
Predictors used in the model Cambodia, DHS 2014 India, NFHS -4, 2015-16
Non-iron receivers/ buyers
Iron receivers/ buyers
Prob.
Non-iron & folic acid receivers/ buyers
Iron & folic acid receivers/ buyers
Prob.
N 244 5,434 39,944 142,152
Background- community level covariate
Rural 4.7 95.3 24.6 75.4
Urban 2.1 97.9** 0.001 15.6 84.4*** 0.000
Individual level covariates
Education of the respondent
Non-Literate 12 88 37.4 62.6
Literate 3.1 96.9*** 0.000 16.1 83.9*** 0.000
Demographic covariates
Age group of the woman
15-19 years 4.6 95.4 20 80
20-24 years 2.8 97.2 20 80
25-29 years 3.2 96.8 20.7 79.3
30-34 years 3.6 96.4 23.3 76.7
35-39 years 7 93 28.4 71.6
40-44 years 13.4 86.6 38.6 61.4
45-49 years 17.4 82.6*** 0.000 49.5 50.5*** 0.000
Predictors used in the model Cambodia, DHS 2014 India, NFHS -4, 2015-16 Non-iron
receivers/ buyers
Iron receivers/ buyers
Prob.
Non-iron & folic acid receivers/ buyers
Iron & folic acid receivers/ buyers
Prob.
Total children ever born
Have 2 or less than 2 children 2.2 97.8 17.3 82.7
Have more than 2 children 8.2 91.8*** 0.000 31.9 68.1*** 0.000
Socio-economic covariates
Respondents work status
Not working currently 3.6 96.4 22 88
Working currently 4.7 95.3 0.068 20.9 79.1 0.053
Wealth quintile
Poorest 9 91 35.8 64.2
Poorer 4.6 95.4 24.7 75.3
Middle 3.7 96.3 18.5 81.5
Richer 1.6 98.4 14.8 85.2
Richest 1.7 98.3*** 0.000 11.2 88.8*** 0.000
Communication exposure – Mass media
Newspaper
Does not read newspaper 4.9 95.1 27 73
Reads newspaper 1.8 98.2*** 0.000 12.6 87.4*** 0.000
Radio
Does not listen to radio 4.7 95.3 22.3 77.7
Listens to radio 3.9 96.1 0.169 19.4 80.6*** 0.000
Television
Does not watch television 8.3 91.7 36.9 63.1
Watches Television 2.6 97.4*** 0.000 15.9 84.1*** 0.000
Receipt of at least 3 ANCs
Received less than 3 ANCs 33.1 66.9 39.9 60.1
Received 3+ ANCs 0.6 99.4*** 0.000 12.5 87.5*** 0.000
Note: *: p<0.05: Statistically Significant at 5% level **: p<0.01: Statistically Significant at 1% level, p<0.001 : Statistically Significant at 0.1% level, n.s.: Not significant. Source: Demographic and Health Surveys.
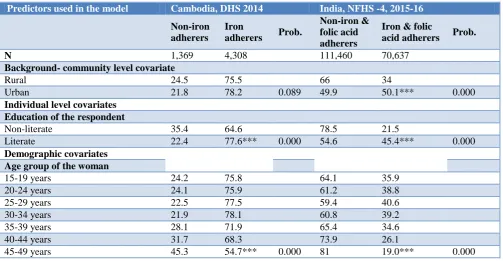
Table 8: Adherence to iron or iron and folic acid intake for at least 90 days by socio-economic and demographic variables in Cambodia and India (%).
Predictors used in the model Cambodia, DHS 2014 India, NFHS -4, 2015-16
Non-iron adherers
Iron
adherers Prob.
Non-iron & folic acid adherers
Iron & folic
acid adherers Prob.
N 1,369 4,308 111,460 70,637
Background- community level covariate
Rural 24.5 75.5 66 34
Urban 21.8 78.2 0.089 49.9 50.1*** 0.000
Individual level covariates
Education of the respondent
Non-literate 35.4 64.6 78.5 21.5
Literate 22.4 77.6*** 0.000 54.6 45.4*** 0.000
Demographic covariates
Age group of the woman
15-19 years 24.2 75.8 64.1 35.9
20-24 years 24.1 75.9 61.2 38.8
25-29 years 22.5 77.5 59.4 40.6
30-34 years 21.9 78.1 60.8 39.2
35-39 years 28.1 71.9 65.4 34.6
40-44 years 31.7 68.3 73.9 26.1
Predictors used in the model Cambodia, DHS 2014 India, NFHS -4, 2015-16
Non-iron adherers
Iron
adherers Prob.
Non-iron & folic acid adherers
Iron & folic
acid adherers Prob.
Total children ever born
Have 2 or less than 2 children 20.7 79.3 55.6 44.4
Have more than 2 children 30.8 69.2*** 0.000 73.2 26.8*** 0.000
Socio-economic covariates
Respondents work status
Not working currently 24.4 75.6 61.6 38.4
Working currently 23.9 76.1 0.692 59.3 40.7** 0.006
Wealth Quintile
Poorest Ref 35 65 79.6 20.4
Poorer 24.3 75.7 68.5 31.5
Middle 23.7 76.3 58.3 41.7
Richer 18.4 81.6 50.6 49.4
Richest 16.9 83.1*** 0.000 41.9 58.1*** 0.000
Communication exposure- Mass media
Newspaper
Does not read newspaper 25.3 74.7 68.1 31.9
Reads newspaper 19.7 80.3*** 0.000 48.4 51.6*** 0.000
Radio
Does not listen to radio 26.5 73.5 61.7 38.3
Listens to radio 21.7 78.3*** 0.000 58.4 41.6*** 0.000
Television
Does not watch television 32.1 67.9 78.8 21.2
Watches television 20.8 79.2*** 0.000 54.2 45.8*** 0.000
Receipt of at least 3 ANCs
Received less than 3 ANCs 73.5 26.5 81.3 18.7
Received 3+ ANCs 17.7 82.3*** 0.000 50.7 49.3*** 0.000
Note: *: p<0.05 : Statistically Significant at 5% level **: p<0.01 : Statistically Significant at 1% level, p<0.001 : Statistically Significant at 0.1% level, n.s.: Not significant. Source: Demographic and Health Surveys
Results of the multivariate binary logistic regression analyses
Predictors used in the model
Background community level and individual level socio-demographic and economic covariates, which are expected to influence the iron tablets or syrup coverage and adherence behaviour and known to affect the risk of having anaemia have been entered in the model. The predictors used in the model are the place of residence, age of the woman, children ever born, education of the respondent and current work status of the respondent, possession of household assets used in the construction of wealth quintile and exposure to mass media and receipt of antenatal care.
Working status of women was also found to play a significant role; as a significant proportion of working women received iron tablets/syrup as compared to non-working women in India unlike in Cambodia. Looking at the exposure to different mediums of communication, it
was found that a significant proportion of women who watched television received and adhered to IFA as compared to those women who do not watch television in India. A significant proportion of women who received at least 3 ANCs received and adhered to iron for at least 90 days in both the countries.
Those who had received at least three antenatal care visits, were 10.984 times in Cambodia and to 2.854 times in India, who were more likely to adhere to at least 90 days of iron tablets or syrup or iron and folic acid tablets supplementation after adjusting for the potential confounders.
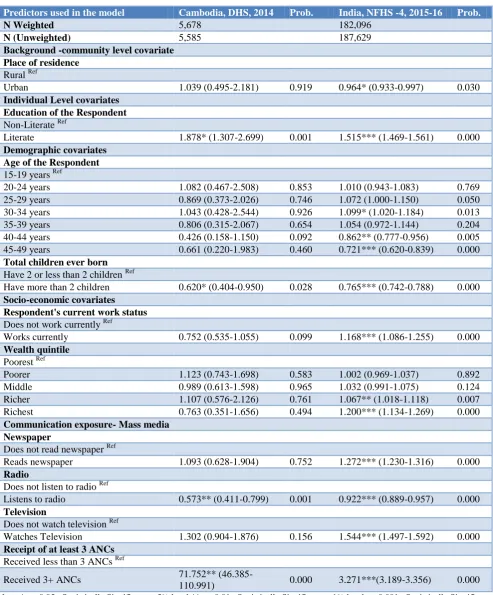
Table 9a: Adjusted Odds ratio (AOR) with 95% confidence intervals from the multivariate logistic regression (MLR) coverage of iron tablets or syrup or iron and folic acid or syrup in Cambodia and India, demographic and health surveys. Dependent variable: receipt of iron tablets or syrup or iron and folic acid supplements: coded as 0 if
the women had received / bought iron tablets or syrup and 1 if she did.
Predictors used in the model Cambodia, DHS, 2014 Prob. India, NFHS -4, 2015-16 Prob.
N Weighted 5,678 182,096
N (Unweighted) 5,585 187,629
Background -community level covariate
Place of residence
Rural Ref
Urban 1.039 (0.495-2.181) 0.919 0.964* (0.933-0.997) 0.030
Individual Level covariates
Education of the Respondent
Non-Literate Ref
Literate 1.878* (1.307-2.699) 0.001 1.515*** (1.469-1.561) 0.000
Demographic covariates
Age of the Respondent
15-19 years Ref
20-24 years 1.082 (0.467-2.508) 0.853 1.010 (0.943-1.083) 0.769
25-29 years 0.869 (0.373-2.026) 0.746 1.072 (1.000-1.150) 0.050
30-34 years 1.043 (0.428-2.544) 0.926 1.099* (1.020-1.184) 0.013
35-39 years 0.806 (0.315-2.067) 0.654 1.054 (0.972-1.144) 0.204
40-44 years 0.426 (0.158-1.150) 0.092 0.862** (0.777-0.956) 0.005
45-49 years 0.661 (0.220-1.983) 0.460 0.721*** (0.620-0.839) 0.000
Total children ever born
Have 2 or less than 2 children Ref
Have more than 2 children 0.620* (0.404-0.950) 0.028 0.765*** (0.742-0.788) 0.000
Socio-economic covariates
Respondent's current work status
Does not work currently Ref
Works currently 0.752 (0.535-1.055) 0.099 1.168*** (1.086-1.255) 0.000
Wealth quintile
Poorest Ref
Poorer 1.123 (0.743-1.698) 0.583 1.002 (0.969-1.037) 0.892
Middle 0.989 (0.613-1.598) 0.965 1.032 (0.991-1.075) 0.124
Richer 1.107 (0.576-2.126) 0.761 1.067** (1.018-1.118) 0.007
Richest 0.763 (0.351-1.656) 0.494 1.200*** (1.134-1.269) 0.000
Communication exposure- Mass media
Newspaper
Does not read newspaper Ref
Reads newspaper 1.093 (0.628-1.904) 0.752 1.272*** (1.230-1.316) 0.000
Radio
Does not listen to radio Ref
Listens to radio 0.573** (0.411-0.799) 0.001 0.922*** (0.889-0.957) 0.000
Television
Does not watch television Ref
Watches Television 1.302 (0.904-1.876) 0.156 1.544*** (1.497-1.592) 0.000
Receipt of at least 3 ANCs
Received less than 3 ANCs Ref
Received 3+ ANCs 71.752**
(46.385-110.991) 0.000 3.271***(3.189-3.356) 0.000
Note: *: p<0.05 : Statistically Significant at 5% level **: p<0.01 : Statistically Significant at 1% level, p<0.001 : Statistically Significant at 0.1% level; n.s.: Not significant; ref Refers to Reference Category.
Table 9b: Adjusted Odds Ratio (AOR) with 95% confidence intervals from the multivariate binary logistic regression (MLR) of adherence to iron tablets or syrup or iron and folic acid tablets or syrup for at least 90 days in
Cambodia and India, demographic and health surveys (DHS). Dependent variable: adherence to iron tablets or syrup and iron and folic acid tablets or syrup for at least 90 days: coded as 0 if the women had not consumed iron
tablets or syrup for at least 90 days and 1 if she did.
Predictors used in the model Cambodia, DHS, 2014 Prob. India, NFHS -4, 2015-16 Prob.
N Weighted 5,678 182,096
N (Unweighted) 5,585 187,629
Background: community level covariate
Place of residence
Rural Ref
Urban 0.633*** (0.494-0.811) 0.000 1.077*** (1.049-1.102) 0.000
Individual level covariates
Education of the Respondent
Non-Literate Ref
Literate 1.160 (0.947-1.420) 0.152 1.410*** (1.369-1.453) 0.000
Demographic covariates
Age of the Respondent
15-19 years Ref
20-24 years 0.788 (0.528-1.174) 0.241 1.077* (1.017-1.141) 0.011
25-29 years 0.871 (0.584-1.299) 0.498 1.219*** (1.151-1.292) 0.000
30-34 years 1.027 (0.678-1.556) 0.898 1.320*** (1.242-1.404) 0.000
35-39 years 0.953 (0.605-1.499) 0.834 1.379*** (1.285-1.480) 0.000
40-44 years 0.958 (0.573-1.602) 0.870 1.242*** (1.121-1.377) 0.000
45-49 years 0.714 (0.371-1.375) 0.314 1.207* (1.008-1.445) 0.040
Total children ever born
Have 2 or less than 2 children Ref
Have more than 2 children 0.758** (0.634-0.906) 0.002 0.707*** (0.688-0.726) 0.000
Socio-economic covariates
Respondent's current work status
Does not work currently Ref
Works currently 0.981 (0.851-1.132) 0.796 1.180*** (1.111-1.253) 0.000
Wealth quintile
Poorest Ref
Poorer 1.402** (1.145-1.716) 0.001 1.150*** (1.110-1.191) 0.000
Middle 1.240* (1.001-1.537) 0.049 1.395*** (1.344-1.448) 0.000
Richer 1.469** (1.163-1.856) 0.001 1.578*** (1.516-1.642) 0.000
Richest 1.892*** (1.428-2.509) 0.000 1.898*** (1.815-1.987) 0.000
Communication exposure – Mass media
Newspaper
Does not read newspaper Ref
Reads newspaper 0.935 (0.774-1.129) 0.482 1.153*** (1.125-1.182) 0.000
Radio
Does not listen to radio Ref
Listens to radio 1.078 (0.934-1.244) 0.303 0.923*** (0.896-0.951) 0.000
Television
Does not watch Television Ref
Watches Television 1.066 (0.901-1.261) 0.454 1.404*** (1.363-1.447) 0.000
Receipt of at least 3 ANCs
Received less than 3 ANCs Ref
Received 3+ ANCs 10.894*** (8.940-13.276) 0.000 2.854** (2.785-2.925) 0.000
Note: *: p<0.05: Statistically Significant at 5% level **: p<0.01: Statistically Significant at 1% level, p<0.001: Statistically Significant at 0.1% level; n.s.: Not significant.; ref Refers to Reference Category.
Table 10: Adjusted Odds Ratio (AOR) with 95% confidence intervals from the multivariate binary logistic regression (MLR) of anaemia prevalence in Cambodia and India, demographic and health surveys (DHS). Dependent variable: prevalence of any anaemia: coded as 0 if the women had any anaemia and 1 if she did not.
Predictors used in the model Cambodia, DHS, 2014 Prob. India, NFHS -4, 2015-16 Prob.
N Weighted 5,678 182,096
N (unweighted) 5,585 187,629
Background community level covariate
Place of residence
Rural Ref
Urban 1.082 (0.855-1.370) 0.511 1.022 (0.998-1.047) 0.067
Individual level covariates
Education of the Respondent
Non-Literate Ref
Literate 0.873 (0.708-1.077) 0.205 1.088*** (1.060-1.116) 0.000
Demographic covariates
Age of the respondent
15-19 years Ref
20-24 years 1.351 (0.937-1.948) 0.107 1.105*** (1.048-1.166) 0.000
25-29 years 1.693** (1.175-2.439) 0.005 1.206*** (1.142-1.273) 0.000
30-34 years 1.300 (0.889-1.902) 0.176 1.240*** (1.171-1.313) 0.000
35-39 years 1.272 (0.836-1.935) 0.261 1.224*** (1.147-1.305) 0.000
40-44 years 1.451 (0.890-2.367) 0.136 1.288*** (1.179-1.406) 0.000
45-49 years 0.723 (0.364-1.437) 0.355 1.287*** (1.121-1.477) 0.000
Total children ever born
Have 2 or less than 2 children Ref
Have more than 2 children 0.990 (0.832-1.178) 0.913 0.930*** (0.908-0.953) 0.000
Socio-economic covariates
Respondent's current work status
Does not work currently Ref
Works currently 1.184* (1.032-1.360) 0.016 0.930* (0.880-0.983) 0.010
Wealth quintile
Poorest Ref
Poorer 1.145 (0.936-1.401) 0.187 1.104*** (1.701-1.137) 0.000
Middle 1.424** (1.151-1.763) 0.001 1.200*** (1.161-1.240) 0.000
Richer 1.542*** (1.231-1.932) 0.000 1.324*** (1.276-1.374) 0.000
Richest 1.428** (1.095-1.862) 0.009 1.466*** (1.407-1.528) 0.000
Communication exposure – Mass media
Newspaper
Does not read newspaper Ref
Reads newspaper 0.999 (0.834-1.197) 0.991 1.075*** (1.050-1.101) 0.000
Radio
Does not listen to radio Ref
Listens to radio 0.904 (0.787-1.038) 0.153 1.071*** (1.042-1.101) 0.000
Television
Does not watch Television Ref
Watches Television 0.893 (0.756-1.054) 0.893 0.971 (0.954-1.005) 0.117
Receipt of at least 3 ANCs
Received less than 3 ANCs Ref
Received 3+ ANCs 0.935(0.745-1.173) 0.561 1.008 (0.986-1.030) 0.470
Iron or iron and folic acid adherence
Did not consume iron tablets or syrup/ iron and folic tablets or syrup for 90+ days Ref
Consumed iron tablets or syrup / iron and folic
tablets or syrup for 90+ days 1.175 (0.996-1.387) 0.056 1.024*(1.004-1.045) 0.021
Note: *: p<0.05: Statistically Significant at 5% level **: p<0.01: Statistically Significant at 1% level, p<0.001 : Statistically Significant at 0.1% level; n.s.: Not significant; ref Refers to Reference Category. Source: Demographic and Health Surveys.
DISCUSSION
The comparative analyses of the two countries reveal that the women who took iron tablets/ syrup or iron with folic acid for 90 days or more varies from 75.9% in Cambodia to 38.8% in India, while the anaemia prevalence varied from 53.0% in India to 45.4% in Cambodia. The improvement in iron adherence is higher in Cambodia, while the decline in anaemia prevalence is higher in case of India.
CONCLUSION
There is an urgent need to address the situation of anaemic in the Asia region and specifically in these two low middle income countries with medium level human development with high prevalence anaemia falling under the category of severe public health problem. Antenatal care visits seem to be the key to increased adherence to iron and folic supplementation in these two countries.
ACKNOWLEDGEMENTS
The authors acknowledge the use of the data published on the public domain by DHS program implemented by ICF International and partners Blue Raster, The Futures Institute, The Johns Hopkins Bloomberg School of Public Health Center for Communication Programs (JHUCCP), PATH, and Vysnova, and two new partner organizations in 2013—EnCompass and Kimetrica.
Funding: No funding sources Conflict of interest: None declared
Ethical approval: Procedures and questionnaires for standard DHS surveys have been reviewed and approved by ICF Institutional Review Board (IRB)
REFERENCES
1. Brabin BJ, Hakimi M, Pelletier D. An analysis of anaemia and pregnancy-related maternal mortality. J Nutr. 2001;131(2):604-14.
2. WHO. The global prevalence of anaemia in 2011. World Health Organization. 2015. Available at: http://apps.who.int/iris/bitstream/10665/177094/1/9 789241564960_eng.pdf. Accessed on 3 March 2018.
3. Srivastava RK, Kotecha PV, Singh V, Srivastava M. Community Based Intervention (CBI) for Demand Generation of IFA Consumption among Rural Pregnant Women. Int J Recent Scientific Res. 2015;6(7):5023-6.
4. Kanal K, Busch-Hallen J, Cavalli-Sforza T, Crape B, Smitasiri S. Weekly iron–folic acid supplements to prevent anaemia among Cambodian women in three settings: process and outcomes of social marketing and community mobilization. Nutr Rev. 2005;63(12):126-33.
5. Nisar YB, Dibley MJ, Mir AM. Factors associated with non-use of antenatal iron and folic acid supplements among Pakistani women: a cross sectional household survey. BMC Pregnancy Childbirth. 2014;14:305.
6. WHO. Guideline: Intermittent iron and folic acid supplementation in non-anaemic pregnant women. WHO; Geneva, 2012.
Cite this article as: Raut MK, Reddy JC, Rahman MA.Association between adherence to iron intake and anaemia prevalence among women in Cambodia and India: new evidence from recent global