_____________________________________________________________________________________________________ *Corresponding author: E-mail: [email protected];
17(2): 1-16, 2018; Article no.JAERI.35674 ISSN: 2394-1073
Effect of Temperature Regimes on Morphological
Development of Selected Canola (
Brassica napus
)
Genotypes
J. S. Nwogha
1,2*, G. A. Agenbag
1, J. E. Obidiegwu
2and C. O. Amadi
21Department of Agronomy, University of Stellenbosch, South Africa. 2National Root Crops Research Institute, Umudike, Nigeria.
Authors’ contributions
This work was carried out in collaboration between all authors. All authors read and approved the final manuscript.
Article Information
DOI: 10.9734/JAERI/2018/v17i230042 Editor(s): (1) Dr. N. Karunakaran, Department of Economics and Vice-Principal, EK Nayanar Memorial Govt. College, Elerithattu, India. (2)Dr. Chandra Shekhar Kapoor, Department of Environmental Sciences, University College of Science, Mohan Lal Sukhadia University, India. Reviewers: (1)Santosh Kumari, India Agricultural Research Institute, India. (2)Jayath P. Kirthisinghe, University of Peradeniya, Sri Lanka. (3)Mateja Germ, University of Ljubljana, Slovenia. (4)M. M. Uzzal Ahmed Liton, University of Manitoba, Canada. Complete Peer review History:http://www.sdiarticle3.com/review-history/35674
Received 22 November 2017 Accepted 25 February 2018 Published 23 February 2019
ABSTRACT
Seven canola genotypes selected from early and mid-maturing groups of canola genotypes presently planted in the Western Cape canola production area were grown in 3 litre plastic bags filled with a mixture of sand and compost at ratio of 1:1 and irrigated with fully balanced nutrient solution at EC=2.0 in two glasshouses at night/day temperature regimes of 10/15˚C and 15/20˚C. Plant heights were measured at 14 days interval from 28 to 84 days after planting (DAP). Plants were sampled for leaf area (LA) and above ground dry mass (DM) at budding, flowering and seed physiological maturity stages. Plant growth rates (PGR) from planting to budding, from budding to flowering and from flowering to physiological maturity growth stages were calculated. Relative growth rates (RGR) and net assimilation rates (NAR) from budding to flowering and from flowering to physiological maturity stages were also calculated. Days after planting, GDD and PTU at budding, flowering and physiological maturity were correlated with leaf area, dry mass, number of pods plant-1 and pod dry mass plant-1 at budding, flowering and physiological maturity stages to
determine whether there were relationships between the variables. The study showed that by increasing night/day temperature from 10/15˚C to 15/20˚C plant height, number of leaves plant-1 at budding stage, leaf area at budding , plant growth rate (PGR) from planting to budding stage and relative growth rate (RGR) from budding to flowering stage were increased. However, PGR from budding to physiological maturity, RGR from flowering to physiological maturity, net assimilation rate (NAR) from budding to flowering stage, leaf area at flowering and physiological maturity stages, as well as number of flower stems, number of pods plant-1, above ground total dry mass at flowering and physiological maturity stages were decreased. Pod dry mass at physiological maturity decreased by 22.24% to 40.35% for different genotypes which clearly demonstrated the variations in sensitivity of canola genotypes to increasing night/day temperatures and also indicates that canola crop can be genetically improved for heat tolerance.
Keywords: Physiology; canola; morphology; genotypes; heat tolerance; relative growth rate.
1. INTRODUCTION
Canola (Brassica napus) is increasingly becoming an important field crop in South Africa. It can be used to produce high quality cooking oil and margarine, animal feed, biofuel [1] and in crop rotation systems to break the disease chain and improve weed management [2]. It is a native of Canada and is characterized by seeds which contain oil that has a low erucic acid content. Such oils contain less than 2% erucic acid, the solid component of the seed must contain less than 30 micromoles of any one or any mixture of 3-butenyl glucosinolate, 4-pentyl glucosinolate, 2-hydroxy-3-butenyl glucosinolate and 2-hydroxy-4-pentyl glucosinate per gram of air-dry oil free solid [1].
In South Africa and Australia canola is also planted in April or May but the growth take place during winter period with daylight lengths of 9.5 hrs in May to 12 hrs in September and is harvested during October. The phenological development affects the success of canola production and is largely controlled by temperature [3]. Accurate timing of these phenological events is generally considered the most important factor determining crop adaptation and maximum yield in a particular environment [4,5].
Canola developmental stages can be divided into six phases according to Harper and Berkenkamp [6]: Phase 0-Pre-emergence, Phase 1-Seedling, Phase 2-Rosette, Phase 3-stem elongation, Phase 4-flowering, Phase 5-Seed maturation. Under climate change scenario, increase in both the mean and extremes of temperature are expected for many parts of the world [7]. These changes can impact largely on the growth and phenological development of crops. Temperature and to less extent photoperiod have been
reported to be major environmental factors that determine the timing and duration of each of the phenological phases in the physiological development of crops [8]. Many models have been developed to explain the phenological phases that take place during growth and development of crops [9,10], while the physiological mechanisms that govern the transition from one phenophase to another are strongly influenced by environmental factors and have been described using photothermal models [11].
Nwogha et al.; JAERI, 17(2): 1-16, 2018; Article no.JAERI.35674
Ritchie and Smith [19] reported that temperature regime is a major factor controlling the rate of leaf appearance. Hence “phyllochron” is defined as a constant interval of thermal time between successive leaves appearance. However the effect of temperature on the time interval between successive leaves’ appearance (phyllochron) is crop specific for the different field conditions [20]. For Chenopodium photoperiod was reported to decrease the ‘’plastochron” (the time between initiation of two successive primordia) with transfers from inductive to marginally or vice versa [21]. A photothermal duration effect on seed maturation processes has been demonstrated for soybean (Glycine max (L) merril), peanut (Arachis hypogeal L), bambaranut (Vigna subterrenea (L) verdc), rice (Oryza sativa), muccuna spp, maize (Zea mays L), sorghum (Sorghum bicolor) and field pea (Pisum sativum) [22,23,24,25,26,27,28,29]. It has also been reported that photothermal regime influences vernalisation sensitivity of crops. Plants vernalised for 50 days showed greater response to photoperiod than those vernalised for 15 days. As the duration of stem enlongation lengthened in photoperiod-sensitive genotypes by exposure to less inductive photoperiods, a higher number of fertile florets at anthesis are produced, leading to an increased grain number and thereby to higher yield [30]. The timing of leaf emergence, flowering and seed filling as influenced by photothermal exposure and duration are critical factors in crop production, especially in the Mediterranean environment with its characteristic period of increasing temperatures and water stress that occur towards the end of the growing season. This has been extensively studied in other cereal crops as highlighted earlier in this introduction, but such study has not been carried out in canola being that it is relatively a new crop in South Africa. Therefore this study was conducted to determine the effect of temperature regimes on the morphological development of canola in order to maximally exploit its productive potentials, and enhance its agronomic management. In addition, results obtained from this study will serve as a tool for canola breeding for the South African climatic conditions and also provide information with regard to its production potential in new production areas.
2. MATERIALS AND METHODS
The study was conducted in glasshouse controlled environment at department of Agronomy, University of Stellenbosch, South
Africa. Experiment was laid out as a completely Randomized design (CRD) with two temperature regimes and seven genotypes of canola as treatments. Four replications were used and single plant represents an experimental unit. Provision was made for three sampling times.
Seven genotypes of canola evaluated were Hyola 571 CL, AGAMAX, 45Y86, 44Y84, Hyola 50, 43Y85, and Hyola 575 CL. These were planted (four seeds per 3 litre plastic bags filled with the mixture of sand and compost at ratio of 1:1 and irrigated with fully balance nutrient solution at 2.0 EC) in two glasshouses. The genotypes were selected based on the duration of their maturity. 45Y86 and Hyola 50 were mid-maturing genotypes; 44Y84 was mid-early; while, 43Y85, AGAMAX, Hyola 571 CL and Hyola 575 CL were early maturing genotypes. During the seedling stage, plants were thinned to one per bag. The two temperature regimes were set at 15/20˚C and 10/15˚C night/day temperatures respectively. The plants were irrigated twice a day to re-fill the bags to field water capacity.
Daylight length (number of hours of sunshine) was obtained from the South African weather service (http//www.Weathera.com). Crops were planted on 11 February 2014 and the final harvest was done on 14 July 2014 with the result that the day length varied between 13:20 hours at planting and 10:48 hours during the final harvest. The light intensity in the glasshouses and outside exposed environment were measured weekly at 12 h00n from the seedling stage of the plants and averages of 211.6 µmolm-2s-1 for 15/20˚C glasshouse, 249.1 µmolm-2s-1 for 10/15˚C glasshouse and 481.5 µmolm-2s-1 for outside environment were obtained. Temperature loggers were put in each glass house to record the actual temperature of the glass houses to make sure that the set temperatures were achieved.
after budding, it was measured to the tip of the flower bud. The total number of leaves plant-1 was counted after the end of the vegetative stage when budding started (growth stage 3.1). Plants in both glasshouses were sampled at the budding, full flowering and physiological maturity stages to determine the leaf area and dry mass after being oven dried for 48 hrs at 80˚C. Number of flower stems (NFS) and pods plant-1 (NPP) were recorded at final harvest (physiological maturity) stage and pods dry mass (PDM) plant-1 were also obtained after oven drying the samples for 80˚C. Formulae described by Paine et al. [31] were adopted to calculate the following plant growth parameters for different genotypes and temperature regimes. Plant growth rate (PGR) from planting date to budding, from budding to flowering and from flowering to physiological maturity were calculated by dividing difference between the dry mass at beginning(DM1) and at end (DM2) of each growth interval with the number of days needed for the different growth intervals. Relative growth rates (RGR) were calculated by dividing each PGR with DM1 while net assimilation rates (NAR) were calculated by dividing PGR with leaf area at beginning of each growth interval (LA1). Relative growth rate (RGR and net assimilation rate (NAR) were only calculated from budding to flowering and from flowering to physiological maturity because plant did not have any leaf area at planting and seed mass at planting are so small that RGR values would be unrealistic. Because of large differences between plants only mean values and not individual replication values were used. DAP, Growing Degree Days (GDD) and Photo thermal Unit (PTU) at budding, flowering and physiological maturing stages were correlated with LA, DM, NPP and PDM at budding, flowering and physiological maturing stages to determine whether there were relationships between the variables.
Analysis of variance (ANOVA) was performed, using Statistical software, version 12®. The Bonferroni test’s least significant difference (LSD) values were calculated at the 5% probability level to compare treatment means.
3. RESULTS AND DISCUSSION
3.1 Plant Height
As expected all genotypes showed a significant increase in plant height with time (days after planting) and heights of about 150 cm were achieved after 84 days when plants were already
in the pod filling stage (Fig. 1). Genotypes responded differently to temperature treatments. Genotypes, 43Y85, 44Y84, Hyola 575 and Hyola 50 showed little response to the different temperature treatments (10/15˚C and 15/20˚C), but all other genotypes showed a significant increase in plant height with an increase in night/day temperature from 10/15˚C and 15/20˚C. Differences in plant height were in most cases shown from 56 DAP onwards and largest differences were found with early and mid-early maturing genotypes Hyola571 and AGAMAX and 43Y85 because these genotypes were already at the budding stage, which is characterized by rapid stem elongation. But because early maturing genotypes such as 43Y85 and Hyola 575 did not show a large response to temperature, no conclusion can be drawn with regard to the response for different maturity groups.
These results are in agreement with the findings of Qaderi et al. [32] who reported that higher temperatures increased height of canola plants, but Dong et al. 2011 reported that higher temperatures in combination with short day lengths reduced stem height in rice crop in eastern China.
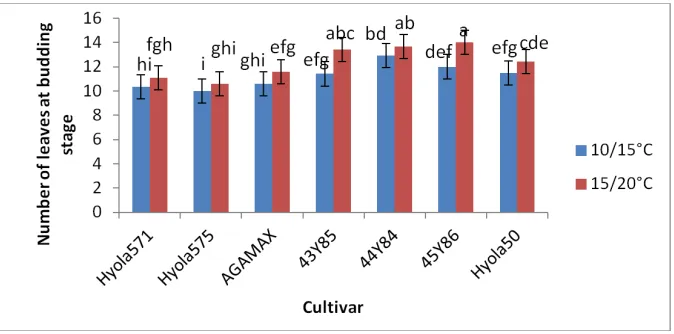
3.2 Number of Leaves
to the findings of Slauenwhite and Qaderi [33] who found no significant difference in leaf numbers plant-1 among four canola genotypes; 46A76, 45H72, 45H24 and 45H21 grown at day/night temperature regimes of 24/20
30/26⁰C, though we don’t know the maturity
Fig. 1. Plant heights (cm) of different canola genotypes, measured at 28, 42, 56, 70 and 84 days after planting (DAP), in response to night/ day temperatures of 10/15
Values with the same alphabetical lettering do not differ significantly at P=0.05
0 50 100 150 200
28 42 56 70
P la n t h e ig h t (c m )
Days After Planting (DAP) 10/15°C 15/20°C hg h f fg c e b d Hyola571 0 50 100 150 200
28 42 56
P la n t h e ig h t (c m )
Days After Planting (DAP) 10/15°C 15/20°C gh h f fg c e AGAMAX 0 50 100 150 200
28 42 56 70 84
P la n t h e ig h t (c m )
Days After Planting (DAP) 10/15°C 15/20°C e e de e c d bc c a 43Y85 0 50 100 150 P la n t h e ig h t (c m )
Nwogha et al.; JAERI, 17(2): 1-16, 2018; Article no.
to the findings of Slauenwhite and Qaderi [33] who found no significant difference in leaf among four canola genotypes; 46A76, 45H72, 45H24 and 45H21 grown at y/night temperature regimes of 24/20˚C and C, though we don’t know the maturity
grouping of these genotypes. These authors also reported that higher temperature reduced leaf number plant-1. This contrasting results may indicate that the lowest temperature regime of 24/20˚C used in their study were already above the optimum for leaf initiation in canola.
Plant heights (cm) of different canola genotypes, measured at 28, 42, 56, 70 and 84 days after planting (DAP), in response to night/ day temperatures of 10/15˚C and 15/20
Values with the same alphabetical lettering do not differ significantly at P=0.05
70 84
Days After Planting (DAP) b d a b 0 50 100 150 200
28 42 56 70
P la n t h e ig h t( cm )
Days After Planting (DAP) 10/15°C 15/20°C fg g e ef c d Hyola575 70 84
Days After Planting (DAP) b d a bc 0 50 100 150 200
28 42 56 70
P la n t h e ig h t (c m )
Days After Planting (DAP) 10/15°C
15/20°C
fg
g deef
c d b c 45Y86 84 a ab 0 50 100 150 200
28 42 56
P la n t h e ig h t (c m )
Days After Planting (DAP) 10/15°C 15/20°C gh h fg ef d e 44Y84
28 42 56 70 84
Days After Planting (DAP) 10/15°C 15/20°C fg g de ef c d bb a a Hyola50
16, 2018; Article no.JAERI.35674
grouping of these genotypes. These authors also reported that higher temperature reduced leaf . This contrasting results may ature regime of C used in their study were already above the optimum for leaf initiation in canola.
Plant heights (cm) of different canola genotypes, measured at 28, 42, 56, 70 and 84 days C and 15/20˚C
70 84
Days After Planting (DAP) b bc a 70 84 c a b 70 84
Days After Planting (DAP) c
c a
Fig. 2. Number of leaves plant-1 of different canola genotypes, measured at the beginning of budding (growth stage 3.1) in response to night/ day temperatures of 10/15⁰C and 15/20⁰C
Values with the same alphabetical lettering do not differ significantly at P=0.05
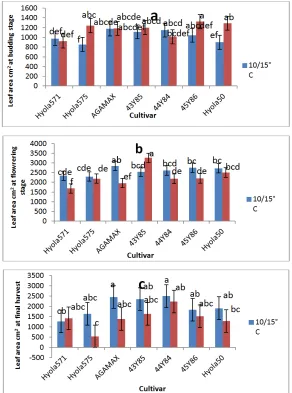
3.3 Leaf Area
In general leaf area plant-1 increased from budding stage to reach a maximum at flowering, where as it started to decrease. At all sampling stages, leaf area plant-1 (cm3) was affected by temperature regime. On average, larger leaf areas were produced at the lower night/day temperature of 10/15˚C during flowering and final harvesting stage (Fig. 3), but not so at budding stage. This tendency indicates an increase in leaf senescence at the higher temperature regime. Different canola genotypes however responded differently to the increase in temperature from 10/15˚C to 15/20˚C.
At budding stage only Hyola 575 and Hyola 50 showed a significant increase in leaf area plant-1 with an increase in temperature (Fig. 3), resulting in significant larger leaf areas plant-1 compared to early maturing Hyola 571 at the higher temperature regime (15/20˚C), but not so at the lower temperature regime (10/15˚C). Although Hyola 571 showed on average the smallest leaf area plant-1 at budding stage, no clear trend due to maturity grouping was shown.
At flowering stage, significant decreases in leaf area plant-1 due to the increase in temperature from 10/15˚C to 15/20˚C were shown for genotypes, Hyola 571, AGAMAX and 45Y86, while the reverse was the case for 43Y85 (Fig. 3). Cultivar AGAMAX produced the largest leaf area plant-1 at the low temperature regime (10/15˚C), while at the higher temperature regime (15/20˚C), the leaf area of 43Y85 plants at flowering were significantly larger than other
genotypes. On average, early maturing genotypes Hyola 571 and Hyola 575 tend to produce the smallest leaf area plant-1.
During the final harvest at growth stage 5.4, leaf area plant-1 with the exception of the early maturing cultivar Hyola 571 tend to decrease with an increase in temperature regime, but differences were not significant (Fig. 3). No significant differences were recorded between genotypes at the 10/15⁰C temperature regime, but at the higher temperature regime (15/20˚C), Hyola 575 showed a significantly smaller leaf area compared to 44Y84. In general mid-early maturing genotypes tend to have larger leaf areas than early maturing or mid maturing genotypes at this stage.
Nwogha et al.; JAERI, 17(2): 1-16, 2018; Article no.JAERI.35674
and stem were the main sites of assimilation, taking up to 46% and 41% of dry matter respectively, but at onset of pod filling, leaves as assimilated only 19% of dry matter produced.
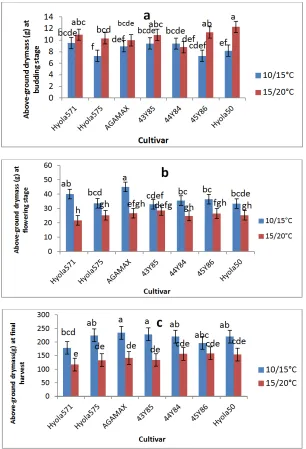
3.4 Dry Mass
Above ground dry mass plant-1 increased with time for all genotypes, but was affected by both cultivar and temperature (Fig. 4).
At budding stage (growth stage 3.1), a higher dry mass plant-1 was generally recorded for plants grown at the higher temperature regime of 15/20˚C, but differences were only significant
for the genotypes Hyola 575, Hyola 50 and 45Y86.
At flowering, above ground dry mass was, with the exception of the early maturing cultivar 43Y85, in all genotypes significantly reduced when grown at the higher temperature regime of 15/20˚C. With the exception of Hyola 571 which produced significantly less dry mass than 43Y85, no differences were recorded between genotypes growing in the 15/20˚C glasshouse. In the cooler glasshouse (10/15˚C), the highest dry mass at flowering was produced by early and mid-early genotypes Hyola 571 and AGAMAX.
Fig. 3. Leaf area plant-1 (cm2) of different canola genotypes , measured at (a)the beginning of budding (growth stage 3.1) (b) flowering and (c ) during the final harvest at growth stage 5.4
At final harvest (FH), no significant interaction between growing temperature regime and cultivar was recorded with dry mass of all genotypes reduced at the higher temperature regime of 15/20˚C (Fig. 4). AGAMAX and 43Y85 recorded significantly higher dry mass than all genotypes in the 15/20˚C, but only higher than Hyola 571 in the 10/15˚C glasshouse. In general early and mid-early maturing types (Hyola 575,Hyola 571, AGAMAX and 43Y85) showed larger reductions in dry mass of 41.31%, 34.69%, 39.65% and 40.65% respectively in the higher temperature glasshouse, while mid and mid to mid-early maturing types, 45Y86, Hyola 50 and 44Y84 showed reductions of 18.81%, 30.40% 28.41% respectively.
In general, canola plants at 15/20˚C temperature regime accumulated more above the ground dry mass at budding stage and more for late maturing genotypes at 10/15˚C temperature regime. It seems that the trait(s) for lateness enabled, to produce late maturing genotype leaves by reducing the time between appearances of successive leaves. Therefore more leaves and leaf area recorded by late maturing genotypes at higher temperature regime during budding stage as shown in Figs. 2 and 3 might be responsible for more above ground dry mass accumulated at budding stage. Canola has been reported to partition more dry mass that leaving in the early growth stage than wheat, barley and sorghum [37,38]. While Faraji et al. [39] and Faraji [40] showed significant positive correlations between leave number before flowering and dry mass as well as final grain yield.
Results from this study are in agreement with earlier studies [32,41,42] reporting an increase in dry matter production during earlier growth stages with higher temperatures, but a decrease in total dry mass production due to more rapid crop development and a shortened growth period.
3.5 Number of Flower Stems
Although all genotypes showed a decrease in the number of flower stems when grown at a lower temperature (10/15˚C) instead of 15/20˚C, differences were only significant for cultivar 44Y84 (Fig. 5). With the exception of Hyola 575, cultivar 44Y84 produced significantly more flower stems compared to other genotypes at the lower temperature regime of 10/15˚C, but at the higher temperature regime (15/20˚C) no significant
differences were recorded between genotypes tested, except for Hola 575 and Hola 50.
The reduction in number of flower stems recorded in the higher temperature regime could be attributed to the fact that the higher temperature regime of 15/20˚C reduced the duration of different growth stages, so that plants have less time to develop flower stems. Similar results were reported by Kutcher et al. [43] who found that high temperatures during vegetative growth reduced number of flowers produced per plant.
Except for the already mentioned difference between 44Y84 and others genotypes at the lower temperature regime, the number of flower stems produced by different genotypes did not show any relationship with their maturity grouping as early and later maturing genotypes produced the same number of flower stems.
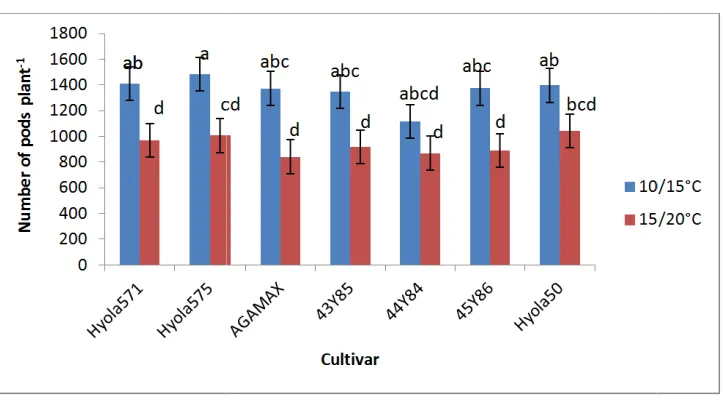
3.6 Number of Pods
The number of pods plant-1 ranged from 841 to 1483. Genotypes differed with respect to number of pods plant-1 when grown at different temperature regimes (Fig. 6). With the exception of Hyola 50 and 44Y84, all genotypes produced significantly less pods plant-1 at the higher temperature regime of 15/20˚C compare to 10/15˚C. However, differences between genotypes at both temperature regimes (10/15˚C and 15/20˚C) were not significant. With exception of 45Y86, later maturing genotypes (44Y84 and Hyola 50) showed less reduction in the number of pods per plant in the higher temperature regime than early and mid-early maturing types.
3.7 Dry Mass of Pods
Nwogha et al.; JAERI, 17(2): 1-16, 2018; Article no.JAERI.35674
this, early maturing 43Y85 showed less response than mid-maturing 45Y86, indicating genetic differences between early maturing genotypes.
The reduced duration of growth stages, increased rate of respiratory break down of accumulated dry mass and accelerated leaf senescence due to the higher temperature
might be the reason for the reduced pod dry mass at the 15/20˚C regime. Kutcher et al. [43] reported that increased mean temperature during vegetative development reduced the number of seeds and size of seed per flower and consequently resulted in seed yield reduction, the view also shared by findings of Morrison and Stewart [44].
Fig. 4. Dry mass plant-1 (g) of different canola genotypes , measured at (a)the beginning of budding (growth stage 3.1) (b) flowering and (c ) during the final harvest at growth stage 5.4
Fig. 5 Flower stems plant-1 of different canola genotypes, measured during the final harvest at growth stage 5.4 in response to night/ day temperatures of 10/15
Values with the same alphabetical lettering do not differ significantly at P=0.05
Fig. 6 Effect of temperature on number of pods plant
during the final harvest at growth stage 5.4 in response to night/ day temperatures of 10/15
Values with the same alphabetical lettering do not differ significantly at P=0.05
3.8 Effect of Temperature on Plant Growth Rate (PGR), Relative Growth Rate (RGR) and Net Assimilation Rate (NAR) of Canola Genotypes at Budding, Flowering and Physiological Maturity Stages
3.8.1 Plant growth rate (PGR)
Plant growth rate (PGR) increased progressively from planting to budding and from flowering to physiological maturity at both temperature
0 10 20 30 40 50 60 70 80 90
Hyola571Hyola575
N
u
m
b
er
o
f
fl
o
w
er
s
te
m
s
p
la
n
t
-1
bcd cd
ab bc
of different canola genotypes, measured during the final harvest at growth stage 5.4 in response to night/ day temperatures of 10/15˚C and 15/20
Values with the same alphabetical lettering do not differ significantly at P=0.05
Effect of temperature on number of pods plant-1 of different canola genotypes, measured during the final harvest at growth stage 5.4 in response to night/ day temperatures of 10/15
and 15/20˚C
Values with the same alphabetical lettering do not differ significantly at P=0.05
Effect of Temperature on Plant Growth Rate (PGR), Relative Growth Rate (RGR) and Net Assimilation Rate (NAR) of Canola Genotypes at Budding, Flowering and Physiological Maturity Stages
) increased progressively from planting to budding and from flowering to physiological maturity at both temperature
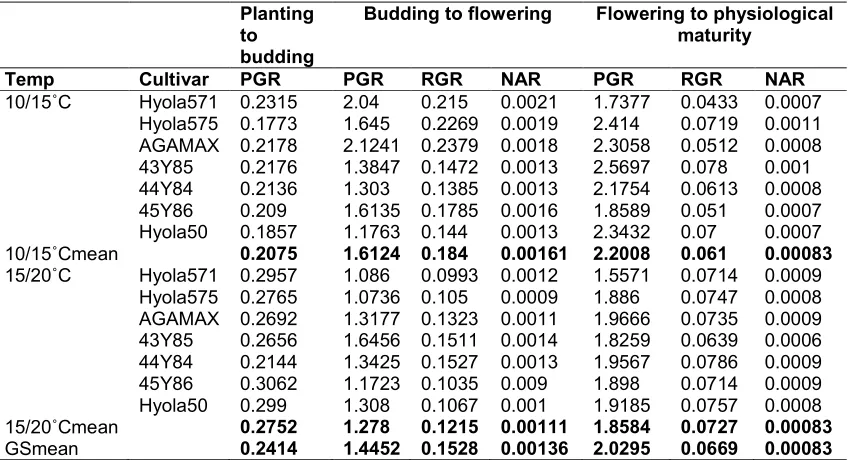
regimes (Table 1). On average a PGR of 0.2414 g plant-1 day-1 was recorded from planting to budding compared to 1.4452 g plant
2.0295 g plant-1 day-1 measured from budding to flowering and from flowering to physiological maturity. However, at each sampling stage, PGR differ as a result of both temperature and genotypes tested. From planting to budding, all genotypes showed a higher PGR at the 15/20 temperature regime compared to the 10/15 temperature regime, but from budding to flowering and flowering to physiological maturity
Hyola575 AGAMAX 43Y85 44Y84 45Y86 Hyola50 Cultivar
10/15
15/20 bc
cd bc cd
a
cd cd
d bcd cd
of different canola genotypes, measured during the final harvest at C and 15/20˚C.
of different canola genotypes, measured during the final harvest at growth stage 5.4 in response to night/ day temperatures of 10/15˚C
regimes (Table 1). On average a PGR of 0.2414 was recorded from planting to budding compared to 1.4452 g plant-1 day-1 and measured from budding to flowering and from flowering to physiological maturity. However, at each sampling stage, PGR differ as a result of both temperature and genotypes tested. From planting to budding, all PGR at the 15/20˚C temperature regime compared to the 10/15˚C temperature regime, but from budding to flowering and flowering to physiological maturity
10/15°C
Nwogha et al.; JAERI, 17(2): 1-16, 2018; Article no.JAERI.35674
a higher PGR was measured for all genotypes at the lower (10/15˚C) temperature regime compared to the 15/20˚C temperature regime. Genotypes also differed at both temperature regimes with respect to PGR. From planting to budding a PGR of 0.2752 g plant-1 day-1 was measured on average for the higher temperature regime of 15/20˚C compared to 0.2075 gplant-1 day-1 for the lower temperature regime (10/15˚C). At the 15/20˚C temperature regime, 45Y86 showed highest PGR, while Hyola 571 recorded the highest PGR at the 10/15˚C temperature regime from planting to budding. From budding to flowering stage, a higher PGR of 1.6124 g plant-1 day-1 were recorded on average by genotypes at the 10/15˚C temperature regime compared to 1.2780 g plant-1 day-1 on average at the 15/20˚C temperature regime. At the 10/15˚C temperature regime, AGAMAX recorded highest PGR, whereas at 15/20˚C temperature regime 43Y86 showed the highest PGR. Genotypes also showed a higher PGR at the lower temperature regime of 10/15˚C compared to higher temperature regime (15/20˚C) from flowering to physiological maturity. At the 10/15˚C temperature regime genotypes grew at 2.2008 g plant-1 day-1, while at the 15/20˚C temperature genotypes grew at 1.8584 g plant-1 day-1. Cultivar, 43Y85 showed the highest PGR at 10/15˚C, whereas at 15/20˚C 44Y84 recorded the highest PGR from flowering to physiological maturity.
The increase in PGR from planting to physiological maturity indicated that PGR for all genotypes followed the normal growth rate curve, which usually increases as plant growth duration increase. Similar results have been reported on soybean, barley and maize [45,46,47,48]. Increased PGR from planting to budding at 15/20˚C temperature regime and decrease from budding to flowering and flowering to physiological maturity suggest that increasing the mean night/day temperature from 12.5˚C to 17.5˚C increased PGR during the vegetative growth stage (planting to budding) by increasing the rate of leaf appearance and expansion, but as growth progress the increase in temperature decreased PGR by increasing the rate of leaf senescence and respiratory break down of photosynthates [49,50,51]. Although genotypes differed in growth rate, it did not show any relationship with their maturity grouping.
3.8.2 Relative growth rate (RGR)
A higher RGR of 0.1528 g g-1 day-1 was shown on average from budding to flowering compared
to a lower RGR of 0.0669 g g-1 day-1 from flowering to physiological maturity (Table 1). From budding to flowering, RGR was higher at the 10/15˚C temperature regime (0.1840 g g-1 day-1) than at the 15/20˚C temperature regime (0.1215 g g-1 day-1), while from flowering to physiological maturity a higher RGR of 0.0727 g g-1 day-1 was recorded by genotypes at the 15/20oC temperature regime compare to a PGR of 0.0610 g g-1 day-1 at the 10/15˚C temperature regime. AGAMAX showed the highest RGR at the 10/15˚C temperature regime, whereas at 15/20˚C temperature regime 44Y84 recorded the highest RGR from budding to flowering stage. From flowering to physiological maturity 43Y85 showed the highest RGR at the 10/15˚C temperature, while AGAMAX showed the highest RGR at 15/20˚C.
The higher RGR observed from budding to flowering compared to flowering to physiological maturity could be attributed to the quantity of the dry mass at the beginning of the growth stage (DM1). The RGR from budding to flowering was calculated by dividing PGR with dry mass at budding, while RGR from flowering to physiological maturity was calculated by dividing PGR with dry mass at flowering stage. The DM at flowering stage was higher than DM at budding stage, therefore as (DM1) increases RGR within any range of growth stages decreases. The same applies for differences between temperature regimes., dry mass at budding stage were higher at 15/20oC temperature regime, so there was lower RGR from budding to flowering stage and vice-visa, while at flowering stage dry mass were higher at 10/15oC temperature regime and lower RGR were observed from flowering to physiological maturity and vice-visa. Similar trends of RGR have been observed on wheat, soybean and maize [52,53,54,55] and therefore show that the efficacy of crops to accumulate dry mass decreases towards the end of the growing season . Differences between genotypes did not show any relationship with maturity grouping.
3.8.3 Net assimilation rate (NAR)
the 15/20˚C temperature regime. From flowering to physiological maturity there was no difference between NAR at different temperature regimes.
Genotypes of the same maturity groups did not show similar NAR values at different sampling stage or temperature regimes.
Fig. 7. Pod dry mass plant-1 of different canola genotypes, measured during the final harvest at growth stage 5.4 in response to night/ day temperatures of 10/15˚C and 15/20˚C
Values with the same alphabetical lettering do not differ significantly at P=0
Table 1. Effect of temperature on plant growth rate (PGR) (g plant-1day-1), relative growth rate of plants (RGR) (g g-1 day-1) and net assimilation rate of plants (NAR) (g cm-2day-1) of the different canola genotypes determined for the periods: Planting to budding; Budding to
flowering and from flowering to physiological maturity.
Planting to budding
Budding to flowering Flowering to physiological maturity
Temp Cultivar PGR PGR RGR NAR PGR RGR NAR
10/15˚C Hyola571 0.2315 2.04 0.215 0.0021 1.7377 0.0433 0.0007
Hyola575 0.1773 1.645 0.2269 0.0019 2.414 0.0719 0.0011
AGAMAX 0.2178 2.1241 0.2379 0.0018 2.3058 0.0512 0.0008
43Y85 0.2176 1.3847 0.1472 0.0013 2.5697 0.078 0.001
44Y84 0.2136 1.303 0.1385 0.0013 2.1754 0.0613 0.0008
45Y86 0.209 1.6135 0.1785 0.0016 1.8589 0.051 0.0007
Hyola50 0.1857 1.1763 0.144 0.0013 2.3432 0.07 0.0007
10/15˚Cmean 0.2075 1.6124 0.184 0.00161 2.2008 0.061 0.00083
15/20˚C Hyola571 0.2957 1.086 0.0993 0.0012 1.5571 0.0714 0.0009
Hyola575 0.2765 1.0736 0.105 0.0009 1.886 0.0747 0.0008
AGAMAX 0.2692 1.3177 0.1323 0.0011 1.9666 0.0735 0.0009
43Y85 0.2656 1.6456 0.1511 0.0014 1.8259 0.0639 0.0006
44Y84 0.2144 1.3425 0.1527 0.0013 1.9567 0.0786 0.0009
45Y86 0.3062 1.1723 0.1035 0.009 1.898 0.0714 0.0009
Hyola50 0.299 1.308 0.1067 0.001 1.9185 0.0757 0.0008
15/20˚Cmean 0.2752 1.278 0.1215 0.00111 1.8584 0.0727 0.00083
GSmean 0.2414 1.4452 0.1528 0.00136 2.0295 0.0669 0.00083
Nwogha et al.; JAERI, 17(2): 1-16, 2018; Article no.JAERI.35674
At the 10/15˚C temperature regime Hyola571 recorded the highest NAR from budding to flowering, while 43Y85 showed the highest NAR at 15/20˚C. From flowering to physiological maturity there were no difference between temperature regimes but genotypes did differ. At the 10/15˚C temperature regime Hyola 575 showed the highest NAR, where as all genotypes, with the exception of 43Y85, showed NAR values of 0008-0009 g cm-1 day-1 at the 15/20˚C temperature regime.
The higher NAR recorded from budding to flowering stage than from flowering to physiological maturity can be attributed to lower leaf area at budding stage (LA1), which was used as the divisor of the PGR from budding to flowering and higher leaf area at flowering (LA1) which was use as divisor of PGR from flowering to physiological maturity. These results agreed with findings of Gaetan et al. [56] and John and Kim [57] who also showed that NAR and photosynthetic efficiency of plants decrease towards the end of the growing season.
4. CONCLUSIONS
The study demonstrated that an increase in night/day temperature from 10/15˚C to 15/20˚C resulted in an increase in plant height, leaf number at budding stage, leaf area at budding, plant growth rate from planting to budding stage, but reduces plant growth rate from budding to physiological maturity, net assimilation rate from budding to flowering stage, leaf area at flowering and physiological maturity stages, as well as the number of flower stems, number of pods plant-1, above ground l dry mass at flowering and physiological maturity stages and pod dry mass at physiological maturity stage by 22.24% to 40.35%.
It also showed that on average, later maturing (mid-maturing) genotypes produced more leaves, leaf area at budding, flowering and physiological maturity stages, as well as above ground dry mass at budding stage compared to early maturing genotypes. However, they produced less flower stems and pods plant-1. At physiological maturity, early maturing genotypes (Hyola 575 and Hyola 571) showed the highest reduction in pods dry mass of 40.35% and 38.28% respectively with an increase in temperature to 15/20˚C. Surprisingly, the early maturing 43Y85 shared most of morphological characteristics of later maturing (mid- maturing) group, instead of those of early and mid-early
types, indicating that the response of different genotypes to an increase in temperature might to a large degree be related to their genetics (genotype) and not to their maturity grouping.
COMPETING INTERESTS
Authors have declared that no competing interests exist.
REFERENCES
1. Anonymous. Canola production manual; 2006.
2. Burton WA, Flood RF, Norten RM, Field B, Potts DA, Robertson MJ, Salibury PA. Identification of variability in phenological responses in canola- quality Brassica juncea for utilization in Australia breeding programs. Australian Journal of Agri-cultural Research. 2008;59:847-881. 3. Morrison MJ, Stewart DW, McVetty PBE.
Maximum area expansion rate and duration of summer rape leaves. Canadian Journal of Plant Science. 1992; 72:117-126.
4. Fischer RA. Growth and water limitation to dryland wheat yield in Australia: A physiological frame work. Journal of Ausralian Instittute of Agricultural Science. 1979;45:83-94.
5. Richards RA. Crop improvement for temperature Australia: future opportunities. Field Crops Research. 1991;26:141-169. 6. Harper FR, Berkenkamp B. Revised
growth key for Brassica campestris and B. napus. Canadian Journal of Plant Science. 1975;55:657-658.
7. IPCC. Climate change 2001; the scientific basis, contribution of working group to the third assessment report of inter governmental panel on climate change. Cambridge University Press. 2001;103. 8. Roberts EH, Summerfield RJ, Ellis RH, Qi
A. Adaptation of flowering in crops to climate. Outlook Agriculture. 1993;22:105-110.
9. Alocija EC, Ritchie JT. A model for the phenology of rice In: Hodges T. (Ed) Predicting crop phenology. CRC Press Boca Raton FL. 1991;181-190.
10. Matthews RB, Hunt LA. GUMCAS: A model describing the growth of cassava (Manihot esculent L. crantz). Field Crop Research. 1994;36:69-84.
of time to flowering in six annual crops In: The development of simple models for fluctuating field environments. Experi-mental Agriculture. 1991;27:11-31.
12. Bertero HD, King RW, Hall AJ. Photoperiod-sensitive development phases in quinoa (Chenopodum quinoa willd). Field Crops Research. 1999;60:231-243. 13. Coolhaas C, Wormer TM. Developmental
differences in rice plants in relation to photoperiodism. Netherland Journal of Agricultural Science. 1953;1:207-216. 14. Piringer AA, Down RJ, Borthwick HA.
Photocontrol of growth and flowering of caryopteris. American Journal of Botany. 1963;50:86-90.
15. Slafer GA, Rawson HM. Sensitivity of wheat phasic development to major environmental factors: A re-examination of some assumptions made by physiologists and modelers. Australian Journal of Plant Physiology. 1994;21:393-426.
16. Kernich GC, Halloran GM, Flood RG. Constant and interchanged photoperiod effects on the rate of development in barley (Hordeum vulgare). Australian Journal of Plant Physiology. 1996;23:489-496.
17. Kiniry JR, Rosenthal WD, Jackson BS, hoogenbroom G. Predicting leaf development of crop plants In: Hodges T (Ed) predicting crop phenology. CRC. Press Boca Raton FL. 1992;29-42.
18. Gustavo A. Slafer, Rawson HM. Intrinsic earliness and basic development rate assessed for their response to temperature in wheat. Euphytica. 1995;83:175-183. 19. Ritchie JT, Ne Smith DJ. Temperature and
crop development In: Hanks RJ, Ritchie EJT. (eds) Modelling plant and soil systems. Madison WI: American Society of Agronomy. 1991;5-29.
20. Cao W, Moss DN. Day length effect on leaf emergence and phyllochron in wheat and barley. Crop Science. 1989;29:1021- 1025.
21. Thomas RG. Correlation between growth and flowering in chenopodium amaranthi-color: Initiation of leaf and bud primordial. Annals of Botany. 1961;25:138-151. 22. Bagnall D, King RW. Response of peanut
(Arachis hypogeal) to temperature, photoperiod and irradiance In: Bertero et al. 1999. Photoperiod sensitive develop-ment phases in quinoa (Chenopodum quinoa willd). Field Crops Research. 1991; 60:237-243.
23. Birch RG. Plant transformation: Problems and strategies for practical application. Annual Review of Plant Physiology and Plant Molecular Biology. 1997;48:297-326. 24. Craufurd PQ, Qi A. Photothermal
adaptation of sorghum (Sorghum bicolor) in Nigeria. Agriculture, Forest and Meteorology. 2001;108:199-211.
25. Craufurd PQ, Hauser IE, Dingkuhn M. photothermal responses of O. sativa and
O. glaberima varieties and interspecific progenies from West Africa. Field Crops Research. 2003;83:313-324.
26. Linneman AR. Phenological development
in Bambara groundnut (Vigna
subterranean) at constant exposure to photoperiods of 10 and 16h. Annals of Botany. 1993;71:445-452.
27. Morandi EN, Casano LM, Riggiado LM. Post flowering photoperiod effects on reproductive efficiency and seed growth in soybean. Field crops Research. 1988;18: 227-241.
28. Poggio SL, Satorre EH, Dethiou S, Gonzalez GM. Pod and seed numbers as a function of photothermal quotient during the seed set period of field pea (Pisum sativum) crops. European Journal Agri-culture. 2005;22:55-69.
29. Qi X, Niks RE, Stam P, Lindhout P. Identification of QTLs for partial resistance to leaf rust (Puccinia hordei) in barley. Theor Appl Genet. 1998;96:1205-1215. 30. Gonzalez FG, Slafer GA, Marelles DJ.
Floret development and spike growth as affected by photoperiod during stem enlongation in wheat. Field Crop Research: In Press; 2003.
31. Paine CET, Matthews TR, Vogt DR, Purves D, Rees M, Hector A, Turnbull LA. How to fit nonlinear plant growth models and calculate growth rates: Updates for ecologists. Methods in Ecology and Evolution. 2012;3:245.
32. Qaderi MM, Kurepin LV, Reid DM. Growth and physiological responses of canola (Bassica napus) to three component of global climate change temperature carbon di oxide and drought. Physiologia Plantarium. 2006;128:710-721.
33. Slauenwhite KLI, Qaderi MM. Single and interactive effects of temperature and light quality on four canola cultivars. Journal of Agronomy and Crop Science. 2013;199: 286-298.
Nwogha et al.; JAERI, 17(2): 1-16, 2018; Article no.JAERI.35674
Hudson JP, (ed) Control of the plant environment. London. 1957;234-242. 35. Rawson HM, Dunstone Rl. Simple
relationships describing the responses of leaf growth to temperature and radiation in sunflower. Australian Journal of Plant Physiology. 1986;13:321-327.
36. Nanda R, Bhargava SC, Rawson HM. Effect of sowing date on rates of leaf appearance, final leaf numbers and areas in Brassica compestris, B. juncea, B. napus and B. carinata. Field Crops Research. 1995;42:125-134.
37. Rood SB, Major DJ, Charnetski WA. Seasonal changes in 14CO2 assimilation
and 14C translocation in oilseed rape. Field Crops Research. 1984;8:341-348. 38. Deligios PA, Faci R, Sulas L, Hoogenboom
G, Ledda L. Predicting growth and yield of winter rapeseed in Mediterranean environments: Model adaptation at fields scale. Field Crops Research. 2013;144: 100-112.
39. Faraji A, Latific N, Soltani A, Rad AHS. Seed yield and water use efficiency of canola (Brasssica napus L.) as affected by high temperature stress and supplemental irrigation. Science Direct. 2009;132-140. 40. Faraji A. Seed weight in canola as a
function of assimilate supply and source-sink ratio during seed filling period. International Journal of Plant Production. 2014;8:255.
41. Gou R, Lin Z, Mo X, Yang C. Response of crop yield and water use efficiency to climate change in the North China plain. Agricultural Water Management. 2010;97: 1185-1194.
42. Nordli EF, Stom, M, Torrie S. Temperature and photoperiod control of morphology and flowering time in two year greenhouse grown Hydrangea macrophylla cultivars. Scienta Horticulturea. 2011;127:372- 377.
43. Kutcher HR, Warland, JS, Brandt SA. Temperature and precipitation effects on canola yields in Saskatchewan, Canada. Agricultural and Forest Meteorology. 2010; 150:161-165.
44. Morrison MJ, Stewart DW. Heat stress during flowering in summer Brassica. Crop Science. 2002;85:431-438.
45. Garmash EV. Temperature controls a dependence of Barley plant growth on mineral nutrition level. Russian Journal of Plant Physiology. 2005;52:338-344.
46. Liu X, Herbet SJ, Baath K, Hashemi AM. Soybean (Glycine max) seed growth characteristics in response to light enrichment and shading. Plant Soil Environment. 2006;52:178-185.
47. Thomas JMG, Boote KJ, Pan D, Allen LH. Elevated temperature delays onset of reproductive growth and reduces seed growth rate of soybean. Journal of Agricultural Science. 2010;1:19-32.
48. Tsimba R, Gregory O, Edmeades, James PM, Peter DK. The effect of planting date on maize phenology: Thermal time durations and growth rates in a cool temperate climate. Field Crop Research. 2013;150:145-155.
49. Munier-Jolain N, Larmure A, Salon C. Determinism of carbon and nitrogen accumulation in legume seeds. CR Biology. 2008;331:780-787.
50. Tsimba R. Development of decision support system to determine the best maize (Zea mays) hybrid-planting date option under tropical typical New Zealand management systems. Massey University. New Zealand. (PHD thesis). 2011;261.
51. Tacarindua CRI, Shiraiwa T, Hamma K, Kumagi E, Sameshima R. The response of soybean seed growth characteristics to increased temperature under near-field conditions in a temperature gradient chamber. Field Crop Research. 2012;131: 165-171.
52. Victor OS, Jaun PM. Modelled wheat phenology captures rising temperatures trends: Shortened time to flowering and maturity in Australia and Argentina. Field Crop Research. 2006;99:136-146.
53. Frederick TS, Martin L, Martthew PR, Hannah EJ. Quantifying the relationship between temperature regulation in the ear and floret development stage in wheat (Triticum aestivum L) under heat and drought stress. Functional Plant Biology. 2013;40:700-707.
54. Tacarindua CRI, Tatshihik SI, Koki H, Etsushi K, Royi S. The effect of increased temperature on crop growth and yield of soybean grown in a temperature gradient chamber. Field Crop Research. 2013;154: 74-81.
temperate climate. Field Crop Research. 2013;150:145-155.
56. Gaetan L, Karine C, Christain F, Bruno A, Catherine G. Relative contributions of light interception and radiation use efficiency to the reduction of maize productivity under
cold temperatures. Functional Plant Biology. 2008;38:885-899.
57. John WP, Kim C. Crop yields components-photo assimilate supply or utilization limited-organ development. Functional Plant Biology. 2014;41:893-913.
_______________________________________________________________________________
© 2018 Nwogha et al.; This is an Open Access article distributed under the terms of the Creative Commons Attribution License (http://creativecommons.org/licenses/by/4.0), which permits unrestricted use, distribution, and reproduction in any medium, provided the original work is properly cited.
Peer-review history: