Detection and Counting the Microaneurysms using
Image Processing Techniques
Manjiri B. Patwari
Institute of Management Studies & Information Technology,Vivekanand
College Campus, Aurangabad MS (India)
Ramesh R. Manza
Dept of CS and IT, Dr. B. A. M. University, Aurangabad
MS (India)
Yogesh M. Rajput
Dept of CS and IT, Dr. B. A. M. University, Aurangabad MS (India)
Manoj Saswade
Director, “Saswade Eye Clinic”, Aurangabad MS (India)Neha Deshpande
Director, Guruprasad Netra Rugnalaya pvt. ltd, Aurangabad MS(India)
ABSTRACT
In this paper, we present an algorithm for the detection and counting of the Diabetic retinopathy lesion ‘Microaneurysms’ by using image processing techniques. Processed fundus Image is able to display the lesions which otherwise are visible only after angiography. This algorithm processes through following steps 1) Preprocessing operations on high resolution fundus images 2) For detecting the Microaneurysms , Morphological operation on high resolution fundus images along with some enhancement techniques like histogram equalization and intensity transformation function.3) Segmentation for finding boundaries of the extracted Microaneurysms. Performance of this algorithm is tested using the fundus image database( 245 images) taken from Dr. Manoj Saswade, Dr.Neha Deshpande This algorithm achieves accuracy of 96% with 0.92 sensitivity and 0 specificity for Saswade database, and also used statistical techniques.
Keywords
Microaneurysms, Morphological operations.
1.
INTRODUCTION
Retinopathy is the general name given to diseases of the retina[1]. The principal problem of the retina caused by diabetes involves the very fine blood vessels which nourish the nerve tissue. High blood sugar causes these vessels to become damaged and then leak fluid and fatty material into the nerve tissue of the retina[2]. Microaneurysms are the first clinically detected lesions. It is Tiny swelling in the wall of a blood vessel. It appears in the retinal capillaries as a small, round, red spot. They are located in the inner nuclear layer of the retina. Microaneurysms are a tiny area of blood lengthened from an artery or vein in the back of the eye. These protrusions may open and leak blood into the retinal tissue surrounding it. Any form of vascular disease or high blood pressure may contribute to a retinal Microaneurysms; however the most common cause is diabetes mellitus[3]. As Microaneuisms are clinically first detected lesions, if diagnosed earlier can help early treatment. Proposed algorithm achieves detection and counting of Microaneurysms at early stage which otherwise is only possible through angiography. Because whenever lesions are not visible through fundus image, Dr. Recommends angiography. In this algorithm we have used the Image Processing techniques for enhancement and detection of Microaneurysms. For detection Morphological operations are performed[5] and for classification receiver operating characteristic curve is
performed the on high resolution fundus images for enhancing the fine details. Then 2D median filter is used for removing the noise of the image. For extraction of the Microaneurysms, threshold function is performed. Lastly Segmentation is done for detecting boundaries of Microaneurysms. This algorithm is tested using 245 live fundus images from the database which is formed with the images given by Dr. Manoj Saswade and Dr. Neha
2.
METHODOLOGY
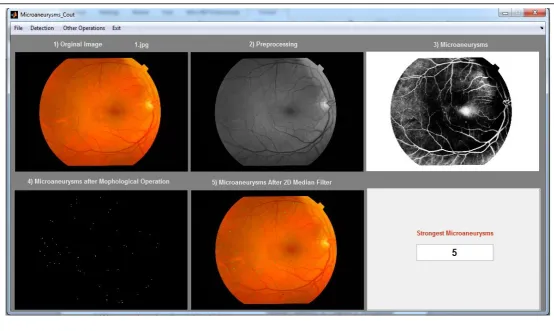
Computer assisted diagnosis for various diseases are very common now a days and medical imaging is playing a vital role in such diagnosis. Image processing techniques can help in detection and counting the Microaneurysms. The proposed algorithm has 3 stages, shown in the figure 1. In first stage preprocessing is done to remove the background noise from input fundus image. Microaneurysms are highlighted and detected in the second stage and in the third stage Microaneurysms are extracted using threshold and segmentation technique is applied for boundaries to detect Microaneurysms.
2.1
PREPROCESSING:
The Preprocessing is done to remove noise from the background and to enhance the image[4]. We have taken out green channel, because green channel shows high intensity as compare to red and blue. Mathematical formula for finding green channel is as follows
Here g is a Green channel and R, G and B are Red, Green and Blue respectively[4].
Fundus Image Green channel image
Figure 2: Fundus image and Green channel
2.2 Enhancement of Microaneurysms
2.2.1 Microaneurysms EnhancementThen we have use the intensity transformation function for enhancing the Microaneurysms of the retina.
Where T is Transformation and r is Intensity
Then we have use Histogram equalization function for enhancing the intensity transformation image.
Here is the minimum value of the cumulative distribution function, M × N gives the image's number of pixels and L is the number of grey levels.
Color Fundus Images Enhance Microaneurysms
Figure 3: Fundus image and Enhanced Microaneurysms images
In the above image 3, normal fundus images and enhanced Microaneurysms of the fundus images are shown.
2.2.2 Blood Vessels Extraction
2.2.2 Microaneurysms Extraction Using Morphological TophatWhere denotes the opening operation
We have use the Morphological open function for thickening the Microaneurysms.
Here is morphological opening, is Erosion and is Dilation.
We have used 2D median filter for highlighting and removing noise from the Morphological open function.
Here Represents a neighborhood centered around location(m,n) in the image.
Then we have use the Threshold function for extracting the Microaneurysms, result images are shown in the figure 4. (7)
Here m1 & m2 are the Intensity Values.
Color Fundus Images Microaneurysms
Figure 4: Fundus images and Images obtained using Threshold to Extract Blood Vessels
2.3 Detection of Boundaries Using
Segmentation
The segment label = k for a pixel is the k which maximizes the ownership of in the MoG model M. That is,
Color Fundus Images Microaneurysms on Original Image
Figure 5: Fundus images and Images showing Boundaries
3.
RESULT
Table 1: Performance Evaluation
Test Result Present Absent
Positive True Positive (TP) False Positive (FP)
Negative True Negative (TN) False Negative
(FN)
Where, TP = True Positive, TN = True Negative
FP = False Positive, FN = False Negative
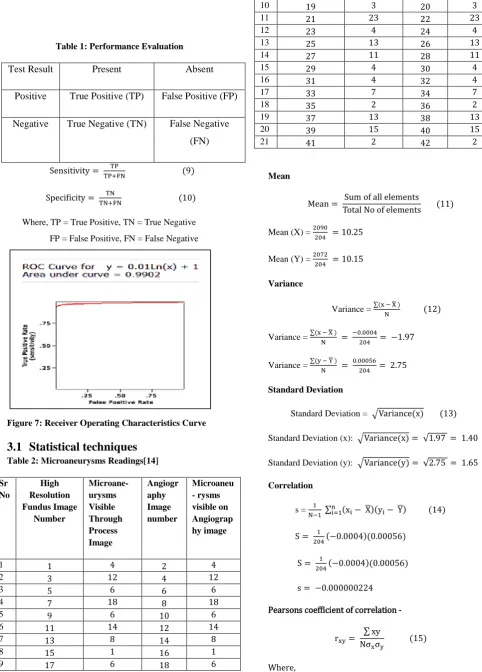
Figure 7: Receiver Operating Characteristics Curve
3.1
Statistical techniques
Table 2: Microaneurysms Readings[14]Sr No
High Resolution Fundus Image
Number
Microane- urysms Visible Through Process Image
Angiogr aphy Image number
Microaneu - rysms visible on Angiograp hy image
1 1 4 2 4
2 3 12 4 12
3 5 6 6 6
4 7 18 8 18
5 9 6 10 6
6 11 14 12 14
7 13 8 14 8
8 15 1 16 1
9 17 6 18 6
10 19 3 20 3
11 21 23 22 23
12 23 4 24 4
13 25 13 26 13
14 27 11 28 11
15 29 4 30 4
16 31 4 32 4
17 33 7 34 7
18 35 2 36 2
19 37 13 38 13
20 39 15 40 15
21 41 2 42 2
Mean
Mean (X) =
Mean (Y) =
Variance
Variance =
Variance =
Variance =
Standard Deviation
Standard Deviation =
Standard Deviation (x):
Standard Deviation (y):
Correlation
s =
Pearsons coefficient of correlation -
xy = 31300 , N = 204,
Product moment correlation coefficient -
N = 204
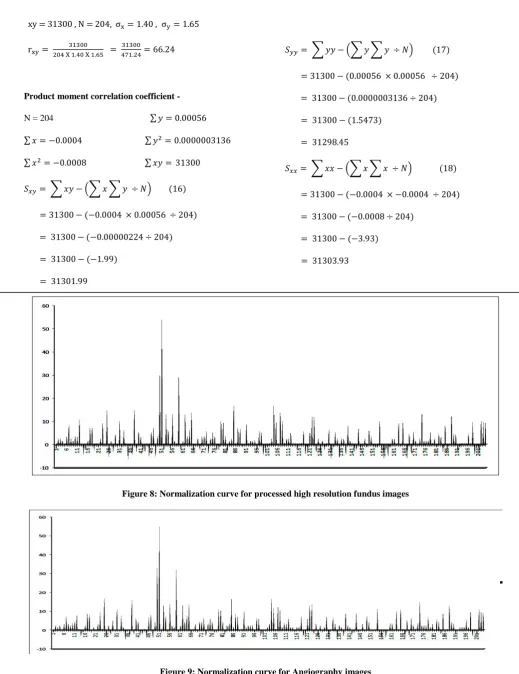
Figure 8: Normalization curve for processed high resolution fundus images
Therefore, the Product moment correlation coefficient has the strong positive correlation among the 204 high resolution verse 204 angiographic images hence it is prove that the proposed is archives the same result as compare to angiographic images.
4.
DISCUSSION
For this algorithm we have used Image processing techniques like Green channel from RGB image because Green channel have high intensity as compare to Red and Blue, then intensity transformation function for highlight the Green channeled image, Histogram equalization for enhancement for the intensity transformed image, 2D Median filter for removing noise, Morphological operation for detecting the Microaneurysms and Threshold function for extraction of Microaneurysms are used. At the end segmentation is done for pointing the Microaneurysms. For manipulating these techniques we have used MATLAB 2012a and with the help of this tool we have designed one GUI for detection and counting of Microaneurysms for result analysis we have used some statistical techniques like mean, variance, correlation, Pearsons coefficient correlation, Normalization is used and due result is strong positive we have achieve the same result as compare to angiography images according to ophthalmologist.
5.
CONCLUSION
In this algorithm we have used Image processing techniques for detection and counting Microaneurysms. We have tested this algorithm using database from Dr. Manoj Saswade and Dr. Neha Deshpande. This algorithm for Saswade database achieves accuracy of 96% with 0.92 sensitivity and 0 specificity and also statistical techniques gives the strong positive results.
6.
ACKNOWLEDGMENTS
We are thankful to University Grant Commission (UGC) for providing us a financial support for the Major Research Project entitled “Development of Color Image Segmentation and Filtering Techniques for Early Detection of Diabetic Retinopathy” F. No.: 41 – 651/2012 (SR) also we are thankful to DST for providing us a financial support for the major research project entitled “Development of multi resolution analysis techniques for early detection of non-proliferative diabetic retinopathy without using angiography” F.No. SERB/F/2294/2013-14. We are thankful to Dr. Manoj Saswade, Directtor “Saswade Eye Clinic” Aurangabad and Dr. Neha Deshpande, Director “Guruprasad Netra Rungnalaya pvt. Ltd”, Samarth Nagar, Aurangabad for providing the Database and accessing the Result.
7.
REFERENCES
[1] DIABETIC EYE DISEASE by Dr. Prema Abraham, MD(Director of vitreoretinal and retinovascular
services)Black Hills Regional Eye Institute, in Rapid City, South Dakota.
[2] Eye Smart eye health Information from the American Academy of Opthalmalogy, The Eye MD Association [3] Clinical Ophthalmology: A Systematic Approach (3rd
edition) Jack J. kanski
[4] Bernhard M. Ege, et al, “Screening for diabetic retinopathy using computer based image analysis and statistical classification” Elsevier, Computer Methods and Programs in Biomedicine 62 (2000) 165–175. [5] Xin Zhang and Guoliang Fan, “Retinal Spot Lesion
Detection Using Adaptive Multiscale Morphological Processing”, Springer-Verlag Berlin Heidelberg 2006, ISVC 2006, LNCS 4292, pp. 490–501, 2006.
[6] Saiprasad Ravishankar, et al, “Automated Feature Extraction for Early Detection of Diabetic Retinopathy in Fundus Images”, 978-1-4244-3991-1, 2009 IEEE. [7] Keith A. Goatman, et al, “Detection of New Vessels on
the Optic Disc Using Retinal Photographs”, IEEE transactions on medical imaging, vol. 30, no. 4, april 2011
[8] B´alint Antal, et al, “An Ensemble-Based System for Microaneurysm Detection and Diabetic Retinopathy Grading”, IEEE transactions on biomedical engineering, vol. 59, no. 6, june 2012.
[9] Anderson Rocha, “Points of Interest and Visual Dictionaries for Automatic Retinal Lesion Detection”, IEEE transactions on biomedical engineering, vol. 59, no. 8, august 2012.
[10] Parisut Jitpakdee,et al, “A Survey on Hemorrhage Detection in Diabetic Retinopathy Retinal Images”, IEEE 2012, 978-1-4673-2025-2.
[11] Arti Yerolkar, Swati Madhe, “Blood Vessel Segmentation and Classification of Retinal Image for Detection of Proliferative Diabetic Retinopathy”. [12] Jyoti D. Patil, Anant. L. Chaudhari, “ Tool for the
Detection of Diabetic Retinopathy using Image Enhancement Method in DIP”, International Journal of Applied Information Systems (IJAIS), Volume3, No3., 2012 – ISSN : 2249-0868.
[13] Sujith Kumar S B, Vipula Singh, “ Automatic Detection of Diabetic Retinopathy in Non-dilated RGB Retinal Fundus Images”, International Journal of Computer Applications (0975 – 888), Volume 47– No.19, 2012.
[14] For Diabetic Retinopathy Lesion table http://www.kellogg.umich.edu/theeyeshaveit/optic-fundus/yellow-white.html
[12] http://www.answers.com/topic/blood-vessel
[13] For drawing ROC Curve
http://www.vassarstats.net/roc1.html
[14] http: // www. retinaandmacula. com/ retina/ retinal _microaneurysm_bonita_springs. htm
Review of Expert Systems for Detection and Diagnosis of Diabetic Retinopathy”, Ciit International Journal of Fuzzy Systems, February 2012, DOI: FS022012001 ISSN 0974-9721, 0974-9608. (IF 1.3). [16] Yogesh M. Rajput, Ramesh R. Manza, Manjiri B.
Patwari, Neha Deshpande, “Retinal Blood Vessels Extraction Using 2D Median Filter”, Third National Conference on Advances in Computing(NCAC-2013), 5th to 6th March 2013, School of Computer Sciences, North Maharashtra University, Jalgaon-425001 (MS) India.
[17] Yogesh M. Rajput, Ramesh R. Manza, Manjiri B. Patwari, Neha Deshpande, “Retinal Optic Disc Detection Using Speed Up Robust Features”, National Conference on Computer & Management Science [CMS-13], April
25-26, 2013, Radhai Mahavidyalaya, Auarngabad-431003(MS India).
[18] Manjiri B. Patwari, Ramesh R. Manza, Yogesh M. Rajput, Manoj Saswade, Neha K. Deshpande, “Review on Detection and Classification of Diabetic Retinopathy
Lesions Using Image Processing
Techniques”, International Journal of Engineering Research & Technology (IJERT), ISSN: 2278-0181, Vol. 2 Issue 10, October - 2013
[19] Manjiri B. Patwari, Ramesh R. Manza, Yogesh M. Rajput, Neha K. Deshpande, Manoj Saswade, “Extraction of the Retinal Blood Vessels and Detection of the Bifurcation Points”, International Journal in Computer Application(IJCA), September 18, 2013. ISBN : 973-93-80877-61-7