Original Research Article
Epidemiological correlates with communicable viral co-infections of
hepatitis B and hepatitis C and non-communicable diabetes among HIV
ART naïve rural patients of Kanchipuram district:
a prospective cohort study
A. Kasthuri
1*, K. Mohana Krishnan
2, S. K. Amsavathani
3INTRODUCTION
Hepatitis B virus, hepatitis C virus and human immune deficiency virus are big challenges to the health care system. These viruses have the ability to spread from one person to another by parenteral route especially sexual
contact. Even though blood transfusion is the most effective method of transmission for all these viruses, introduction of stringent measures have reduced this method of transmission to a certain extent. Concomitant infection of these viruses leads to higher carrier state and severe manifestations of the disease.1
ABSTRACT
Background: The objectives of the study were to study the epidemiological correlates of ART Naïve HIV cases; to
study the incidence of co–infections among them; to find the incidence of onset of diabetes among them.Concomitant infection of hepatitis B virus, hepatitis C virus viruses leads to higher frequency of carrier state and severe manifestations of the disease in HIV patients. There is general agreement that the traditional risk factors for DM (increasing age, minority race, obesity) are still responsible for most of the increased risk in the HIV infected population.
Methods: This study was designed as a prospective cohort study and was done at the Meenakshi Medical College &
Research institute, an academic and Tertiary medical centre in Kanchipuram, Tamil Nadu, South India. The study duration was from June 2004 to June 2010. SPSS 13 was used in the calculation of chi-square and percentages.
Results: Among 207 participants, mean age is 36.04 and the SD is 10.895. There is significant difference between the
incidence of viral co-infections like hepatitis B and hepatitis C (p<0.001). There is significant difference between the incidence of onset of diabetes (p<0.001). The HbsAg and HCV co infection was comparatively lower than the urban population. Among the 50 HIV reactive, non diabetic patients without risk factors, only one found to be Diabetic and another found to be Pre diabetic after 6 months follow-up.
Conclusions: The cost of treatment escalates, when PLHA is co-infected either with viral infections or diabetes, and
also their quality of life becomes poor. So, monitoring of CD4 and CD8 should be done as a routine and screening and early treatment should be made mandatory.
Keywords: Epidemiological correlates, CD4 count, Co-infection, Diabetes
1
Department of Community Medicine, SMMCH&RI, Chennai, Tamil Nadu, India
Department of Microbiology, 2SMMCH&RI, Chennai, Tamil Nadu; 3MMC&RI,Karnataka,India
Received: 14 June 2018
Revised: 29 June 2018
Accepted: 30 June 2018
*Correspondence: Dr. A. Kasthuri,
E-mail: [email protected]
Copyright: © the author(s), publisher and licensee Medip Academy. This is an open-access article distributed under
the terms of the Creative Commons Attribution Non-Commercial License, which permits unrestricted non-commercial use, distribution, and reproduction in any medium, provided the original work is properly cited.
HbsAg and HCV co- infection
Globally an estimated 350–400 million people are chronically infected with hepatitis B virus (HBV), 190 million are chronically infected with hepatitis C virus (HCV) and 33 million are living with HIV infection today. As a result of shared routes of transmission, the HIV, HBV and HCV epidemics overlap, with around 10% of the HIV infected population estimated to have chronic HBV infection and around one- third estimated to have chronic HCV infection.2 The clinical management of HIV infected individuals co infected with HCV or HBV is challenging and HIV infection is known to have a negative impact on the outcome of HCV and HBV infections. Although whether or not HCV directly impacts upon HIV disease progression remains controversial, the complex interactions between HIV/HCV co infection and HAART use and the indirect effect of these on HIV disease progression are increasingly apparent.3-5
Modes of transmission
Irrespective of the route of infection, transmission depends on factors like HIV-1 concentration in the relevant body fluid and susceptibility of the naive host in addition to virus specific determinants. The heterosexual route of transmission accounts for 50% of infections spread in Asia, Sub-Saharan Africa and Latin America (including the Caribbean).6
Alcoholism and HIV
According to MAC’s longitudinal design, among men already at high risk for HIV infection, heavy alcohol consumption, moderate to heavy drug use and younger age further increased their seroconversion by the follow-up visit.7
Aim and objectives
To study the epidemiological correlates of ART Naïve HIV cases.
To ascertain the modes of transmission among the rural population with the available history and evidence.
To assess the correlation between the alcohol and smoking behavior with the HIV reactive status.
To study the incidence of co –infections among them.
To correlate with CD4 count.
To correlate with incidence of diabetes among the same.
METHODS
This study was designed as a prospective cohort study and was done at the Meenakshi Medical College and Research institute, an academic and tertiary medical centre in Kanchipuram, Tamil Nadu, South India. The
study duration was from June 2004 to June 2010. The study was approved by the institutional review board of MAHER University, Chennai. The study population was drawn from the population of newly diagnosed HIV infected ART naïve rural people receiving care at the hospital. The study subjects met the following eligibility criteria.
Inclusion criteria
Inclusion criteria were patients with rural background and HIV Reactive serum, which is confirmed by 3 serological test kits with different principles; visit the hospital ICTC for diagnosis and counseling; not on antiretroviral therapy; consented for testing.
Exclusion criteria
Exclusion criteria were patients or their attendants who did not give informed consent to participate were excluded; HIV reactive patients with urban background were not included.
Only 50 reactive eligible patients in the age group of 13-40 years were selected and informed consent obtained for the research. Patients proforma were collected including the age, sex, stage of the disease and the clinical Parameters. The reactive patients were also tested for co infections like HbsAg and HCV. At the time of follow up visit the venous plasma glucose levels were measured during fasting at least 8 hours and postprandial state i.e., 2 hours after meal from 50 reactive and diabetes risk free ART- naïve patients and the WHO criteria followed SPSS 13 is used in the calculation of chi- square and percentages.
RESULTS
Table 1: Age distribution of PLHA.
Age group in
years Frequency
Percentage
(%) P value
Up to 12 6 2.9
<0.001**
13-40 143 69.1
Above 40 58 28.0
Total 207 100.0
Mean age was 36.04 and the SD is 10.895**- most significant. 69.1% of the people are in the reproductive age group (Table 1). Male cases were more prominent than female patients in the rural population accounting for 69.6%. None were transgenders (Table 2).
Table 2: Sex distribution of PLHA.
Sex Frequency Percentage
(%) P value
Male 144 69.6
<0.001**
Female 63 30.4
Total 207 100.0
Table 3: Marital status of PLHA.
Marital
status Frequency
Percentage
(%) P value
Married 187 90.3
<0.001**
Unmarried 20 9.7
Total 207 100.0
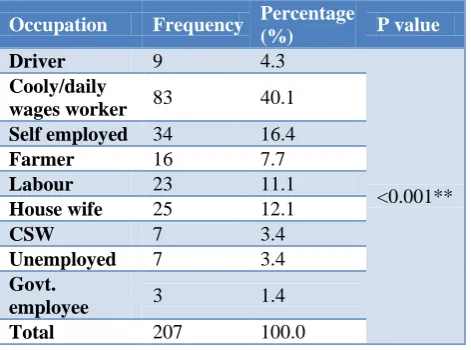
Table 4: Occupation of PLHA.
Occupation Frequency Percentage
(%) P value
Driver 9 4.3
<0.001** Cooly/daily
wages worker 83 40.1
Self employed 34 16.4
Farmer 16 7.7
Labour 23 11.1
House wife 25 12.1
CSW 7 3.4
Unemployed 7 3.4
Govt.
employee 3 1.4
Total 207 100.0
Table 5: HbsAg infection.
Hbs Ag
infection Frequency
Percentage
(%) P value
No 193 93.2
<0.001**
Yes 14 6.8
Total 207 100.0
There is significant difference between married and unmarried on the PLHA status (Table 3). Cooly/daily
wage worker contributes to 40.1% suggesting that PLHA is common among lower socio-economic group in the rural people (Table 4).
Table.6. HCV infection.
HCV
infection Frequency
Percentage
(%) P value
No 204 98.6
<0.001**
Yes 3 1.4
Total 207 100.0
There is significant difference among the PLHA, in the incidence of co- infections with communicable viral co- infections like, hepatitis B virus and hepatitis C virus. CD4 count
All participants were ART-naive by self-report. The mean CD4 counts in this group was 286 cells/mm3 with a median value of 256 cells/mm3. The CD4 counts in this group ranged from 70–726 cells/mm3.
Table 7: CD4 Count.
CD4 count Frequency Percentage
(%) P value
Up to 200 36 17.4
<0.001**
201-350 71 34.3
Above 350 100 48.3
Total 207 100.0
CD4 Mean=404, SD=231, CD8 Mean=402, SD=300.
Modes of transmission
In this study, the heterosexual transmission was the predominant mode of transmission with 96.6% followed by the mother to child transmission with 2.6%. Only 0.5% of the study population found to be transmitted through blood and there was not even a single patient with H/O of homosexual exposure.
HIV and diabetes
From the 50 reactive patients who were eligible and selected from the whole reactive group i.e., 207, only 2% developed type 2 diabetes and another 2% developed impaired glucose tolerance during the 6 months follow-up. Males were 38 and female 12 in number. One male and no female became pre diabetic after 6 months. Similarly, one male and no female became diabetic after 6 months. Mean age was 32 years.
HIV and association of smoking and alcohol
remaining 112 (54.1%) patients were alcoholics (p=0.237). On the whole, the smokers were higher in number than non-smokers comparatively. Of the total, 108 (52.2%) persons were smokers and the 99 (47.8%) persons were non-smokers (p=0.532).
Table 8: Fasting blood sugar.
Fasting blood
sugar Frequency
Percentage
(%) P value
Below 110 49 23.7
<0.001**
110-124 1 0.5
Total 50 24.2
Others 157 75.8
Total 207 100.0
Mean FBS=86, SD=9.29, **=Most significant.
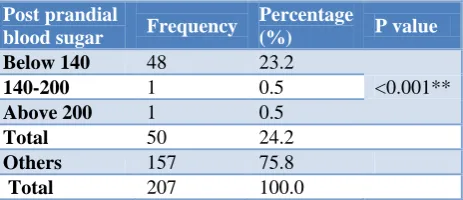
Table 9: Post prandial blood sugar.
Post prandial
blood sugar Frequency
Percentage
(%) P value
Below 140 48 23.2
<0.001**
140-200 1 0.5
Above 200 1 0.5
Total 50 24.2
Others 157 75.8
Total 207 100.0
Mean PPBS=133, SD=23.3; Significant no of people with PLHA became diabetics.
DISCUSSION
HIV and diabetes
Adeel et al determined the relationship between HIV infection and other risk factors for prevalent diabetes in one of the largest prospective cohorts of HIV infected persons and HIV uninfected controls and found that HIV infection per se was not associated with a higher risk of DM. In fact, the risk of DM at baseline was lower in the HIV infected (OR 0.84, 95% CI 0.72-0.97) compared with HIV uninfected persons.8 While HIV infected persons may have higher levels of high sensitivity C-reactive protein levels, those with HCV/HIV co infection have lower levels than uninfected persons.9 How these interact in a given patient to determine the net risk of diabetes requires further study.10
HCV and diabetes
It was found that HCV infection is associated with a higher risk of DM in the HIV infected group, and demonstrated a similar trend in the uninfected group in multivariable analysis (Although this trend did not reach statistical significance, the effect size was similar). This confirms the suggestion from some previous studies that HCV affects the risk of DM in a complex manner, and such risk is influenced significantly by other more traditional risk factors.11,12 Insulin resistance and higher levels of inflammatory cytokines are also seen in patients
with chronic HCV (but not with HCV/HIV co infection) and may be one common pathway leading to a higher risk of DM.13-16
Diabetes and co-infections
Although the optimal method and frequency of screening for diabetes and insulin resistance among those infected with HIV have not yet been determined, research and clinical practice in both HIV and diabetes has provided some insight for designing a basic template for screening. In 2002, recommendations of the International AIDS Society-USA Panel for the management of metabolic complications associated with antiretroviral therapy for HIV-1 infection were published.17 This 12-member panel developed guidelines that were meant to assist physicians in the management of glucose, lipid and body fat distribution abnormalities and bone disease.
Brar et al findings did not suggest an increased prevalence of DM in ART naive HIV infected patients. Although there was a trend toward increased prevalence of DM in HIV-HCV-co infected patients, dominant risk factors associated with DM among ART-naive HIV-infected adults mirrored those of the general population.18 In our study, the new onset of diabetes during follow-up was only 2% which is minimal comparing to the CPCRA clinical trials and the NHANES which showed 3.3% and 4.8%.
The role of HCV co infection in HIV infected persons is also unclear. In the FIRST study, HCV co infection was associated with a higher risk of DM in the antiretroviral-naive HIV infected population who were <50 years old, while no increased risk was found in the Swiss HIV cohort study or an urban cohort of HIV infected persons in New York city.19,20 In our current study, there was no direct relationship with HCV for diabetes was found. But, since it was a small group of patients and short duration of follow-up, we could not have directly correlated the results.
In the present study, one patient with HbsAg co infection found to be present with impaired glucose tolerance. Very few studies have analyzed the HIV and HbsAg co infection and association of type 2 diabetes, which did not revealed any direct relationship. Butt et al suggested that the HIV infected veterans should be screened regularly for diabetes, especially those who are older, are from a minority race, or have HCV co infection.
Modes of transmission
(including the Caribbean).21 The risk of maternal to foetal transmission is 13-40% and can be reduced by treatment of the mother and infant before and after delivery, respectively.22 Postpartum transmission occurs by breast feeding and is associated with a transmission rate of 16%.23 HIV-1 transmission has also been associated with transfusion of infected blood and blood products and reuse of contaminated needles.24
According to NACO 2009-10 Annual Report, the mode of transmission were as follows: heterosexual (87.4%), mother to child (5.4%), IDU (1.6%), MSM (1.5%) and Blood and blood products (1%).25 In our study also, the major route of transmission was heterosexual (96.6%) followed by mother to child 2.6% and percutaneous 0.5%. Sexual transmission among homosexual men is still a significant part of epidemic spread in United States and Europe.26
The overall HIV prevalence among different population groups in 2008-09 continues to portray the concentrated epidemic in India, with a very high prevalence among HRGs – IDU (9.19%), MSM (7.3%), FSW (4.94%) and STI clinic attendees (2.46%), and low prevalence among ANC attendees (0.48%).27 Korzeniewska-Kosela et al in their study found that 30 (75%) were heterosexual, 6 (15%) were homosexual and used intravenous drugs, 2 (5%) just used intravenous drugs, and 1 (2%) had heterosexual contact with prostitutes; for the remaining subject the risk factor for HIV infection was not established.28
In our study, the heterosexual transmission was the predominant mode of transmission with 96.6% followed by the mother to child transmission with 2.6%. Only 0.5% of the study population found to be transmitted through blood. In our findings, FSW (3.4%), ANC (1.4%), IDU (0%) and MSM (0%) were identified. There was no report of Injecting drug users or homosexual transmission in our group. Probably, the drug injecting users, transgenders and homosexuals were very low in number due to the cultural influences in the rural area or may be migrated to the urban setup.
Association of smoking and alcohol with HIV
According to MAC’s longitudinal design, among men already at high risk for HIV infection, heavy alcohol consumption, moderate to heavy drug use and younger age further increased their seroconversion by the follow-up visit. Another study’s data suggests heavy drinking, moderate to heavy use of drugs and younger age were significantly related to seroconversion.29
Six studies were identified with HIV seroconversion as an outcome measure. Five of these indicated that smoking tobacco was an independent risk factor after adjusting for important confounders with adjusted odds ratios ranging from 1.6 to 3.5. Totally, ten studies were identified using progression to AIDS as an end point of which nine found no relation with tobacco smoking.
Tobacco smoking may be an independent risk factor for HIV infection although residual confounding is another possible explanation. Smoking did not appear to be related to progression to AIDS although this finding may not be true in developing countries or with the longer life expectancies seen with highly active antiretroviral therapy.30
CONCLUSION
The cost of treatment escalates, when PLHA is co-infected either with viral infections or diabetes, and also their quality of life becomes poor. So, monitoring of CD4 and CD8 should be done as a routine and screening and early treatment should be made mandatory.
Funding: No funding sources Conflict of interest: None declared
Ethical approval: The study was approved by the Institutional Ethics Committee
REFERENCES
1. NACO. Antiretroviral therapy guidelines for HIV‐1 infected Adult and Adolescents including Post‐ exposure prophylaxis, 2007.
2. Soriano V, Barreiro P, Nunez M. Management of chronic hepatitis B and C in HIV Co infected Patients. J Antimicrobial Chemothery. 2006;57:815–8.
3. Soriano V, Puoti M, Sulkowski M, Cargnel A, Benhamou Y, Peters M, et al. Care of patients Co infected with HIV and Hepatitis C virus. Updated recommendations from the HCV-HIV International Panel. AIDS. 2007;21:1073–89.
4. Nunez M, Soriano V. Management of patients co-infected with hepatitis B virus and HIV. Lancet Infect Dis. 2005;5:374–82.
5. Cooper CL, Breau C, Laroche A, Lee C, Garber G. Clinical outcomes of first antiretroviral regimen in HIV/Hepatitis C Virus co infection. HIV Med. 2006;7:32–7.
6. Cohen MS, Hellmann N, Levy JA, DeCock K, Lange J. The spread, treatment, and prevention of HIV‐1: Evolution of a global pandemic. J Clin Invest. 2008;118(4):1244‐54.
7. Penkower L, Dew MA, Kingsley L, Becker JT, Satz P, Schaerf FW, et al. Behavioral, Health and Psychosocial Factors and Risk for HIV Infection among Sexually Active Homosexual Men: The Multicenter AIDS Cohort Study. American J Public health. 1991;81;2.
8. Butt AA, McGinnis K, Rodriguez-Barradas MC, Crystal S, Michael, Goetz MB, et al. Justice. HIV Infection and the Risk of Diabetes Mellitus. AIDS. 2009;19:23(10):1227–34.
10. Alter MJ, Moyer LA. The importance of preventing hepatitis C virus infection among injection drug users in the United States. J Acquired Immune Deficiency Syndrome Hum Retrovirol. 1998;18(1):6–10.
11. Yoon C, Gulick RM, Hoover DR, Vaamonde CM, Glesby MJ. Case-control study of diabetes mellitus in HIV-infected patients. J Acquir Immune Defic Syndr. 2004;37(4):1464–9.
12. Mehta SH, Brancati FL, Strathdee SA, Pankow JS, Netski D, Coresh J, et al. Hepatitis C virus infection and incident type 2 diabetes. Hepatology. 2003;38(1):50–6.
13. Mann J, Chin J, Piot P, Quinn T. Int Epidemiol AIDS. Sci AM. 1988;259:82-9.
14. de Larranaga GF, Wingeyer SD, Puga LM, Alonso BS, Benetucci JA. Relationship between Hepatitis C virus (HCV) and insulin resistance, endothelial perturbation, and platelet activation in HIV-HCV-co infected patients under highly active antiretroviral treatment. Eur J Clin Microbiol Infect Dis. 2006;25(2):98–103.
15. Maeno T, Okumura A, Ishikawa T, Kato K, Sakakibara F, Sato K, et al. Mechanisms of increased insulin resistance in non-cirrhotic patients with chronic Hepatitis C virus infection. J Gastroenterol Hepatol. 2003;18(12):1358–63. 16. Lecube A, Hernandez C, Genesca J, Simo R.
Proinflammatory cytokines, insulin resistance, and insulin secretion in chronic Hepatitis C patients: A case-control study. Diabetes Care. 2006;29(5):1096–101.
17. Schambelan M, Benson CA, Carr A, Currier JS, Dube MP, Gerber JG, et al. Management of metabolic complications associated with antiretroviral therapy for HIV-1 infection: Recommendations of an International AIDS Society-USA Panel. J Acquir Immune Defic Syndr. 2002;33:257–75.
18. Brar I, Shuter J, Thomas A, Daniels E, Absalon J. A comparison of factors associated with prevalent diabetes mellitus among HIV-Infected antiretroviral-naive individuals versus individuals in the National Health and Nutritional Examination Survey cohort. J Acquir Immune Defic Syndr. 2007;45(1):66-71.
19. Visnegarwala F, Chen L, Raghavan S, Tedaldi E. Prevalence of diabetes mellitus and dyslipidemia among antiretroviral naive patients co infected with
hepatitis C virus (HCV) and HIV-1 compared to patients without co infection. J Infect. 2005;50(4):331–7.
20. Yoon C, Gulick RM, Hoover DR, Vaamonde CM, Glesby MJ. Case-control study of diabetes mellitus in HIV-infected patients. J Acquired Immune Deficiency Syndrome. 2004;37(4):1464–9.
21. Hommes MJT, Romijn JA, Endert E, Schattenkerk JKME, Sauerwein HP. Insulin sensitivity and insulin clearance in Human immunodeficiency virus infected men. Metabolism. 1991;40:651–6.
22. Mother to child transmission of HIV infection. The European Collaborative Study. Lancet.1988;2(8619):1039‐43.
23. Nduati R, John G, Mbori‐Ngacha D, Richardson B, Overbaugh J, Mwatha A, et al. Effect of breastfeeding and formula feeding on transmission of HIV‐1: a randomized clinical trial. JAMA. 2000;283(9):1167‐74.
24. Titti F, Rezza G, Verani P, Butto S, Sernicola L, Rapicetta M, et al. HIV, HTLV‐1, and HBV infections in a cohort of Italian intravenous drug abusers: Analysis of risk factors. J Acquir Immune Defic Syndr. 1988;1(4):405‐11.
25. NACO. Annual report. 2009-10.
26. Holmberg SD. The estimated Prevalence and incidence of HIV in 96 large metropolitan areas. American J of Public Health. 1996; 86:64-654. 27. NACO. Annual report. 2010-2011.
28. Korzeniewska-Kosela M, FitzGerald JM, Vedal S, et al. Spectrum of tuberculosis in patients with HIV infection in British Columbia: Report of 40 cases. CMAJ. 1992;146(11):1927–34.
29. Chan DJ. Factors affecting sexual transmission of HIV-1: Current evidence and implications for prevention. Curr HIV Res. 2005;3:223–41.
30. Furber AS, Maheswaran R, Newell JN, Carroll C. Is smoking tobacco an independent risk factor for HIV infection and progression to AIDS? A systemic review, Sexually Transmitted Infection. 2007;83:41-6.
Cite this article as: Kasthuri A, Krishnan KM,