Abstract—Pan-sharpening has become a widely used tool to
produce remotely sensed imagery which is rich in both spatial and spectral content. The main requirements on the pan-sharpening algorithms are to maximize the spatial content of the result and, simultaneously, to minimise spectral distortions, which may occur during processing. This paper presents a method for merging a set of multispectral bands with the higher spatially resolved panchromatic band. The experiments for the validation of the proposed pan-sharpening method were carried out with the use of data from modern very high resolution satellite instruments (IKONOS, THEOS, GeoEye-1). The results suggest that the spatial quality of the resulting images is significantly improved, while the spectral quality is maintained. Moreover, the actual merging algorithm is fast and straightforward to implement, since it mainly consists of linear operations with matrices.
Index Terms—Pan-sharpening, image fusion, satellite imagery, image processing.
I. INTRODUCTION
Pan-sharpened images found applications in many fields of Remote Sensing and GIS [1], [2]. Because of various physical and constructional restrictions, current satellite imagery may exhibit either high radiometric fidelity (multispectral data) or high spatial quality (panchromatic images) [3], [4]. The process of pan-sharpening aims at obtaining the imagery, which is rich in both spectral and spatial content, by combining various bands of the same or different satellites [5].The procedures of the underlined imagery combination are sometimes referred to as image fusion or image merging methods.
A number of imagery merging methods have been proposed and their performances evaluated over approximately two decades of active development [5]–[8]. The successful algorithms are used in the industries and implemented in commercial and public-domain software products [9]-[11].
The pan-sharpened image is a synthesized product, which has to be as close to the reality as possible [5]. Therefore, the traditional requirement on the merging method is to produce a highly spatially resolved image, which contains unvaried radiometric data [5], [6].
The pan-sharpening algorithms are categorised into several groups by certain distinctive criteria [12]. The methods belonging to the same categorisation group often share common advantages and drawbacks. For example, the multiresolution-analysis-based fusion methods are
Manuscript received September 24, 2012; revised December 18, 2012. Vladimir M. Buntilov is with the Department of Computer Engineering, Faculty of Engineering, Mahidol University, Phuttamonthon, Thailand, 73170 (e-mail: [email protected]).
intrinsically designed to preserve radiometric characteristics of the imagery. However, the product often suffers from spatial impurities [7], [8], [13]. Contrary, transformation-based pan-sharpening methods traditionally produce the sharpest possible images. In addition, these methods are straightforward to implement since they are based on well-developed techniques of colour system transformation. A serious drawback of the transformation-based pan-sharpening is the radiometric distortions in the fused product [13]. This problem demonstrates itself as a change of colours of the objects in the pan-sharpened image compared to the original multispectral image. Therefore, a major effort was applied to overcome the highlighted disadvantage [14]-[17].
This paper uses the transformation-based approach for pan-sharpening as a framework and presents a method for the adjustment of the actual transformation according the merging imagery. The adjustment aims to minimise the radiometric distortion in the final product. The experiments showed that the proposed pan-sharpening algorithm produces the imagery with high quality radiometric and spatial content. The procedures are uncomplicated for implementation and computationally effective.
The rest of the paper is organised as follows: Section II describes the proposed pan-sharpening method and discusses the details of its implementation. Section III presents the experiments on testing the algorithm using real satellite imagery. Section IV concludes the paper.
II. CONTENT-SPECIFIC TRANSFORM PAN-SHARPENING The proposed pan-sharpening algorithm can be categorised as the transformation-based or component substitution method. A generalisation of component substitution methods is described in [15]. The current paper presents a short review of this category of fusion algorithms.
A. A Framework for Transformation-Based Pan-Sharpening
A general scheme of transformation-based pan-sharpening methods can be described as follows:
1) Convert a set of multispectral bands by a suitable transform to a different representation domain. The choice of the actual transform is governed by various restrictions and motivations. For example, often the multispectral set consists of three bands (which control R, G and B values in the true-colour composite image). Therefore, in this case the transformation has to be able to proceed with a triplet of bands. A traditional choice of the transform for sharpening triplets of bands is the IHS colour system transformation [18].
Pan-Sharpening of Multispectral Imagery Using
Content-Specific Orthogonal Linear Transform
Choose the component, which contains the majority of spatial content and replace it with the panchromatic image. Usually the panchromatic image is adjusted before the replacement takes place in order to minimise
colour distortions in the final product.
3) Perform the inverse transform to yield the enhanced bands. Therefore, the transform has to be invertible. The choice of a particular transform for pan-sharpening is often based on empirical considerations. For instance, the Intensity component of the IHS transform bears most of the spatial details. Therefore, it is replaced with the higher spatially resolved panchromatic image. Similarly, if the PCA transform is employed [21], the first principal component of the transformed bands is the richest in spatial details, thus it is substituted by the sharp panchromatic band. In all cases, the other components, usually, remain unmodified during the merging procedures.
B. Motivation for Content-Specific Linear Transform
If the set of n multispectral bands is denoted as {MS}n, individual multispectral bands as MSi, and the panchromatic
image as PAN, the general procedures for transformation-based pan-sharpening can be formulated as: 1) {W}n=A({MS}n) – transformation of n multispectral
bands by a suitable transform A. The transformation producesncomponents Wi.
2) W1=PAN*– substitution of the most spatially informative
component W1 by a higher resolved adjusted
panchromatic image.
3) {MS*}n=A-1({W*}n)– performing the inverse transform
to obtain the sharpened bands MSi*.
Often the transform A is expressed as a linear transformation. In this case, each multispectral band MSiis
reshaped to aM*N×1 column vectormsi, where Mand Nare
the height and width of MSibands. Afterwards, a matrix V
containing the column-vectors msiof the multispectral bands
as its columns is formed: V= [ms1…msn]. The transformation
is performed by the matrix multiplication:
1
1
n n
w
w
ms
ms
A
M
N nM
N n n n
(1)
If a triplet of bands has to be transformed, matrix A must be 3×3 in size. For instance, the matrix for forward IHS transform [18]can be written as:
3 3
1/ 3
1/ 6
1/ 6
1/ 3
1/ 6
2 / 6
1/ 3
2 / 6
0
A
(2)For an arbitrary number of bands n, A can be generally expressed as:
An×n
11 1n n1 nn
a
a
a
a
(3)After the component substitution𝑤1→ 𝑤1∗, the inverse
transform is performed as follows:
s
1
1 2
n n
n
m
ms
w w
w
B
M
N
M
N n n n
(4)
whereB=A-1.
In the replacement step, the adjusted PAN*is reshaped to a column vectorpan*, which substitutesw1, i.e:
1
w
pan
(5) Equation (5) can be modified to:
1 1 1 1
w
w
pan
w
w
(6) where𝛿 = (𝑝𝑎𝑛∗− 𝑤1).Thus, (4) changes to:
1 1 2
1 2
1 11 1
,
,
,
,
,
, 0,
, 0
n n
n
n n
ms
ms
w
w
w
B
w w
w
B
B
ms
ms
b
b
(7)where 𝑚𝑠1… 𝑚𝑠𝑛 is the original multispectral data, 𝛿 is the
column vector from Equation (6), and 𝑏11… 𝑏1𝑛 are the
coefficients of the first row of the inverse matrix.
As can be seen from Equation (7), to perform pan-sharpening it is sufficient to specify only ncoefficients
𝑏11… 𝑏1𝑛, whereas the knowledge about entire forward and
inverse transform matrices is not required.
Moreover, the components 𝑤2… 𝑤𝑛 remain unmodified.
The only component which changes is w1. This component is
calculated as the weighted average of the original multispectral bands with the weights 𝑎11… 𝑎𝑛1 – the
coefficients of the first column of the forward transform matrix A.
As can be seen from (2), in IHS-based pan-sharpening the intensity component is calculated as a simple average of the multispectral bands. Therefore, replacing w1 by the
panchromatic image almost always distorts the colours in the fused product.
In this paper it is proposed to modify the forward and, as a result, the inverse transforms to minimise the radiometric distortions in pan-sharpened images. The assumption undertaken is that if the transform is constructed in a manner that the obtained component to be replaced (W1) is similar to
the replacing high-resolution image (PAN*), then the radiometric distortions in the pan-sharpened product will be minimised. Suppose PAN_LOW* denotes the image PAN*, which is downscaled to MSispatial resolution. Ideally, if the
component W1is identical toPAN_LOW*, then there will be
no radiometric deficiencies in the final image. Therefore, the coefficients 𝑎11… 𝑎𝑛1must be chosen to satisfy the condition:
11 1 1
_
n nPAN
LOW
a MS
a MS
(8) wherePAN_LOW*is the image PAN*degraded to the spatial resolution of the multispectral bands.In practice, the equality in (8) is virtually never reached and the coefficients are adjusted to make the weighted average as close as possible to PAN_LOW*.
The presented above formalisation is an established methodology [15]. The coefficients 𝑎11… 𝑎𝑛1 can be
response curves [15], [16].
In the proposed method the weights coefficients are taken to be proportional to the similarity between the individual
MSiandPAN_LOW*. This ensures that the most similar to
PAN_LOW*bands contribute significantly to W1, while bands
of smaller similarity affectW1 less. The similarity is
calculated as the correlation between the MSiand PAN:
i
i
i ms pan
i
mn pan
E
ms
pan
c
(9)whereE{∙} denotes the expected value and σ – the standard
deviation. The determination of the scaling factor between the correlation coefficients and 𝑎11… 𝑎𝑛1is discussed below.
Once 𝑎11… 𝑎𝑛1 are determined, the required 𝑏11… 𝑏1𝑛
coefficients can be found as follows: Since B=A-1, by the definition of the inverse matrix, it can be written:
11 1 11 1
1 1
1
0
0
1
n n
n nn n nn
b
b
a
a
BA
I
b
b
a
a
(10)where I – is the identity matrix of an appropriate size. Therefore, the relationship between 𝑎11… 𝑎𝑛1 and
𝑏11… 𝑏1𝑛is:
11 11 21 12 n1 1n
1
a b
a b
a b
(11) In particular, given𝑎11… 𝑎𝑛1, Equation (11) is satisfied if:1 1
1
1
,
1
i ib
i
n
n
a
(12)However, if matrix A is formed to be orthogonal, then
B=AT, and:
1i i1
,
1
b
a i
n
(13) To make Aorthogonal, the coefficients 𝑎11… 𝑎𝑛1has to benormalised according to the condition:
2
1
1
1
in
a
i
(14)Thus, the presented pan-sharpening procedures use the same set of coefficients (henceforth denoted as 𝑎1… 𝑎𝑛) for
both forward and backward linear transform of multispectral data. The proposed method is denoted as OLTC, which stands for “Orthogonal Linear Transform based on
Correlation”.
C. The algorithm of the proposed method
This subsection summarises the procedures of the proposed pan-sharpening method. Firstly, the multispectral bands are resampled to match the scale of the panchromatic
band. After the resampling, the registration of the images is performed. The actual merging procedures are as follows: 1) Calculate the correlation coefficients between each of n
multispectral bands and the panchromatic image:
i i
c
corr MS PAN
(15)2) Normalize the correlation coefficients. The output of this step serves as transform coefficients 𝑎1… 𝑎𝑛:
2
/
,
1
1
i i i
n
a
c
c
i
n
i
(16)3) Obtain the weighted average of the multispectral bands according to the formula:
1
n
i i
i
W
a
MS
(17)4) Adjust the PAN image to match its histogram to W. The adjusted image is denoted as PAN*.
5) Calculate the details image:
D
PAN W
(18) 6) Add the weighted spatial details to the originalmultispectral bands yielding the pan-sharpened multispectral images:
i i i
MS
MS
D a
(19)III. EVALUATION OF THE PROPOSED TECHNIQUE Validation the proposed pan-sharpening method was conducted using real very high resolution imagery. To test the performance of the method for various spatial resolutions and different spectral properties of imagery, data from several satellites were employed, i.e. IKONOS [19], THEOS [20], and GeoEye-1 [19]. The spatial resolutions of the corresponding panchromatic and multispectral bands of the satellites are given in Table I.
Several testing scenes were extracted from full imagery datasets. The sizes of panchromatic images employed in the experiments can be found in Table I. Before the actual pan-sharpening takes place, the multispectral bands were resized to match the scale of the panchromatic band. Additionally, all bands, corresponding to the same satellite, were aligned with the common reference.
The purpose of the current experiments was to check that the proposed method of calculating the transform coefficients helps to reduce colour distortions in the pan-sharpened product. Therefore, the well-known transformation-based fusion methods were chosen for comparison with OLTC: 1) IHS-based method (IHS) [21]: In this method the
imagery was sharpened by replacing its intensity component Iby the panchromatic band.
2) PCA-based method (PCA) [21]: In this method the first principal component PC1 of the entire set of the multispectral bands was replaced by the panchromatic band.
transform (OLTC).
For all pan-sharpening methods, before the component substitution, the panchromatic image was adjusted to match its histogram to the corresponding component.
Each used satellite imagery dataset contains one panchromatic band and four multispectral bands. The correlations between the multispectral and panchromatic bands within the same dataset are provided in Table I. The order of the bands for all datasets was rearranged in the experiments as follows: MS1corresponds to the original R
band, MS2– G, MS3– B, and MS4– NIR.
PCA and OLTC methods can handle arbitrary number of bands; therefore these methods process all bands of an entire dataset at the same time. IHS merging procedures were performed separately for different triplets of multispectral bands.
TABLE I: SATELLITE IMAGERY FOR THE EXPERIMENTS
IKONOS THEOS GeoEye-1
spatial resolution, m
MSi 4 15 0.46
PAN 1 2 1.84
size, px
PAN 1024×1024 2048×2048 2000×2000
correlation
PAN PAN PAN
MS1 0.65 0.73 0.82
MS2 0.68 0.72 0.86
MS3 0.59 0.70 0.79
MS4 0.75 -0.60 0.48
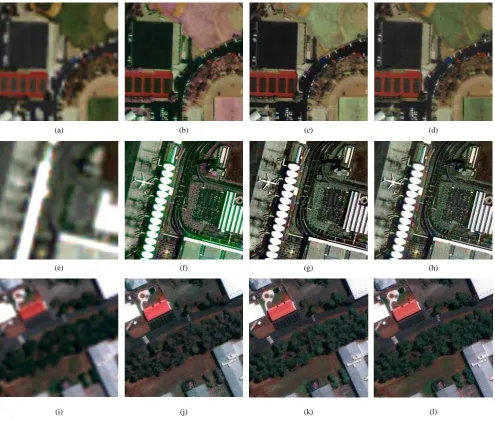
The results of pan-sharpening are displayed in Fig. 1. For visual examination, only patches of the entire tested scenes are present. The multispectral bands are combined to form the natural colour composite images.
(a) (b) (c) (d)
(e) (f) (g) (h)
(i) (j) (k) (l)
(a)-(d) – IKONOS dataset; (a) – the original multispectral image, (b) – IHS, (c) – PCA, and (d) – OLTC results; (e)-(h) – THEOS dataset; (e) – the original multispectral image, (f) – IHS, (g) – PCA, and (h) – OLTC results; (i)-(l) – GeoEye-1 dataset; (i) – the original multispectral image, (j) – IHS, (k) – PCA, and (l) – OLTC results.
Fig. 1. Patches of the true colour composite of pan-sharpened images.
A. Spatial quality
As can be seen from Fig. 1, all pan-sharpening methods significantly improve the spatial quality of multispectral
around sharp edges.
Examining the results it was found that PCA technique in general produces very crisp images. However, the author finds that edges of the objects of PCA-sharpened images are exaggerated because of change of average lightness of objects (as will be discussed below). Therefore, at least partially, the moderate spatial superiority of PCA-fused images is a perceptual effect.
B. Radiometric/Spectral Quality
Radiometric quality of the pan-sharpened images was assessed by visual examination of true- and false-colour composite images. A severe colour distortion is apparent in natural colour composites of IHS-sharpened bands. In particular, green areas in IKONOS dataset became purple in the resulting image as can be seen in Fig. 1b. It was concluded that IHS-sharpened true-colour images have the poorest colour fidelity among results from other tested methods for all datasets.
The images pan-sharpened by PCA technique often have a colour distortion in terms of excessively light green areas. This effect is clearly observable in Fig. 1c and Fig. 1g. The true colour composite images produced by the proposed method still have the colour distortions, such as too light greenery, but not as severe as for PCA or HIS techniques.
The NIR band was used in all testing datasets. However, for the sake of brevity it is not displayed in Fig. 1. Visual analysis of false colour composites (NIR, G, B) proved that PCA-sharpened images of IKONOS have the poorest radiometric quality. For other datasets, PCA and OLTC produce satisfactory results with superiority over IHS method. In all cases when NIR band was included for performance analysis, the resulting image from the proposed pan-sharpening method OLTC had satisfactory or superior quality compared to the results of other techniques employed in the experiments.
In general, it can be concluded that the proposed pan-sharpening method produces stable results which are often superior to the images obtained by other tested pan-sharpening procedures.
IV. CONCLUSION
This paper presents a new method for pan-sharpening of multispectral imagery. The method can be categorised as based on transformation or component substitution. A linear orthogonal transformation of the multispectral data is employed; whereas the coefficients of the transform are calculated according to the correlation between the multispectral and the panchromatic bands. The results suggest that the proposed procedures are stable in terms of fusing imagery of different spectral properties and various spatial resolutions. In general, the pan-sharpened by the proposed method imagery has as high spatial resolution as the images processed by other analogous methods. At the same time, radiometric fidelity is preserved at higher degree when the images are processed by the proposed procedures.
ACKNOWLEDGMENT
The author would like to express gratitude to the clergy and parishioners of the Christian Orthodox Church in Thailand for constant spiritual and moral support.
The author thanks Mahidol University of the Kingdom of Thailand for financial assistance and for providing opportunities for professional development.
The IKONOS and GeoEye-1 data for the experiments were downloaded from Space Imaging LLC© web-site: http://www.geoeye.com/CorpSite/resource/sample_imagery. aspx.
The THEOS imagery for the experiments was provided by Geo-Informatics and Space Technology Development Agency of Thailand (GISTDA).
REFERENCES
[1] GeoEye, Inc., “Solutions by Industry,” [Online]. Available: http://www.geoeye.com/CorpSite/solutions/by-industry/
[2] Digital Globe, Inc., “Digital Globe Industry Applications,” 2012. [Online]. Available: http://www.digitalglobe.com/industries/
[3] T. Lillesand, R. Kiefer, and J. Chipman, Remote Sensing and Image Interpretation, 5th ed. New York: John Wiley & Sons, Inc., 2004. [4] C. Latry, H. Vadon, M. Lefevre, and H. De Boissezon, “Spot5 thx: a
2.5m fused product,” in Second GRSS/ISPRS Joint Workshop on Remote Sensing and Data Fusion over Urban Areas, 2003, pp. 87–89. [5] L. Wald, T. Ranchin, and M. Mangolini, “Fusion of satellite images of
different spatial resolutions: assessing the quality of resulting images,” Photogrammetric Engineering and Remote Sensing, vol. 63, no. 6, pp. 691–699, 1997.
[6] Z. Wang, D. Ziou, C. Armenakis, D. Li, and Q. Li, “A comparative analysis of image fusion methods,” IEEE Transactions on Geoscience and Remote Sensing, vol. 43, no. 6, pp. 1391–1402, 2005
[7] F. Laporterie-Dejean, H. de Boissezon, G. Flouzat, and M.-J. Lefevre-Fonollosa, “Thematic and statistical evaluations of five panchromatic/multispectral fusion methods on simulated PLEIADES-HR images,” Information Fusion, vol. 6, no. 3, pp. 193–212, 2005.
[8] C. Thomas, T. Ranchin, L. Wald, and J. Chanussot, “Synthesis of multispectral images to high spatial resolution: A critical review of fusion methods based on remote sensing physics,” Geoscience and Remote Sensing, IEEE Transactions on, vol. 46, no. 5, pp. 1301–1312, May 2008.
[9] PCI Geomatics, Inc., “Geomatica 2012 Technical Specifications,” 2012. [Online]. Available:
http://www.pcigeomatics.com/pdf/Geo2012/Pan Sharpening.pdf [10] ESRI, “Fundamentals of panchromatic sharpening,” 2012. [Online].
Available: http://resources.arcgis.com/en/help/main/10.1/index.html#/ /009t000000mw000000g
[11] GRASS GIS, “GRASS GIS Manual,” 2012. [Online]. Available: http://grass.fbk.eu/gdp/html grass64/i.fusion.brovey.htmlg
[12] C. Pohl and J. L. van Genderen, “Multisensor image fusion in remote sensing: concepts, methods and applications,” International Journal of Remote Sensing, vol. 19, no. 5, pp. 823–854, 1998.
[13] T.-M. Tu, S.-C. Su, H.-C. Shyu, and P. S. Huang, “A new look at IHS-like image fusion methods,” Information Fusion, vol. 2, no. 3, pp. 177–186, 2001.
[14] M. Choi, “A new intensity-hue-saturation fusion approach to image fusion with a tradeoff parameter,” IEEE transactions on Geoscience and Remote Sensing, vol. 44, no. 6, pp. 1672–1682, 2006.
[15] B. Aiazzi, S. Baronti, and M. Selva, “Improving component substitution pansharpening through multivariate regression of ms+pan data,” IEEE Transactions on Geoscience and Remote Sensing, vol. 45, no. 10, pp. 3230–3239, 2007.
[16] T.-M. Tu, P. S. Huang, H. Chung-Ling, and C. Chien-Ping, “A fast intensity-hue-saturation fusion technique with spectral adjustment for IKONOS imagery,” IEEE Geoscience and Remote Sensing Letters, vol. 1, no. 4, pp. 309–312, 2004.
[17] C. Padwick, M. Deskevich, F. Pacifici, and S. Smallwood, “WorldView-2 Pan-sharpening,” presented at the ACRS 2010 Annual Conference, San Diego, CA, April 26-30, 2010.
[18] W. K. Pratt, Digital Image Processing, 2nded. New York, N.Y., U.S.,
[19] GeoEye, Inc., “GeoEye Satellites,” 2012. [Online]. Available: http://www.geoeye.com/CorpSite/products/earth-imagery/geoeye-sate llites.aspx
[20] GISTDA, “THEOS User Handbook,” 2012. [Online]. Available: http://www.gistda.or.th/gistda_n/newsphotos/20081001_theos_launch /THEOS%20handbook_final%20EADS.pdf
[21] V. Shettigara, “A generalized component substitution technique for spatial enhancement of multispectral images using a higher resolution data set,” Photogrammetric Engineering and Remote Sensing, vol. 58, no. 5, pp. 561–567, 1992.