Genetic diversity and population structure
analysis in
Perilla frutescens
from Northern
areas of China based on simple sequence repeats
S.J. Ma, K.J. Sa, T.K. Hong and J.K. Lee
Department of Applied Plant Sciences, College of Agriculture and Life Sciences, Kangwon National University, Chuncheon, Korea
Corresponding author: J.K. Lee E-mail: jukyonglee@kangwon.ac.kr
Genet. Mol. Res. 16 (3): gmr16039746 Received June 8, 2017
Accepted August 11, 2017 Published September 21, 2017
DOI http://dx.doi.org/10.4238/gmr16039746
Copyright © 2017 The Authors. This is an open-access article distributed under the terms of the Creative Commons Attribution ShareAlike (CC BY-SA) 4.0 License.
ABSTRACT. In this study, 21 simple sequence repeat (SSR) markers were used to evaluate the genetic diversity and population structure
among 77 Perilla accessions from high-latitude and middle-latitude
areas of China. Ninety-five alleles were identified with an average of
4.52 alleles per locus. The average polymorphic information content (PIC) and genetic diversity values were 0.346 and 0.372, respectively. The level of genetic diversity and PIC value for cultivated accessions of
Perilla frutescens var. frutescens from middle-latitude areas were higher than accessions from high-latitude areas. Based on the dendrogram of unweighted pair group method with arithmetic mean (UPGMA),
all accessions were classified into four major groups with a genetic
similarity of 46%. All accessions of the cultivated var. frutescens were
discriminated from the cultivated P. frutescens var. crispa. Furthermore,
most accessions of the cultivated var. frutescens collected in
high-latitude and middle-high-latitude areas were distinguished depending on their geographical location. However, the geographical locations of
their positions in the UPGMA dendrogram and population structure. This result implies that the diffusion of accessions of the cultivated
Perilla crop in the northern areas of China might be through multiple
routes. On the population structure analysis, 77 Perilla accessions
were divided into Group I, Group II, and an admixed group based on
a membership probability threshold of 0.8. Finally, the findings in this
study can provide useful theoretical knowledge for further study on
the population structure and genetic diversity of Perilla and benefit for
Perilla crop breeding and germplasm conservation.
Key words:Perilla frutescens; Genetic similarity; SSR marker; UPGMA; Geographical location; Polymorphic information content
INTRODUCTION
Perilla frutescens (L.) Britt. is a self-fertilizing crop in the family of mint, Lamiaceae. Depending on their morphological characteristics and availability, this species is divided
into two cultivated types. One is P. frutescens var. frutescens that is a kind of oil crop. It is
called by different names in East Asia countries, such as Ren in China, Dlggae in Korea, and
Egoma in Japan. The other is P. frutescens var. crispa, a Chinese medicine or vegetable crop
that is called Zisu in Chinese, Cha-jo-ki in Korean, and Shiso in Japanese (Lee and Ohnishi,
2003). P. frutescens var. frutescens is also used as a vegetable only in Korea, and its seeds are
traditionally used in the same way that sesame seeds are used as a seasoning in China, Korea,
and Japan from old times. On the other hand, P. frutescens var. crispa is used as Chinese
medicine in East Asia from old times and is used as a spicy vegetable or pickle crop in Japan.
Thus, these two cultivated types of Perilla crop have been important in East Asia from ancient
times (Lee and Ohnishi, 2003; Nitta et al., 2003).
Since Perilla crop has been extensively cultivated and used in East Asia from old
times, the original birth place of Perilla crop has generally been considered as East Asia
(Makino et al., 1961; Li, 1969; Nitta, 2001) although the wild ancestor of cultivated types of Perilla crop has not yet been identified in East Asia. In East Asia, the cultivated var. frutescens is currently the most grown and is used as both an oil crop and a leafy vegetable
in Korea. However, the cultivated var. crispa is not currently being cultivated because of
the decreased use of Chinese medicine, although it is occasionally found as a relict form
in Korea (Lee and Ohnishi, 2001; Lee et al., 2002). Conversely, the cultivated var. crispa
is extensively cultivated and used in Japan, while the cultivated var. frutescens is rarely
cultivated in Japan. On the other hand, the cultivated var. frutescens is grown in the northern
area of China. Likewise, the cultivated var. crispa is not currently being cultivated in China.
Because there have been very few efforts to improve Perilla crop through breeding programs,
many genotypes of Perilla crop still occur as landraces in farmers’ fields in East Asia (Lee
et al., 2002). A landrace may be defined as active population(s) of a cultivated crop that has
Previously, various molecular markers have provided useful information regarding genetic diversity and genetic relationships in many crops (Senior et al., 1998; Nitta and Ohnishi, 1999; Prasad et al., 2000; Lee et al., 2002; Hamza et al., 2004; Xia et al., 2005; Lee and Kim, 2007; Sa et al., 2013, 2015; Park et al., 2002, 2015). Among them, random
amplified polymorphic DNA or RAPD (Nitta and Ohnishi, 1999), amplified fragment length
polymorphism or AFLP (Lee et al., 2002; Lee and Ohnishi, 2003), and simple sequence repeats or SSR (Lee and Kim, 2007; Park et al., 2008; Sa et al., 2013, 2015) markers have been applied in the analysis of genetic diversity and relationships among cultivated and weedy
types of Perilla crop in East Asia and other countries. Particularly, SSR markers are highly
reproducible, polymorphic, generally codominant, and abundant in plant genomes (Powell et al., 1996; Park et al., 2009). As a result of these better features, SSRs have been used to establish genetic diversity and genetic relationships in many crop species (da Cunha et al., 2014; Liu et al., 2014; Yook et al., 2014).
Identification of genetic variation is an essential ability for the long-term success of
breeding programs and maximizes the use of germplasm resources (Rao, 2004). China has a
long history of the cultivation of Perilla crop in East Asia, but there has been little research
on the genetic diversity of accessions of Perilla crop. Therefore, the objective of this study
was to establish the genetic diversity of Perilla crop from the northern areas of China based
on SSR markers. The findings in this study can play an important role in the protection and
conservation of accessions of Perilla species in China.
MATERIAL AND METHODS
Plant materials and DNA extraction
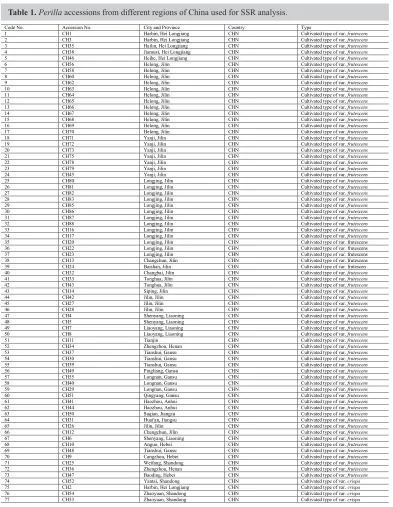
Seventy-seven accessions of P. frutescens were collected in different provinces of
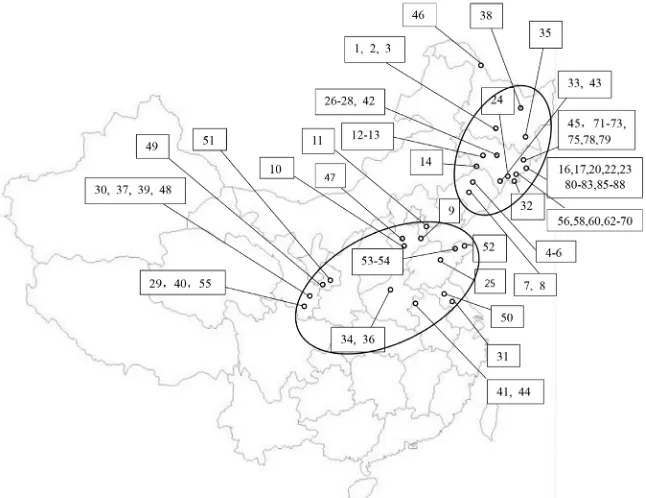
China in the year 2015. The accession numbers and localities of Perilla crop are shown in
Table 1 and Figure 1. Seventy-seven accessions included 54 accessions of the cultivated type of
the var. frutescens from high-latitude areas (northeastern regions of China) and 23 accessions
of the cultivated type of the var. frutescens from middle-latitude areas (Northwest and North
China). Only 3 accessions of the cultivated type of the var. crispa were collected in this study.
The subset of each collection was deposited in the National Agrobiodiversity Center, Rural Development and Administration, Jeonju, Republic of Korea, for permanent seed preservation.
These Perilla seeds collected were germinated on Petri dishes. The germinated seeds were
sown in a nursery in May of 2016. After seedlings have come out, they were transplanted into the farm of Kangwon National University. Total DNA was extracted from the leaf tissues of a representative individual plant for each accession following the Plant DNAzol Reagent protocol (GibcoBRL Inc., Grand Island, NY, USA).
SSR analysis and silver staining
Table 1.Perilla accessions from different regions of China used for SSR analysis.
Code No. Accession No. City and Province Country Type
1 CH1 Harbin, Hei Longjiang CHN Cultivated type of var. frutescens
2 CH3 Harbin, Hei Longjiang CHN Cultivated type of var. frutescens
3 CH35 Hailin, Hei Longjiang CHN Cultivated type of var. frutescens
4 CH38 Jiamusi, Hei Longjiang CHN Cultivated type of var. frutescens
5 CH46 Heihe, Hei Longjiang CHN Cultivated type of var. frutescens
6 CH56 Helong, Jilin CHN Cultivated type of var. frutescens
7 CH58 Helong, Jilin CHN Cultivated type of var. frutescens
8 CH60 Helong, Jilin CHN Cultivated type of var. frutescens
9 CH62 Helong, Jilin CHN Cultivated type of var. frutescens
10 CH63 Helong, Jilin CHN Cultivated type of var. frutescens
11 CH64 Helong, Jilin CHN Cultivated type of var. frutescens
12 CH65 Helong, Jilin CHN Cultivated type of var. frutescens
13 CH66 Helong, Jilin CHN Cultivated type of var. frutescens
14 CH67 Helong, Jilin CHN Cultivated type of var. frutescens
15 CH68 Helong, Jilin CHN Cultivated type of var. frutescens
16 CH69 Helong, Jilin CHN Cultivated type of var. frutescens
17 CH70 Helong, Jilin CHN Cultivated type of var. frutescens
18 CH71 Yanji, Jilin CHN Cultivated type of var. frutescens
19 CH72 Yanji, Jilin CHN Cultivated type of var. frutescens
20 CH73 Yanji, Jilin CHN Cultivated type of var. frutescens
21 CH75 Yanji, Jilin CHN Cultivated type of var. frutescens
22 CH78 Yanji, Jilin CHN Cultivated type of var. frutescens
23 CH79 Yanji, Jilin CHN Cultivated type of var. frutescens
24 CH45 Yanji, Jilin CHN Cultivated type of var. frutescens
25 CH80 Longjing, Jilin CHN Cultivated type of var. frutescens
26 CH81 Longjing, Jilin CHN Cultivated type of var. frutescens
27 CH82 Longjing, Jilin CHN Cultivated type of var. frutescens
28 CH83 Longjing, Jilin CHN Cultivated type of var. frutescens
29 CH85 Longjing, Jilin CHN Cultivated type of var. frutescens
30 CH86 Longjing, Jilin CHN Cultivated type of var. frutescens
31 CH87 Longjing, Jilin CHN Cultivated type of var. frutescens
32 CH88 Longjing, Jilin CHN Cultivated type of var. frutescens
33 CH16 Longjing, Jilin CHN Cultivated type of var. frutescens
34 CH17 Longjing, Jilin CHN Cultivated type of var. frutescens
35 CH20 Longjing, Jilin CHN Cultivated type of var. frutescens
36 CH22 Longjing, Jilin CHN Cultivated type of var. frutescens
37 CH23 Longjing, Jilin CHN Cultivated type of var. frutescens
38 CH13 Changchun, Jilin CHN Cultivated type of var. frutescens
39 CH24 Baishan, Jilin CHN Cultivated type of var. frutescen
40 CH32 Changbai, Jilin CHN Cultivated type of var. frutescens
41 CH33 Tonghua, Jilin CHN Cultivated type of var. frutescens
42 CH43 Tonghua, Jilin CHN Cultivated type of var. frutescens
43 CH14 Siping, Jilin CHN Cultivated type of var. frutescens
44 CH42 Jilin, Jilin CHN Cultivated type of var. frutescens
45 CH27 Jilin, Jilin CHN Cultivated type of var. frutescens
46 CH28 Jilin, Jilin CHN Cultivated type of var. frutescens
47 CH4 Shenyang, Liaoning CHN Cultivated type of var. frutescens
48 CH5 Shenyang, Liaoning CHN Cultivated type of var. frutescens
49 CH7 Liaoyang, Liaoning CHN Cultivated type of var. frutescens
50 CH8 Liaoyang, Liaoning CHN Cultivated type of var. frutescens
51 CH11 Tianjin CHN Cultivated type of var. frutescens
52 CH34 Zhengzhou, Henan CHN Cultivated type of var. frutescens
53 CH37 Tianshui, Gansu CHN Cultivated type of var. frutescens
54 CH30 Tianshui, Gansu CHN Cultivated type of var. frutescens
55 CH39 Tianshui, Gansu CHN Cultivated type of var. frutescens
56 CH49 Pingliang, Gansu CHN Cultivated type of var. frutescens
57 CH55 Longnan, Gansu CHN Cultivated type of var. frutescens
58 CH40 Longnan, Gansu CHN Cultivated type of var. frutescens
59 CH29 Longnan, Gansu CHN Cultivated type of var. frutescens
60 CH51 Qingyang, Gansu CHN Cultivated type of var. frutescens
61 CH41 Haozhou, Anhui CHN Cultivated type of var. frutescens
62 CH44 Haozhou, Anhui CHN Cultivated type of var. frutescens
63 CH50 Suqian, Jiangsu CHN Cultivated type of var. frutescens
64 CH31 Huai'an, Jiangsu CHN Cultivated type of var. frutescens
65 CH26 Jilin, Jilin CHN Cultivated type of var. frutescens
66 CH12 Changchun, Jilin CHN Cultivated type of var. frutescens
67 CH6 Shenyang, Liaoning CHN Cultivated type of var. frutescens
68 CH10 Anguo, Hebei CHN Cultivated type of var. frutescens
69 CH48 Tianshui, Gansu CHN Cultivated type of var. frutescens
70 CH9 Cangzhou, Hebei CHN Cultivated type of var. frutescens
71 CH25 Weifang, Shandong CHN Cultivated type of var. frutescens
72 CH36 Zhengzhou, Henan CHN Cultivated type of var. frutescens
73 CH47 Baoding, Hebei CHN Cultivated type of var. frutescens
74 CH52 Yantai, Shandong CHN Cultivated type of var. crispa
75 CH2 Harbin, Hei Longjiang CHN Cultivated type of var. crispa
76 CH54 Zhaoyuan, Shandong CHN Cultivated type of var. crispa
77 CH53 Zhaoyuan, Shandong CHN Cultivated type of var. crispa
with 10 μL electrophoresis loading buffer (98% formamide, 0.02% BPH, 0.02% Xylene C, and 5 mM NaOH). After denaturing and quick cooling, 2 μL of each sample was loaded
then electrophoresed at 1800 V and 60 W for 130 min. The separated fragments were then visualized using a silver staining kit (Promega, Madison, WI, USA).
Figure 1. Collecting sites of accessions of cultivated types of Perilla crop were evaluated in this study. Perilla accessions collected from high-latitude area and middle-latitude area were respectively shown in the upper and lower oval circles.
Data analysis
Fragments amplified using the SSR primers were scored as presence (1) or absence
(0). Power Marker version 3.25 (Liu and Muse, 2005) was applied to obtain the information on the number of alleles, allele frequency, major allele frequency (MAF), gene diversity (GD), and polymorphic information content (PIC). Genetic similarities were calculated for each pair of lines using the Dice similarity index (Dice, 1945). To illustrate the genetic relationship of samples, the similarity matrix was then used to construct an unweighted pair group method with arithmetic mean (UPGMA) dendrogram by the application of SAHN-Clustering from NTSYS-pc.V.2.1 (Rohlf, 1998). The STRUCTURE 2.2 software (Pritchard and Wen, 2003)
was used for the investigation of a population structure of 77 accessions of Perilla crop.
To identify the number of clusters (K), the software was run using admixture model with correlated allele frequencies following Hardy-Weinberg equilibrium. Five independent runs were performed for each simulated value of K = 1 to 10, with a burn-in period of 100,000 runs followed by 100,000 Monte Carlo Markov Chain (MCMC) replications. The real number of
RESULTS
SSR polymorphism and genetic variation among
Perilla
accessions from different
regions of China
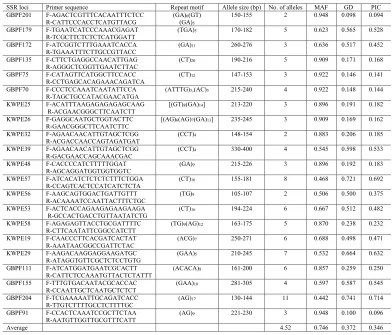
The genetic variability at each SSR locus was measured regarding the number of alleles, MAF, GD, and PIC (Table 2). A total of 21 SSR loci showed polymorphism, producing
a total of 95 alleles among the 77 accessions of Perilla crop. The number of alleles per locus
varied widely from 2 at GBPF201, KWPE32, and KWPE56 to 11 at GBPF204, with an average of 4.52 alleles. The MAF per locus varied from 0.442 (GBPF204) to 0.948 (GBPF201, GBPF91), with an average of 0.746. The GD of each locus ranged from 0.098 at GBPF201 to 0.741 at GBPF204, with an average of 0.372 (Table 2). The PIC values ranged from 0.094 at GBPF201 to 0.714 at GBPF204, with an average of 0.346 (Table 2).
Table 2. Characteristics of the 21 SSR loci including primer sequence, repeat motif, allele size range, allele numbers, major allele frequency, gene diversity, and PIC among 77 accessions of Perilla crop from different regions of China.
MAF: major allele frequency; GD: genetic diversity; PIC: polymorphic information content.
SSR loci Primer sequence Repeat motif Allele size (bp) No. of alleles MAF GD PIC GBPF201 F-AGACTCGTTTCACAATTTCTCC
R-CATTCCCACCTCATGTTACG (GA)(GA)6(GT) 5
150-155 2 0.948 0.098 0.094
GBPF179 F-TGAATCATCCCAAACGAGAT
R-TCGCTTCTCTCTCATGGATT (TGA)5 170-182 5 0.623 0.565 0.528 GBPF172 F-ATCGGTCTTTGAAATCACCA
R-TGAAATTTCTTGCCGTTACC (GA)11 260-276 3 0.636 0.517 0.452 GBPF135 F-CTTCTGAGGCCAACATTGAG
R-AGGGCTCGGTTGAATCTTAC (CT)20 190-216 5 0.909 0.171 0.168 GBPF75 F-CATAGTTCATGGCTTCCACC
R-CCTGAGCACAGAAACAGATCA (CT)12 147-153 3 0.922 0.146 0.141 GBPF70 F-CCCTCCAAATCAATATTCCA
R-TAGCTGCCATACGAACATGA (ATTTG)3,(AC)5 215-240 4 0.922 0.148 0.144 KWPE25 F-ACATTTAAGAGAGAGAGCAAG
R-ACGAACGGGCTTCAATCTT [(GT)8(GA)14] 213-220 3 0.896 0.191 0.182 KWPE26 F-GAGGCAATGCTGGTACTTC
R-GAACGGGCTTCAATCTTC [(AG)6(AG)7(GA)13] 235-245 3 0.909 0.169 0.162 KWPE32 F-AGAACAACATTGTAGCTCGG
R-ACGACCAACCAGTAGATGAT (CCT)4 148-154 2 0.883 0.206 0.185 KWPE39 F-AGAACAACATTGTAGCTCGG
R-GACGAACCAGCAAACGAC (CCT)4 330-400 4 0.545 0.598 0.533 KWPE48 F-CACCCCATCTTTTTGGAT
R-AGCAGGATGGTGGTGGTC (GA)9 215-226 3 0.896 0.192 0.183 KWPE57 F-ATCACATCTCTCTCTTTCTGGA
R-CCAGTCACTCCATCATCTCTA (CT)16 155-181 8 0.468 0.721 0.692 KWPE56 F-AAGCAGTGGACTGATTGTTT
R-ACAAAATCCAATTACTTTCTGC (TG)9 105-107 2 0.506 0.500 0.375 KWPE53 F-ACTCACCAGAAGAGAAGAAGA
R-GCCACTGACCTGTTAATATCTG (CT)16 194-224 6 0.667 0.512 0.482 KWPE58 F-AGAGAGTTACCTGCGATTTTC
R-CTTCAATATTCGGCCATCTT (TG)9(AG)12 163-175 5 0.870 0.238 0.232 KWPE19 F-CAACCCTTCACGATCACTAT
R-AAATAACGGCCGATTCTAC (ACG)7 250-271 6 0.688 0.498 0.471 KWPE29 F-AAGACAAGGAGGAAGATGC
R-ATAGGTGTTCGCTCTCCTGTG (GAA)5 210-245 7 0.532 0.664 0.632 GBPF111 F-ATCATGGATGAATCGCACTT
R-CATTCTCCAAATGTTACTCTATTT (ACACA)8 161-200 6 0.857 0.259 0.250 GBPF155 F-TTTGTGACAATACGCACCAC
R-CCAATTGCTCAATGCTCTCT (GAA)10 281-305 4 0.597 0.587 0.545 GBPF204 F-TCGAAAAATTGCAGATCACC
R-TTGTCTTTTGCCTCTTTTGC (AG)17 130-144 11 0.442 0.741 0.714 GBPF91 F-CCACTCAAATCCGCTTCTAA
R-AATGTTGGTTGCGTTTCATT (AG)9 221-230 3 0.948 0.100 0.096
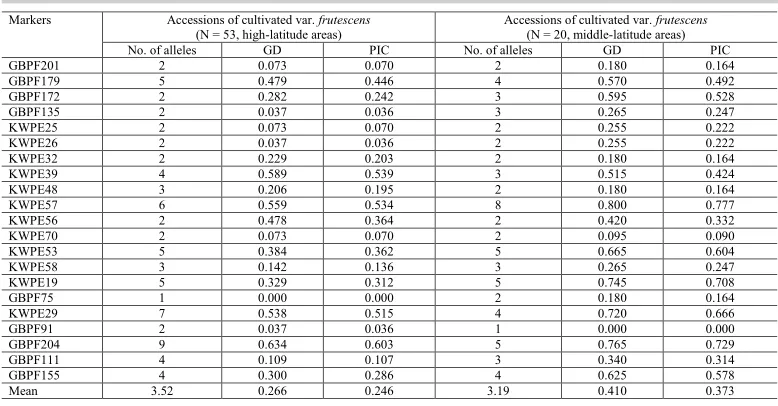
To compare the genetic diversity of the cultivated var. frutescens between high-latitude (53 accessions) and middle-high-latitude (20 accessions) regions in northern China, we also measured the number of alleles, MAF, GD, and PIC among the 73 accessions of the
cultivated var. frutescens (Table 3). The average number of alleles was 3.52 and 3.19 alleles
for accessions of the cultivated var. frutescens from high-latitude and middle-latitude areas
in northern China, respectively. The average GD was 0.266 and 0.410 for accessions of the
cultivated var. frutescens from high-latitude and middle-latitude areas in northern China,
respectively. Finally, the average PIC values were 0.246 and 0.373 for accessions of the
cultivated var. frutescens from high-latitude and middle-latitude areas in northern China,
respectively (Table 3). These results show that accessions of the cultivated var. frutescens
from middle-latitude area exhibited higher GD and PIC values than those of the cultivated var.
frutescens from high-latitude areas.
Table 3. Number of alleles, genetic diversity, and polymorphic information content obtained from each SSR locus in accessions of the cultivated var. frutescens collected from high-latitude and middle-latitude areas of China.
GD: genetic diversity; PIC: polymorphic information content. Markers Accessions of cultivated var. frutescens
(N = 53, high-latitude areas) Accessions of cultivated var. (N = 20, middle-latitude areas) frutescens No. of alleles GD PIC No. of alleles GD PIC
GBPF201 2 0.073 0.070 2 0.180 0.164
GBPF179 5 0.479 0.446 4 0.570 0.492
GBPF172 2 0.282 0.242 3 0.595 0.528
GBPF135 2 0.037 0.036 3 0.265 0.247
KWPE25 2 0.073 0.070 2 0.255 0.222
KWPE26 2 0.037 0.036 2 0.255 0.222
KWPE32 2 0.229 0.203 2 0.180 0.164
KWPE39 4 0.589 0.539 3 0.515 0.424
KWPE48 3 0.206 0.195 2 0.180 0.164
KWPE57 6 0.559 0.534 8 0.800 0.777
KWPE56 2 0.478 0.364 2 0.420 0.332
KWPE70 2 0.073 0.070 2 0.095 0.090
KWPE53 5 0.384 0.362 5 0.665 0.604
KWPE58 3 0.142 0.136 3 0.265 0.247
KWPE19 5 0.329 0.312 5 0.745 0.708
GBPF75 1 0.000 0.000 2 0.180 0.164
KWPE29 7 0.538 0.515 4 0.720 0.666
GBPF91 2 0.037 0.036 1 0.000 0.000
GBPF204 9 0.634 0.603 5 0.765 0.729
GBPF111 4 0.109 0.107 3 0.340 0.314
GBPF155 4 0.300 0.286 4 0.625 0.578
Mean 3.52 0.266 0.246 3.19 0.410 0.373
Genetic relationships among accessions of
Perilla
crop from different regions of China
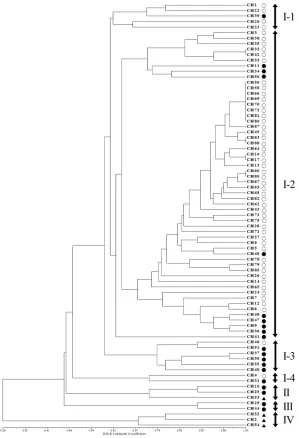
The phylogenetic tree was constructed using UPGMA and revealed that 77 Perilla
accessions were clustered into four major groups with a genetic similarity of 46% (Figure
2). Group I contained 69 accessions of the cultivated var. frutescens. Group II contained
2 accessions of the cultivated var. frutescens and 1 accession of the cultivated var. crispa
(CH53). Group III contained only 2 accessions of the cultivated var. frutescens. Group IV
contained only 3 accessions of the cultivated var. crispa. Besides, accessions in Group I were
further subdivided into four sub-clusters with a genetic similarity of 60%. The first sub-cluster
contained 4 accessions of the cultivated var. frutescens from high-latitude areas and 1 accession
56 accessions of the cultivated var. frutescens from high-latitude (47 accessions) and middle-latitude (9 accessions) areas. The third sub-cluster contained 5 accessions of the cultivated
var. frutescens from middle-latitude areas and 1 accession of the cultivated var. frutescens
from high-latitude areas. The fourth sub-cluster contained 2 accessions of the cultivated var.
frutescens from high-latitude and middle-latitude areas, respectively.
Figure 2. UPGMA dendrogram based on the SSR markers. The accessions of Perilla crop from high-latitude and middle-latitude areas of China are shown in Table 1. Open circle: cultivated var. frutescens from high-latitude area,
In our analysis, all accessions of the cultivated var. frutescens were discriminated
from the cultivated var. crispa, except for one accession (CH53), which belonged to the group
of the cultivated var. frutescens. Furthermore, in the case of the cultivated var. frutescens, most
accessions of the cultivated var. frutescens collected in high-latitude and middle-latitude areas
were distinguished depending on their geographical location, except for several accessions.
Population structure
To understand the genetic structure among the 77 Perilla accessions from
high-latitude and middle-high-latitude areas in northern China, we used a model-based approach in the STRUCTURE software to subdivide each accession into their corresponding subgroups. We
ran STRUCTURE for fixed K values ranging from one to ten and performed five runs for each
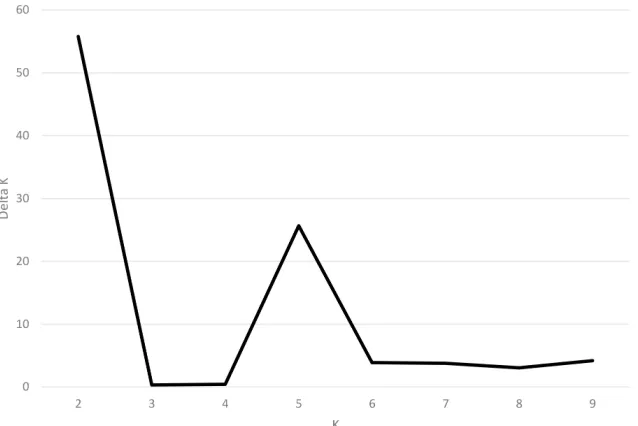
K. This study applied the ad hoc measure ΔK using the method developed by Evanno et al.
(2005) to overcome the difficulty in interpreting the real K values. The highest value of ΔK for
the 77 Perilla accessions was for K = 2 (Figure 3).
Figure 3. Magnitude of ∆K as a function of K. The peak value of ∆K was at K = 2, suggesting two genetic clusters in the Perilla accessions from high-latitude and middle-latitude areas of China.
Clustering bar plots with K = 2 are shown in Figure 4. At K = 2, all 77 Perilla accessions
were divided into two groups. However, some Perilla accessions were admixed within these
two groups. There was no clear geographic structure among the 77 Perilla accessions from
high-latitude and middle-latitude regions in northern China, which was confirmed by UPGMA
CH69, CH70, CH72, CH75, CH45, CH80, CH81, CH82, CH83, CH86, CH87, CH88, CH13,
CH16, CH17, CH43) of the cultivated var. frutescens from high-latitude areas of China.
Group II included 16 accessions (CH30, CH34, CH37, CH39, CH46, CH55, CH40, CH29,
CH51, CH44, CH31, CH6, CH9, CH10, CH24, CH25) of the cultivated var. frutescens and
4 accessions (CH2, CH52, CH53, CH54) of the cultivated var. crispa. The admixed group
comprised 25 accessions (CH1, CH3, CH35, CH38, CH65, CH71, CH73, CH78, CH79, CH85, CH20, CH22, CH23, CH32, CH33, CH14, CH42, CH26, CH12, CH27, CH28, CH4,
CH5, CH7, CH8) of the cultivated var. frutescens from high-latitude areas of China and 7
accessions (CH11, CH49, CH41, CH50, CH36, CH47, CH48) of the cultivated var. frutescens
from middle-latitude areas of China.
Figure 4. Population structure of 77 accessions of two cultivated types of Perilla crop based on 21 SSRs for K = 2. Open circle: cultivated var. frutescens from high-latitude area, filled circle: cultivated var. frutescens from middle
-latitude area, filled triangle: cultivated var. crispa.
DISCUSSION
Genetic diversity (or variation) is usually thought of as the amount of genetic variability among individuals of a variety or population of a species (Brown, 1983). It results from the many genetic differences between individuals and may be manifested in differences in DNA polymorphism (e.g., RFLP, RAPD, AFLP, and SSR markers), in biochemical characteristics (e.g., in protein structure or isoenzyme properties), in physiological properties (e.g., abiotic
stress resistance or flowering habits), or in morphological characters such as seed color or plant
height (Rao and Hodgkin, 2002). Morphological characters or physiological properties were
the major methods for germplasm classification or genetic resource evaluation in previous
studies. As a consequence of the effects of environmental conditions or other factors on the
final results, classification or evaluation accuracy was usually reduced. To obtain an accurate
In this study, 21 SSR primer sets were applied for analysis of genetic diversity among
Perilla accessions collected in high-latitude and middle-latitude areas of China. According
to our results, a total of 95 alleles with 21 SSRs were detected segregating in the 77 Perilla
accessions from different areas of China, which yielded an average of 4.52 alleles per locus. This value appears to be low when compared to the effective number of alleles per SSR locus in the results of previous studies by Lee and Kim (2007) and Sa et al. (2013). They detected
a total of 101 alleles with 11 SSRs among 70 Perilla accessions from East Asia, with an
average allele number of 9.2 per locus (Lee and Kim, 2007), and a total of 165 alleles using
18 SSR markers in 56 Perilla accessions from Korea and Japan with an average of 9.2 alleles
yielded at each locus (Sa et al., 2013). Furthermore, the average value of genetic diversity in this study is much lower than the values of previous studies by Lee and Kim (2007) and Sa et al. (2013). The reason for the low values of genetic diversity and allele numbers per locus
obtained in the current study might be attributed to different materials of Perilla accessions
when compared with the previous studies by Lee and Kim (2007) and Sa et al. (2013). For
example, most materials used in this study are accessions of the cultivated var. frutescens, and
only 4 accessions of the cultivated var. crispa were collected from high-latitude and
middle-latitude areas of China. Unfortunately, at the beginning of this study, we did not collect weedy
accessions of two cultivated types of Perilla crop in these areas. While in the previous studies,
they used many accessions of cultivated and weedy types of Perilla crop in East Asia (Lee
and Kim, 2007; Sa et al., 2013). They reported that the accessions of two weedy types of
Perilla crop had higher genetic diversity than accessions of two cultivated types of Perilla
crop (Lee and Ohnishi, 2003; Lee and Kim, 2007; Sa et al., 2013). This result indicated that in domestication through direct and indirect human selections during the evolutionary stage from wild type to cultivated type, some alleles were lost, and the level of polymorphism and genetic diversity were reduced.
On the other hand, in case of the northern areas of China, accessions of the cultivated
var. frutescens from middle-latitude areas, which had a smaller population size of materials
compared to those collected from high-latitude areas, showed much higher genetic diversity
and PIC values than those of the cultivated var. frutescens from high-latitude areas (Table 3).
This result indicated that the cultivated var. frutescens from middle-latitude areas might have
higher genetic diversity than that of the high-latitude areas. PIC was used to measure genetic
diversity (Vaiman et al., 1994). PIC value was applied in the measurement of the efficiency of
polymorphic loci. If PIC > 0.5, 0.5 > PIC > 0.25, and PIC < 0.25, locus polymorphisms can be assessed as high, medium, and low, respectively (Xie et al., 2010). In this study, the average value of PIC was 0.346, indicating that 21 SSR loci used in this study showed average level
polymorphism for the accessions of Perilla crop from the northern areas of China. Meanwhile,
the PIC values of 6 SSR loci, such as GBPF179, GBPF155, GBPF204, KWPE39, KWPE57,
and KWPE29, showed more than 0.5 (Table 3). The five markers, GBPF155, GBPF204,
KWPE39, KWPE57, and KWPE29, also showed the high values of PIC for the accessions of
Perilla from East Asia and other countries (Sa et al., 2013, 2015; Woo et al., 2016). Therefore, these SSR markers were considered useful and highly informative for the analysis of genetic
diversity in Perilla accessions from the northern areas of China and might be effectively
applied in differentiating the polymorphic rate of a marker at a specific locus.
As shown in Figure 2, 77 accessions of Perilla crop were divided into 4 main groups
by the analysis of the UPGMA dendrogram. Most accessions of the cultivated var. crispa,
var. frutescens. The result was consistent with the previous study by Sa et al. (2013). They
reported that SSR markers are useful for distinguishing between two cultivated types of Perilla
crop. However, one accession (CH53) of the cultivated var. crispa was situated in the group
of the cultivated var. frutescens. Similar results have also been reported in the previous studies
by Lee and Ohnishi (2003) and Sa et al. (2013). Namely, several accessions of var. frutescens
and var. crispa were ambiguously classified on the basis of AFLP and SSR markers (Lee and
Ohnishi, 2003; Sa et al., 2013). These results might be thought as a natural crossing that occurs
between the two cultivated types of Perilla crop, as previously reported by Nitta and Ohnishi
(1999) and Lee and Ohnishi (2001). By the result of the UPGMA dendrogram, most accessions
of the cultivated var. frutescens collected from the middle-latitude area of China were classified
from accessions of the cultivated var. frutescens from the high-latitude area of China. Based
on the analysis of the population structure, Group I only consisted of accessions of the var.
frutescens from high-latitude areas. Group II contained most Perilla accessions from middle-latitude areas except CH6, CH24, and CH46. However, the geographical locations of several
accessions of the cultivated var. frutescens were not consistent with their positions in the
UPGMA dendrogram and population structure. Similar results were also obtained with RAPD (Nitta and Ohnishi, 1999) and AFLP (Lee and Ohnishi, 2003) analysis. This result implies that
the diffusion of accessions of the cultivated Perilla crop in the northern areas of China might
be through multiple routes. Besides, an admixture of accessions of the cultivated Perilla crop
from different areas of China was observed in Figure 4. The occurrence of this phenomenon
may be attributed to the following factors. Firstly, overlapping distribution of Perilla accessions
grown in the vicinity of the boundary between high-latitude and middle-latitude areas caused an occurrence of gene introgression among accessions in different regions. Second, the topography
of areas where these accessions were collected was major in the plain. Gene flow happened
through pollens, seeds, and other natural approaches easily in the plain areas, degrading the
variation and leading to an unclear structure among cultivated Perilla accessions from different
regions. Human activities may be the main reason for the ambiguous classification of these accessions. Gene flow can be influenced significantly by human activities (Meng et al., 2015).
Seeds of accessions from high-latitude areas may be transferred to northwestern areas of China or other middle latitude areas via human business activities. Probably, the occurrence of this migration or introduction within same regions or between different regions caused these accessions to be categorized ambiguously under the analysis of UPGMA.
The investigations on genetic diversity, population structure, and collection and
conservation of germplasm resources have benefited from the utility of SSR markers. The
valuable information on the genetic structures and relationships of Perilla accessions from
northern areas of China have been provided by using the 21 SSR markers in this study. Through the comprehensive analysis of genetic diversity, genetic relationship, and population structure
among these Chinese Perilla resources, the basic genetic knowledge of Chinese Perilla
has been obtained and can be used as a reference for genetic diversity studies, germplasm, conservation, and breeding strategies in the future.
ACKNOWLEDGMENTS
REFERENCES
Brown WL (1983). Genetic diversity and genetic vulnerability - an appraisal. Econ. Bot. 37: 4-12. https://doi.org/10.1007/ BF02859301
da Cunha CP, Resende FV, Zucchi MI and Pinheiro JB (2014). SSR-based genetic diversity and structure of garlic accessions from Brazil. Genetica 142: 419-431. https://doi.org/10.1007/s10709-014-9786-1
Dice LR (1945). Measures of the amount of ecologic association between species. Ecology 26: 297-302. https://doi. org/10.2307/1932409
Evanno G, Regnaut S and Goudet J (2005). Detecting the number of clusters of individuals using the software STRUCTURE: a simulation study. Mol. Ecol. 14: 2611-2620. https://doi.org/10.1111/j.1365-294X.2005.02553.x Hamza S, Hamida WB, Rebai A and Harrabi M (2004). SSR-based genetic diversity assessment among Tunisian
winter barley and relationship with morphological traits. Euphytica 135: 107-118. https://doi.org/10.1023/ B:EUPH.0000009547.65808.bf
Harlan JR (1975). Our vanishing genetic resources. Science 188: 617-621. https://doi.org/10.1126/science.188.4188.617 Lee JK and Ohnishi O (2001). Geographical differentiation of morphological characters among Perilla crops and their
weedy types in East Asia. Breed. Sci. 51: 247-255. https://doi.org/10.1270/jsbbs.51.247
Lee JK and Ohnishi O (2003). Genetic relationships among cultivated types of Perilla frutescens and their weedy types in East Asia revealed by AFLP markers. Genet. Resour. Crop Evol. 50: 65-74. https://doi.org/10.1023/A:1022951002271 Lee JK and Kim NS (2007). Genetic Diversity and Relationships of Cultivated and Weedy types of Perilla frutescens
Collected from East Asia revealed by SSR Markers. Yugjong Haghoeji 39: 491-499.
Lee JK, Nitta M, Kim NS, Park CH, et al. (2002). Genetic diversity of Perilla and related weedy types in Korea determined by AFLP analyses. Crop Sci. 42: 2161-2166. https://doi.org/10.2135/cropsci2002.2161
Li HL (1969). The vegetables of ancient China. Econ. Bot. 23: 235-260. https://doi.org/10.1007/BF02860457
Liu C, Fan X, Jiang J, Guo D, et al. (2014). Genetic diversity of Chinese wild grape species by SSR and SRAP markers. Biotechnol. Biotechnol. Equip. 26: 2899-2903. https://doi.org/10.5504/bbeq.2011.0146
Liu K and Muse SV (2005). PowerMarker: an integrated analysis environment for genetic marker analysis. Bioinformatics 21: 2128-2129. https://doi.org/10.1093/bioinformatics/bti282
Makino T, Hara H, Tuyama T and Fumio M (1961). Makino’s New Illustrated Flora of Japan. Hokuryukan, Tokyo. Meng F, Liu L, Peng M, Wang ZK, et al. (2015). Genetic diversity and population structure analysis in wild strawberry
(Fragaria nubicola L.) from Motuo in Tibet Plateau based on simple sequence repeats (SSRs). Biochem. Syst. Ecol. 63: 113-118. https://doi.org/10.1016/j.bse.2015.09.018
Nitta M (2001). Origin Perilla crops and their weedy type. Ph.D. thesis, Kyoto University, Kyoto.
Nitta M and Ohnishi O (1999). Genetic relationships among two Perilla crops, shiso and egoma, and the weedy type revealed by RAPD markers. Jpn. J. Genet. 74: 43-48.
Nitta M, Lee JK and Ohnishi O (2003). Asian Perilla crops and their weedy forms: their cultivation, utilization and genetic relationships. Econ. Bot. 57: 245-253. https://doi.org/10.1663/0013-0001(2003)057[0245:APCATW]2.0.CO;2 Park YJ, Dixit A, Ma KH, Lee JK, et al. (2008). Evaluation of genetic diversity and relationships within an on-farm
collection of Perilla frutescens (L.) Britt. using microsatellite markers. Genet. Resour. Crop Evol. 55: 523-535. https://doi.org/10.1007/s10722-007-9258-x
Park YJ, Lee JK and Kim NS (2009). Simple sequence repeat polymorphisms (SSRPs) for evaluation of molecular diversity
and germplasm classification of minor crops. Molecules 14: 4546-4569. https://doi.org/10.3390/molecules14114546
Park YJ, Ramekar RV, Sa KJ and Lee JK (2015). Genetic diversity, population structure, and association mapping of biomass traits in maize with simple sequence repeat markers. Genes Genomics 37: 725-735. https://doi.org/10.1007/ s13258-015-0309-y
Powell W, Morgante M, Andre C, Hanafey M, et al. (1996). The comparison of RFLP, RAPD, AFLP and SSR (microsatellite) markers for germplasm analysis. Mol. Breed. 2: 225-238. https://doi.org/10.1007/BF00564200
Prasad M, Varshney RK, Roy JK, Balyan HS, et al. (2000). The use of microsatellites for detecting DNA polymorphism,
genotype identification and genetic diversity in wheat. Theor. Appl. Genet. 100: 584-592.
Pritchard JK and Wen W (2003). Documentation for STRUCTURE software: Version 2.
Rao NK (2004). Plant genetic resources: Advancing conservation and use through biotechnology. Afr. J. Biotechnol. 3: 136-145.
Rao VR and Hodgkin T (2002). Genetic diversity and conservation and utilization of plant genetic resources. Plant Cell Tissue Organ Cult. 68: 1-19. https://doi.org/10.1023/A:1013359015812
Sa KJ, Choi SH, Ueno M, Park KC, et al. (2013). Identification of genetic variations of cultivated and weedy types of Perilla species in Korea and Japan using morphological and SSR markers. Genes Genomics 35: 649-659. https://doi. org/10.1007/s13258-013-0117-1
Sa KJ, Choi SH, Ueno M and Lee JK (2015). Genetic diversity and population structure in cultivated and weedy types of Perilla in East Asia and other countries as revealed by SSR markers. Hortic. Environ. Biotechnol. 56: 524-534. https://doi.org/10.1007/s13580-015-0039-8
Senior ML, Murphy JP, Goodman MM and Stuber C (1998). Utility of SSRs for determining genetic similarities and relationships in maize using an agarose gel system. Crop Sci. 38: 1088-1098. https://doi.org/10.2135/cropsci1998.0 011183X003800040034x
Vaiman D, Mercier D, Moazami-Goudarzi K, Eggen A, et al. (1994). A set of 99 cattle microsatellites: characterization, synteny mapping, and polymorphism. Mamm. Genome 5: 288-297. https://doi.org/10.1007/BF00389543
Villa TCC, Maxted N, Scholten M and Ford-Lloyd B (2006). Defining and identifying crop landraces. Plant Genet. Resour.
3: 373-384. https://doi.org/10.1079/PGR200591
Wang R, Yu Y, Zhao J, Shi Y, et al. (2008). Population structure and linkage disequilibrium of a mini core set of maize inbred lines in China. Theor. Appl. Genet. 117: 1141-1153. https://doi.org/10.1007/s00122-008-0852-x
Woo SY, Sa KJ and Lee JK (2016). Collection and Evaluation of Genetic Variation of Perilla Accessions in the Jeju Island. Plant Breed. Biotechnol. 4: 87-98. https://doi.org/10.9787/PBB.2016.4.1.087
Xia XC, Reif JC, Melchinger AE, Frisch M, et al. (2005). Genetic diversity among CIMMYT maize inbred lines investigated with SSR markers: II. Subtropical, tropical midaltitude, and highland maize inbred lines and their relationships with elite U.S. and European maize. Crop Sci. 45: 2573-2582. https://doi.org/10.2135/cropsci2005.0246
Xie W, Zhang X, Cai H, Liu W, et al. (2010). Genetic diversity analysis and transferability of cereal EST-SSR markers to orchardgrass (Dactylis glomerata L.). Biochem. Syst. Ecol. 38: 740-749. https://doi.org/10.1016/j.bse.2010.06.009 Yook MJ, Lim SH, Song JS, Kim JW, et al. (2014). Assessment of genetic diversity of Korean Miscanthus using
morphological traits and SSR markers. Biomass Bioenergy 66: 81-92. https://doi.org/10.1016/j.biombioe.2014.01.025
Zeven AC (1998). Landraces: a review of definitions and classifications. Euphytica 104: 127-139. https://doi.