ISSN: 2395-3519
www.ijatca.com 62
International Journal of Advanced Trends in
Computer Applications
www.ijatca.com
Comparative Analysis of Machine Learning and
Clustering Based Algorithm for the classification
of Ear Biometric Template
1
Beant Kaur, 2Bhawana Kansal
1
Assistant Professor (ECE) Punjabi University, Patiala
2
M.tech (Scholar), ECE Punjabi University, Patiala
Abstract:
Ear is a standout amongst the most solid biometric feature because of its steadiness and haphazardness. In this paper, we have developed a system that can recognize human ear patterns and comparative analysis of the results is done. A novel mechanism has been used for implementation of the system. Feature training has been used to extract the most discriminating features of the ear and is done using k –means clustering scheme. And finally the biometric templates are matched using neural network and centroid method which tells us whether the two ear images are same or not and on the basis of that performance metric are evaluated like error rate and Accuracy. The whole simulation is taken place in the MATLAB environment.Keywords:
Biometric, Ear Recognition, Neural Network, k-mean clustering, centroid selection method, FAR, FRR, Accuracy, Error rate.I. INTRODUCTION
Biometrics refers to the identification or authentication of an individual based on certain unique features or characteristics. Biometric identifiers are the distinctive and measurable features that is used to label and describe individuals [1]. There are two categories of biometric identifiers namely physiological and behavioral characteristics [2]. Iris, fingerprint, DNA, etc. belong to the former kind of biometric identifiers whereas typing rhythm, gait, voice, etc. belong to the latter. A biometric system usually functions by first capturing a sample of the feature, such as capturing a digital color image of a face to be used in facial recognition or a recording a digitized sound signal to be used in voice recognition. The sample may then be refined so that the most discriminating features can be extracted and noises in the sample are reduced. The sample is then transformed into a biometric template using some sort of mathematical function [10]. The biometric template is a normalized and efficient representation of the sample which can be used for comparisons. Biometric systems usually have two modes of operations. An enrolment mode is used for adding new templates into the database and the identification mode is used for comparing a template
created for an individual, who wants to be verified, with all the existing templates in the database.
A good biometrics is one which uses a feature that is highly unique. This reduces the chances of any two people having the same characteristics to the minimal. The feature should also be stable so that it does not change over the period of time.
II.
EAR AS BIOMETRIC
ISSN: 2395-3519
www.ijatca.com 63
Figure 1: Ear Sample Image
Unlike iris, retina, or thumbprint capture that are touching base biometrics, whereas ear does not have need of close proximity to achieve capture [26]. Figure shows the common terminology of the external ear. Ears have a noteworthy role in forensic science. Ear detection has collect little consideration match up to other prevalent biometrics for instance face, thumbprint and gait.
Step 1 Step 2
Step 4 Step 3
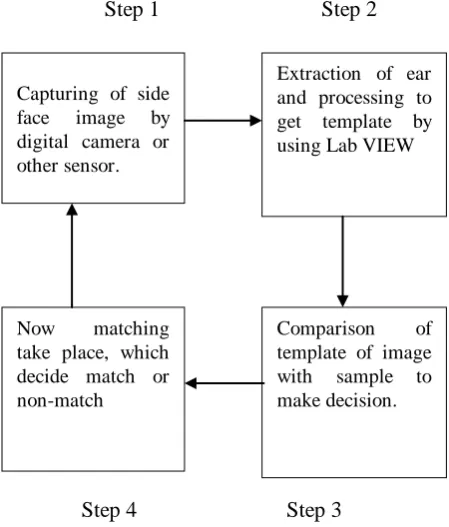
Figure 2: Steps of Ear Recognition
III. PROPOSED ALGORITHMS
3.1 K Means Clustering
K-means clustering algorithm is the basic algorithm which is based on partitioning method which is used for many clustering tasks especially with low dimension datasets. It uses k as a parameter, divide n objects into k clusters so that the objects in the same cluster are similar to each other but dissimilar to other objects in other clusters. The algorithm attempts to find the cluster centers, (C1 …… Ck), such that the sum of the squared distances of each data point, xi , 1 ≤ i ≤ n, to its nearest
cluster center Cj, 1 ≤ j ≤ k, is minimized. First, the algorithm randomly selects the k objects, each of which initially represents a cluster mean or center. Then, each object xi in the data set is assigned to the nearest cluster center i.e. to the most similar center. The algorithm then computes the new mean for each cluster and reassigns each object to the nearest new center. This process iterates until no changes occur to the assignment of objects. The convergence results in minimizing the sum-of-squares error that is defined as the summation of the squared distances from each object to its cluster center.
The following procedure summarizes the k-means algorithms [20]:
Algorithm: k-means:- The k-means algorithm for partitioning, where each cluster‟s center is represented by the mean value of the objects in the cluster.
Input:
k: the number of clusters,
D: a data set containing n objects.
Output:
A set of k clusters.
Method:
(1) randomly choose k objects from D as the initial cluster centers;
(2) repeat
(3) (re)assign each object to the cluster to which the object is the most similar, based on the mean value of the objects in the cluster;
(4) update the cluster means, i.e., calculate the mean value of the objects for each cluster;
(5) until no change;
Despite being used in a wide array of applications, the k-means algorithm is not exempt of drawbacks.
As many clustering methods, the k-means algorithm assumes that the number of clusters k in the database is known beforehand which, obviously, is not necessarily true in real-world applications.
As an iterative technique, the k-means algorithm is especially sensitive to initial centers selection.
The k-means algorithm may converge to local minima.
3.2 Centroid Selection Method
The centroid is defined as the centre of a cloud of points (Joining Clusters: Clustering Algorithms). Centroid linkage techniques attempt to determine the „centre‟ of the cluster. One issue is that the centre will move as clusters are merged. As a result, the distance between merged clusters may actually decrease between steps, making the analysis of results problematic. This is not the issue with single and complete linkage methods. A problem with the centroid method is that some switching and reversal may take place, for example as the
STEP 3
STEP 4
Capturing of side face image by digital camera or other sensor.
Comparison of template of image with sample to make decision. Now matching
take place, which decide match or non-match
ISSN: 2395-3519
www.ijatca.com 64
agglomeration proceeds some cases may need to be switched from their original clusters.
3.3 Neural Network
Neural network models seems to be a current development in today‟s field. Neural networks process data in a similar way as the brain of a human being works. The network is made of a huge number of highly interrelated processing components (neurones) working in corresponding to resolve a definite issue. Neural networks learns by some example. They could not be encoded to accomplish a specific job. The examples must be chosen very carefully or else valuable time is misused or even not as good as the network which might be operating inaccurately. Neural networks, with their significant ability to derive meaning from complex or indefinite information, could be utilized towards extracting patterns as well as to discover trends which are too multifaceted to be perceived by either human beings or other computer methodologies. The neural network has two modes of work operation; the training mode plus the testing mode.
Neural networks are generally systematized in layers. These specific layers are made up of a a set of interrelated 'nodes' that encompass an 'activation function'.
Input Hidden Output layer layer layer
Figure 3: Neural Network
Some specific patterns are presented to the network through the 'input layer' that communicates to one or more than one 'hidden layers' where the real processing is completed by the use of a framework which have weighted 'connections'. Then the hidden layers are further connected to a specific „output layer' where the actual solution is output as displayed in above figure.
IV.SIMULATION MODEL
Ear recognition is done In MATLAB 2010a environment using K- Means Clustering, Centroid selection and NN method. The following process will describe the ear recognition process.
4.1 Training Panel 4.1.1 Upload Image
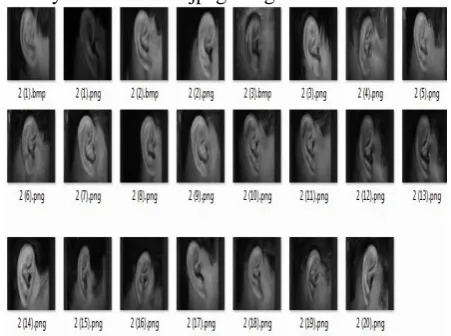
The images from UCI Machine learning algorithms ear image database are taken. It contains 23 images of left ear. They are of 200kb .jpeg images.
Figure Error! No text of specified style in document.: Ear Training Samples
4.1.2 Edge Detection
In this phase grey scale conversion has been done and edge detection. Edges characterize boundaries and are therefore a problem of fundamental importance in image processing. Edges in images are areas with strong intensity contrasts – a jump in intensity from one pixel to the next. Edge detecting an image significantly reduces the amount of data and filters out useless information, while preserving the important structural properties in an image. The Canny edge detection algorithm is known to many as the optimal edge detector.
4.1.3 K- Means clustering and feature values
Clustering is the process of grouping a non-linear set of objects. This approach assigns the database of nobjects into k-number of clusters (k < n). The main concept of this K-Means clustering approach is every object in the database must be located in any of the clusters or group, then every cluster must contain a minimum of one object. Then each cluster can be used to find a mean vector, according to this approach, it comes under the category of the centroid model. K-Means clustering algorithm is used to find the set key points, which are stored as the feature values in database during enrollment process. The key points taken from the feature extraction process are clustered using this algorithm.
ISSN: 2395-3519
www.ijatca.com 65
whether the user is authenticated as a genuine one, or whether user is an impostor.
4.2 Neural Network for training
Back Propagation Neural Network (BPNN) is a systematic method for training multi-layer artificial neural network. The algorithm for Ear recognition using BPNN [ is as follows:
Create NN architecture having input, hidden and output layers. Predefined.
Randomly initialize input layer.
Train the network using ftt function.
4.3 Classification Panel 4.3.1 Upload testing image
The images from UCI Machine learning algorithms ear image database are taken for testing. It contains various images of left ear. They are of 200kb .jpeg images.
4.3.2 Matching using Neural Network
The features of the test image are compared with the features of images in the database for match or non-match using NN classifier on the basis of accuracy and error arte.
4.3.3 Matching using Centroid Method
The features of the test image are compared with the features of images in the database for match or non-match using centroid method on the basis of accuracy and error rate.
V.
RESULTS AND ANALYSIS
The whole implementation has been done in MATLAB 2010a using centroid method and neural network.
5. 1 Calculate FAR ( False Acceptance Rate)
FAR=
5.2 Calculate FRR ( False Rejection Rate)
FRR=
Start
Training Panel
Uploading of ear image
Grey conversion of image
Boundary detection using canny
K –means to get clsuters
Show feature values
Store to db
Classification using 2 methods
Centroid method Neural Network
load allcentroids [r,c]=size(mycent); matched=0; for i=1:r cr=mycent(i); if cr==mycenttest matched=i;
net=newff(training_set',gr oup,30);
net.trainparam.epochs=50 ;
net=train(net,training_set' ,group);
Find accuracy and error rate
ISSN: 2395-3519
www.ijatca.com 66
Figure 5: Methodology
5.3Calculate Accuracy 100− (FAR+FRR) %
5.4Error rate
Error rate =
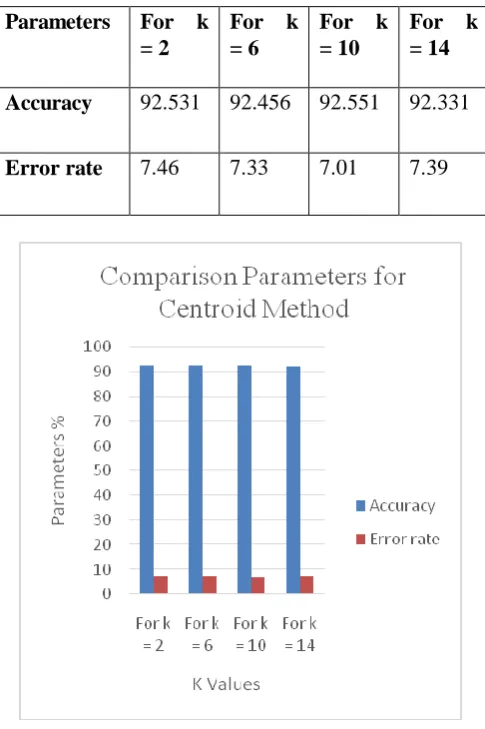
Table I: Comparison Parameters for Centroid Method
Parameters For k = 2
For k = 6
For k = 10
For k = 14
Accuracy 92.531 92.456 92.551 92.331
Error rate 7.46 7.33 7.01 7.39
Figure 6: Comparison Parameters for Centroid Method
Table II. Comparison Parameters for Neural Network
Parameters For k = 2
For k = 6
For k = 10
For k = 14
Accuracy 98.99 98.78 98.89 98.94
Error rate 1.006 5
1.006 3
1.004 9
1.008 7
Figure 7: Comparison Parameters for Neural Network
From above graphs it has been clearly seen that neural network results are better than Centroid method in terms of accuracy and error rate because neural network has good learning rate w.r.t centroid method.
CONCLUSION
In the proposed system a comparative analysis of classification technique is done for classification to increase the accuracy of the authentication systems using centroid method and neural network. In this k- means features are extracted for ear. This proposed method decreased the error rate, & has increases the system performance on the given data set. The results showed that neural network performed well w.r.t centroid method having values accuracy is 98.99%, and Error rate is 1.0063%.
Future works could go in the direction of using more robust modeling techniques against forgeries and hybrid fusion level can be used. Multimodal modalities can be used together to make forgeries more difficult. Also, the system should be tested on a larger database to validate the robustness of the model.
REFERENCES
[1]. Burge, M., Burger, W., “Ear biometrics in computer vision,” In Proceedings of 15th International Conference on Pattern Recognition, 2000: 822-826W.
[2].E.B. Baum and D. Haussler, ``What size net gives valid generalization?,'' Neural Computation, vol. 1, no. 1, pp. 151-160, 1989.
[3].Jeff Heaton, Heaton Research, Inc. (25 November 2005)”, Introduction to neural networks with java,” ISBN-10: 097732060X, ISBN-13:978-0977320608.
ISSN: 2395-3519
www.ijatca.com 67 Conference on Pattern Recognition (ICPR' 00), volume 2,
pages 822-826, 2000.
[5].David J. Hurley, Mark S. Nixon, and John N. Carter. “Force Field feature extraction for ear biometrics”. Computer Vision and Image Understanding, 98(3):491-512, 2005.
[6].Ping Yan and KevinW. Bowyer. “Empirical evaluation of advanced ear biometrics”. In Proceedings of International Conference on Computer Vision and Pattern Recognition-Workshop, volume 3, pages 41-48, 2005.
[7].L. Alvarez, E. Gonzalez, and L. Mazorra. “Fitting ear contour using an ovoid model”. In Proceedings of IEEE International Carnahan Conference on Security Technology (ICCST' 05), pages 145-148, 2005.
[8].Ping Yan and K.W. Bowyer. “Biometric recognition using 3D ear shape”. IEEE Transactions on Pattern Analysis and Machine Intelligence, 29(8):1297-1308, 2007. [9].Saeeduddin Ansari and Phalguni Gupta, “Localization of ear using outer helix curve of the ear”. In Proceedings of the International Conference on Computing: Theory and Applications (ICCTA' 07), pages 688-692, 2007.
[10].Li Yuan and Zhi-Chun Mu. “Ear detection based on skin-color and contour information”. In Proceedings of International Conference on Machine Learning and Cybernetics (ICMLC' 07), volume 4, pages 2213{2217, 2007.
[11].Moreno, B., Sánchez, Á., Vélez. J.F. On the Use of Outer Ear Images for Personal Identification in Security Applications. IEEE 33rd Annual International Carnahan Conference on Security Technology, 1999, pp. 469- 476. [12].Victor, B., Bowyer, K., Sarkar, S. An evaluation of face and ear biometrics in Proceedings of International Conference on Pattern Recognition, pp. 429-432, August 2002.
[13].Jain, A., Hong, L., Pankati, S. Biometric Identification Communications of the ACM, February 2000/Vol. 43, No. 2, pp. 91-98.
[14].Burge, M. and Burger, W. Ear Biometrics in Computer Vision. In the 15th International Conference of Pattern Recognition, ICPR 2000, pp. 826-830.
[15].Chang, K., Bowyer. K.W., Sarkar, S., Victor, B. Comparison and Combination of Ear and Face Images in Appearance-Based Biometrics. IEEE Transactions on Pattern Analysis and Machine Intelligence, vol. 25, no. 9, September 2003, pp. 1160-1165.
[16].Hurley, D.J., Nixon, M. S., Carter, J.N. Automated Ear Recognition by Force Field Transformations in Proceedings IEE Colloquium: Visual Biometris (00/018), 2000a, pp. 8/1-8/5.
[17].H.P. Narkhede, “Review of Image Segmentation Techniques, “International Journal of Science and Modern Engineering (IJISME), vol.1, pp. 54-61, July 2013.
[18].Shalove Agarwal, Shashank Yadav and Kanchan Singh, “K-mean versus k-mean++ clustering Techniques”, in IEEE, 2012.
[19].Juntao Wang and Xiaolong Su, "An improved k-mean clustering algorithm", in IEEE, pp 44-46, 2011.
[20].Hazem M. El-bakry, “Human Iris Detection Using Fast Cooperative Modular Neural Nets,” Proc. of INNSIEEE International Joint Conference on Neural Networks, pp. 577-582, 14-19 July, 2001, Washington, DC, USA.
[21].D. J. Hurley, M. S. Nixon, and J. N. Carter, “Automatic ear recognition by force field transformations,” in Visual Biometrics(Ref. No. 2000/018), IEE Colloquium on, pp. 7/1–7/5, IET, 2000.
[22].P. Yan and K. Bowyer, “Empirical evaluation of advanced ear biometrics,” in Proceedings of the 2005 IEEE Computer Society Conference on Computer Vision and Pattern Recognition (CVPR‟05)- Workshops - Volume 03 CVPR ‟05, pp. 41–41, IEEE, 2005.
[23].S. Ansari and P. Gupta, “Localization of ear using outer helix curve of the ear,” in Computing: Theory and Applications, 2007. ICCTA‟07. International Conference on, pp. 688–692, IEEE, 2007.
[24].L. Yuan and Z.-C. Mu, “Ear detection based on skin-color and contour information,” in Machine Learning and Cybernetics, 2007 International Conference on, vol. 4, pp. 2213–2217, IEEE, 2007.
[25].S. Prakash, U. Jayaraman, and P. Gupta, “A skin-color and template based technique for automatic ear detection,” in Advances in Pattern Recognition, 2009. ICAPR‟09. Seventh International Conference on, pp. 213–216, IEEE, 2009.
[26].H. Cummings, M. S. Nixon, and J. N. Carter, “A novel ray analogy for enrolment of ear biometrics,” in Biometrics: Theory Applications and Systems (BTAS), 2010 Fourth IEEE International Conference on, pp. 1–6, IEEE, 2010. [27].D. J. Hurley, M. S. Nixon, and J. N. Carter, “Force field feature extraction for ear biometrics,” Computer Vision and Image Understanding, vol. 98, no. 3, pp. 491–512, 2005.
[28].M. Burge and W. Burger, “Ear biometrics for machine vision,” 1997.
[29].M. Choras, “Ear biometrics based on geometrical method of feature extraction,” in ´ Articulated Motion and Deformable Objects, pp. 51–61, Springer volume 3179 of Lecture Notes in Computer Science, 2004.
[30].D. Shailaja and P. Gupta, “A simple geometric approach for ear recognition,” in Information Technology, 2006. ICIT‟06. 9th International Conference on, pp. 164– 167, IEEE, 2006.
[31].P. Yan and K. W. Bowyer, “Biometric recognition using 3D ear shape,” Pattern Analysis and Machine Intelligence, IEEE Transactions on, vol. 29, no. 8, pp. 1297–1308, 2007.
[32].S. Prakash and P. Gupta, “An efficient technique for ear detection in 3D: Invariant to rotation and scale,” in Biometrics (ICB), 2012 5th IAPR International Conference on, pp. 97–102, IEEE, 2012.
[33].J. Zhou, S. Cadavid, and M. Abdel-Mottaleb, “Histograms of categorized shapes for 3D ear detection,” in Biometrics: Theory Applications and Systems (BTAS), 2010 Fourth IEEE International Conference on, pp. 1–6, IEEE, 2010.
[34].S. M. Islam, R. Davies, M. Bennamoun, and A. S. Mian, “Efficient detection and recognition of 3D ears,” International Journal of Computer Vision, vol. 95, no. 1, pp. 52–73, 2011.
[35].H. Chen and B. Bhanu, “Human ear recognition in 3D,” Pattern Analysis and Machine Intelligence, IEEE Transactions on, vol. 29, no. 4, pp. 718–737, 2007.
ISSN: 2395-3519
www.ijatca.com 68 images using 2D and 3D ear data,” in Proc. of the 4th Intl
Symposium on 3DPVT, pp. 131–141, 2008.
[37].T. Theoharis, G. Passalis, G. Toderici, and I. A. Kakadiaris, “Unified 3D face and ear recognition using wavelets on geometry images,” Pattern Recognition, vol. 41, no. 3, pp. 796–804, 2008.
[38].S. M. Islam, M. Bennamoun, A. S. Mian, and R. Davies, “Score level fusion of ear and face local 3D features for fast and expression-invariant human recognition,” in Image Analysis and Recognition, pp. 387–396, Springer volume 5627 of Lecture Notes in Computer Science, 2009. [39].J. D. Bustard and M. S. Nixon, “3D morphable model construction for robust ear and face recognition,” in Computer Vision and Pattern Recognition (CVPR), 2010 IEEE Conference on, pp. 2582–2589, IEEE, 2010.
[40].http://www.tutorialspoint.com/biometrics/biometrics_o verview.htm
[41].http://bio-metrica.com/biometric-theory
[42].https://sarwiki.informatik.hu-berlin.de/Biometry [43].http://electronicimaging.spiedigitallibrary.org/article.as px?articleid=1909992
[44].http://www.hindawi.com/journals/jc/2012/635190/fig1 [45].http://futurehumanevolution.com/artificial-intelligence-future-human-evolution/artificial-neural