https://dx.doi.org/10.24001/ijaems.3.4.7 ISSN: 2454-1311
Removal of Basic Dyes from Aqueous Solution
by Adsorption Using Rice Husk Ash-A Fixed Bed
Column Study
Soumitra Banerjee
1, Dr. Anupam Debsarkar
2, Dr. Siddhartha Datta
31ResearchScholar Department of Chemical Engineering, Jadavpur University, Kolkata, India 2Department of Civil Engineering, Jadavpur University, Kolkata, India
3Department of Chemical Engineering, Jadavpur University, Kolkata, India
Abstract—The present article deals with the removal of two basic dyes MB and MG [i.e. methylene blue and malachite green] from a solution mixture using Rice Husk Ash, an agricultural waste. MB and MG are most commonly used dyes in textile industries and removal of two dyes with higher concentrations from the solution mixture is a typical attempt to solve the real life problem on dye removal. The effects of bed depth, influent concentration, flow rate, pH of the influent solution on breakthrough curve were investigated. Thomas, Yoon-Nelson, Adamas-Bohart and Bed Depth Service Time [BDST] model were used to validate the adsorption performance and breakthrough curves. The removal of dyes at different flow rate [5, 7.5, 10, 12.5 ml/min], bed depths (6, 8, 10 cm), influent concentrations [170, 190, 200, 240 mg/L] and pH value [5.1, 7, 9.2] using Rice Husk Ash as an adsorbent were studied. The experimental results indicated that percentage adsorption of dyes increased with decreasing flow rate, increasing bed depth and lowering of influent concentration. The results further revealed that the percentage removal of dyes in the mixture was 99 %.Adams-Bohart and Thomas model were performed well than the other two models in use. Keywords— adsorption, breakthrough curve, methylene blue, malachite green, models, rice husk ash.
I. INTRODUCTION
Dye manufacturing industries and many other industries using dyes and pigments generate liquid wastes, are characteristically high in color and organic content. Presently, it was estimated about 10000 of different dyes, pigments exist commercially, and over 7x10⁵ tones are
produced annually worldwide [1].
Dyes are widely used in industries such as textile, rubber, paper, plastic, cosmetic etc. Among these various industries, textile rank first in usage of dyes for coloration of fiber. The conventional wastewater treatments that rely on aerobic biodegradation have low removal efficiency for reactive and other anionic soluble dyes [2]. Hence,
conventional biological treatment processes are not found to be much effective in treating dye wastewater. Adsorption process is one of the most effective methods for removal of dyes from the effluent, which has a distinct edge over other methods due to its sludge free clean operation and complete removal of dyes, even from the diluted solution. Activated carbon is most widely used adsorbent because of its excellent adsorption efficiency for the organic compounds. However, commercially available activated carbon is very expensive. Furthermore, regeneration using solution produced small additional effluent while regeneration by refractory technique results in a 10-15% loss of adsorbents and its uptake capacity [3]. This had led to further studies for cheaper substitutes for the adsorbents. Nowadays, there are numerous numbers of low cost commercially available adsorbents, which are being used for the dye removal. The most widely used adsorbents for this purpose were orange and banana peels [4], neem leafs and other agricultural wastes [5]. Rice husk ash [RHA] is one of such low cost adsorbents, which is available as waste material in the agricultural fields in rural India. Rice husk ash contains abundant floristic fiber, protein and some functional groups such as carboxyl, hydroxyl etc., which make adsorption process possible [6].
https://dx.doi.org/10.24001/ijaems.3.4.7 ISSN: 2454-1311
II. MATERIAL AND METHODS 2.1 Adsorbent
The Rice Husk was collected locally and was burnt in the muffle furnace near 5500C, washed a few times with
distilled water, dried for 8 hours at 600C in the oven. The
ash was sieved through 600 micron and retained by 300 micron and finally was used for column studies.
2.2 Adsorbate
Malachite green [A.R. Grade, purity>96%] and Methylene blue (A.R. Grade, purity >95%) were procured from local market and used as received. The two dyes are mixed in equal proportion (1:1) to make the dye solution.
2.3 Adsorption experiments
Continuous adsorption of dyes in mixed solution of methylene blue and malachite green dyes was studied using a fixed bed acrylic column with internal diameter of 50 cm and single sampling point at the bottom. The adsorbent was packed over the glass beads and glass wool to ensure uniform inflow through the column. The mixed dye solution was introduced from the top to the bottom of the column using a peristaltic pump at desired flow rate. The experiment was carried out by passing the dyes solution through the column packed with RHA with controlled flow rate. The experimental observations were noted operating the column at steady state under different conditions.
III. COLUMN ADSORPTION MODEL The performance of a packed bed is obtained through the concept of breakthrough curve. The time for breakthrough appearance and the shape of the breakthrough curve are important characteristics for determining the operation and dynamic response of an adsorption column. Moreover, successful design of an adsorption column requires prediction of the concentration-time profile from breakthrough curve for the effluent discharged from the column [(7]. In many cases, kinetics of adsorption in column has been tested for Adams-Bohart model. However, it has also been shown that BDST, Thomas and Yoon-Nelson models can sometimes provide a better description of the adsorption kinetics. So in this study, an attempt has been made to find out the best model describing the adsorption kinetics in the column studied.
3.1 Thomas Model
The Thomas model is one of the most general and widely used methods in studying the performance of a continuous column operation. The expression by Thomas for an adsorption column (8) is given as follows:
𝐶𝑡
𝐶0
=
1 1+exp{K
TH(q0x−C0Veff)/v}
--- (1)
where, Ct is the effluent dye concentration [mg/L], C0 is
the initial dye concentration [mg/L], x is the mass of the used adsorbent [g], Veff is the effluent volume [mL], v is
the flow rate (mLmin-1), k
TH is the Thomas rate constant,
and q0 is the maximum dye adsorption capacity of the
adsorbate (mg/g), which is calculated from the plot of ln[(Ct/C0)-1] versus t.
3.2 Yoon-Nelson Model
The linear form of Yoon-Nelson model [9] is:
ln[𝐶𝑡⁄(𝐶0− 𝐶𝑡)] = KYNt − TKYN--- (2) where, KYN is Yoon-Nelson constant, T is the time
required for 50 % adsorbate breakthrough and t is the sampling time. A plot of ln [Ct/(C0-Ct)] versus t gives
straight line curve with a slope of KYN and intercept of
TKYN. Based upon the obtained value of T, the adsorption
capacity, q0YN was determined using:
𝑄0𝑌𝑁 = 𝑞(𝑡𝑜𝑡𝑎𝑙)/𝑋 --- (3) Adsorption capacity (q0YN) related to Yoon-Nelson varies
as inlet dye concentration [C0], flow rate [Q], 50%
breakthrough time derived from Yoon-Nelson equation and weight of adsorbent [X].
3.3 Bed Depth Service Time Model
The BDST model relates the service time of a fixed bed with the height of adsorbent in the bed, hence with its quantity, as its quantity is directly proportional to the bed height. The measurement of sorbent quantity is more precise than the determination of the respective volume, especially for the case of granules. Therefore, sorbent quantity is being preferably used, instead of the bed height. The linear form of BDST model [10] is:
t= 𝑁0
𝐶0𝐹𝑍− 1/𝐾𝑎𝐶0ln[𝐶0/(𝐶𝑡− 1)] --- (4)
where, t is the service time [min], N0 is the adsorption
capacity [mg/g], F is the superficial liquid velocity [cm/min], Z is the height of column [cm], and Ka is the
rate constant of adsorption (L/min/mg) at time t. A plot of t versus bed depth Z, should yield a straight line where N0
and Ka, the adsorption capacity and rate constant
respectively, can be evaluated. Application of the BDST model requires specification of the breakthrough time, which was selected arbitrarily in this work as the time corresponding to Ct/C0 ratio is varying from 0.1 to 0.4.
3.4 Adams-Bohart Model
Adams-Bohart established the fundamental equations that describe the relationship between Ct/C0 and time in an
https://dx.doi.org/10.24001/ijaems.3.4.7 ISSN: 2454-1311
𝑇 = (𝑁0𝑥
𝐶0𝑣
⁄ ) − ln(𝐶0⁄𝐶𝑡− 1)/𝐶0𝐾𝐴𝐵 ---(5)
where, KAB is the rate constant and N0 the adsorption
capacity, which are calculated from plot of ln{Ct/C0)
versus time t.
IV. RESULTS AND DISCUSSION 4.1 Effect of bed depth on breakthrough curve
Accumulation of two basic dyes in aqueous solution MB and MG in the packed bed column is largely dependent on the quantity of sorbent inside the column. In order to yield different bed heights, 4.165, 6.723 and 8.126 gm of RHA were added to produce the desired height of 6, 8 and 10 cm respectively.
Fig 4.1 shows the breakthrough curve obtained by varying the bed heights for different RHA between 6 cm, 8cm and 10 cm, at flow rate [q0] of 10 ml/min and at a fixed
influent concentration [C0] of 170mg/L. Similar approach
was made with other influent concentrations also. The time required for the effluent to reach breakthrough concentration increased with increase in the bed depth. The increase in adsorption with bed depth may be attributed to the increase in adsorptive binding sites of the adsorbent. Although an increasing bed depth increases breakthrough time, very high bed depth is not useful for single column. The shape and gradient of the breakthrough curves were slightly different with the variable bed depth. As the bed height increases in the order of 6 cm, 8 cm, and 10 cm the curves change their profile from steep concave to flatter concave [12].
Fig.4.1 Effect of bed height (at 4, 6 and 8cm) on adsorptive removal of methylene blue and malachite
green onto RHA (at C0= 170mg/L q0= 10mL/min)
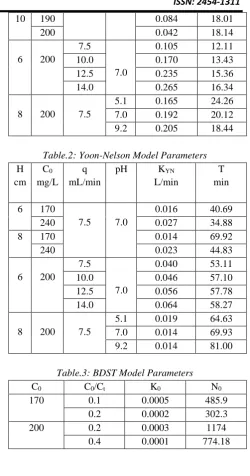
4.2 Effect of flow rate on breakthrough curve
Fig. 4.2 shows the breakthrough profile for the adsorption of mixed dye solution of methylene blue and malachite green in the continuous flow fixed bed with RHA at room temperature. The flow rate was varied from 7.0 mL/min to 14 mL/min while the inlet concentration and bed depth of the solution was held constant at 200 mg/L and 6 cm respectively. When the adsorption zone moves upwards and upper edge of this zone reaches the top of the column,
the effluent concentration has started to rise rapidly. This point is called breakthrough point. Using a smaller flow rate, the front of the adsorption zone reaches the top of the column later, thereby giving higher breakthrough time. An increase in the flow rate appears to increase the sharpness of the breakthrough curve. As the flow rate through the bed increases, the depth of the adsorption zone increases and the time of contact of the solution with adsorption zone decreases [13].
Fig.4.2 Effect of flow rate (at 7, 10, 12 and 14mL/min) on adsorptive removal of methylene blue and malachite
green onto RHA [at C0= 200mg/L, H= 6cm]
4.3Effect of initial dye concentration on breakthrough curve
Fig. 4.3 shows the breakthrough profile for the adsorption of methylene blue and malachite green in dye solution in the continuous flow fixed bed with RHA at different influent concentrations at room temperature. The influent concentration was varied from 170 mg/l to 240 mg/l, while the bed depth of the column and influent flow rate were held constant at 6 cm and 10 mL/min respectively. The similar approach was taken for bed height 8 cm and 10 cm respectively. It was illustrated that the breakthrough time deceased with increasing influent dye concentration. At lower concentrations, breakthrough curves were dispersed and breakthrough occurred slower. As influent concentration increased, sharper breakthrough curve were obtained. These results demonstrated that the concentration gradient affects the saturation rate and breakthrough time. This can be explained by the fact that more adsorption sites were being converted and utilized as the dye concentration increased. The larger the influent concentration the steeper is the slope of breakthrough curve and smaller is the breakthrough time. As the influent concentration increases, dye loading rate increases, so does the driving force increases for mass transfer, which results in a decrease in the adsorption zone length [14].
0 0.5 1 1.5 2 2.5
0 100 200
Ct/C0
Time(mins)
https://dx.doi.org/10.24001/ijaems.3.4.7 ISSN: 2454-1311
Fig.4.3 Effect of influent concentrations [at 170, 190, 200 and 240mg/L] on adsorptive removal of methylene blue
and malachite green onto RHA [at H=6cm, q0=
10mL/min]
4.4 Effect of pH on breakthrough curve
The pH is regarded as a critical parameter in the adsorption process since it controls the uptake mechanism of the adsorbate as well as influences the adsorption sites on the solid surface. In the present study, the pH of the dye solution was taken as 5.1, 7.0 and 9.2 by using pH capsules into the solution while the bed depth and concentration were restricted at 8 cm and 200 mg/L respectively. The figure 4.4 shows that the adsorption increased as the pH value increased. This was due to the fact that in basic solution [pH=9.2] the adsorption of cationic dyes was favoured due to presence of negatively charged sites on the adsorbent surface, resulting in the electrostatic forces between groups and positively charged dye molecules. On the other hand, in acidic solution (pH = 5.1) the adsorption of dyes was retarded due to sorption competition between hydrogen ions (H+) and dye
molecules for occupancy of the active sites (15).
Fig.4.4: Effect of pH (at 5.1, 7.0 and 9.2) on the adsorptive removal of methylene blue and malachite
green onto RHA (at H= 8cm, C0= 200mg/L).
4.5 Data fitting to Thomas Model
The data obtained from the experiment were filled to the Thomas model using equation (1). From the analysis, it can be concluded that all of the factors viz. the inlet
concentration, bed depth, flow rate, pH influence the Thomas rate constant [KTH] and the equilibrium of mixed
dyes uptake [q0]. The inlet concentration, bed depth, flow
rate and pH of the influent dye solution of MB and MG influences the KTH and q0 as given in the Table -1. From
the above table it is obvious that when concentration was increased from 190 mg/L to 200 mg/L for a bed depth of 6 cm, q0 increased from 13.82 to 14.09 and KTH decreased
from 0.126 to 0.125. Similarly, for the same inlet concentration for a bed depth of 10cm the KTH value
decreased from 0.084 to 0.042 where as q0 increased from
18.01 to 18.14.
When the bed height was maintained at 6 and 10 cm, the KTH value was decreased as 0.126, 0.084 and q0 increased
as 13.82, to 18.01respectively for inlet concentration of 190 mg/L. In another set of experimental result where bed depth was varied successively at 6 and 10 cm, the KTH
value was obtained as 0.0.125 and 0.042 respectively, for a concentration of 200 mg/L. The corresponding values for q0 increased with the increase in bed depth were
14.09, and 18.14 respectively.
When the flow rate increased from 7.0 mL/min, to 14 mL/min, the KTH value increased from 0.105 to 0.265 and
corresponding values for q0 increased from 12.11 to
16.34.
When the pH of the inlet concentration increased from 5.1 to 9.2, the kTH values were 0.165, 0.192 and0.205
respectively whereas, uptake q0 decreased as 24.26, 20.17
and 18.44 respectively. The R2 value for over all reactions
varied 0.915 to 0.986 indicated that Thomas model described the experiment well.
4.6 Data fitting to Bed Depth Service Time [BDST] Model
The constants, N0 and K0 of BDST model at different
conditions were evaluated using linear regression analysis and the linear plot of this model is given in Table-3. The trend of K0 and N0 could be determined from the values
presented in the table. As Ct/C0 value increased, the value
of K0 and N0 were found to be decreased. The R2 value
for overall reactions varied from 0.7 to 0.75 indicated that this model cannot describe the experimental run well.
4.7 Data fitting to Yoon-Nelson Model
Different parameters of the Yoon-Nelson model can be determined by using linear regression analysis. The equation of straight line was used to determine the rate velocity constant (KYN) and time (T) required to achieve
50% breakthrough. From the Table-2, the effect of influent concentration, bed depth, flow variation and variation of initial pH of the mixed dyes solution over the model parameters were studied. When the concentration of influent dyes increased from 170 to 240 mg/L at a
-0.2
0
0.2
0.4
0.6
0.8
1
1.2
1
3
5
7
9
11
Ct/C0
Time(min)
C0=170
mg/L
C0=190
mg/L
0 0.2 0.4 0.6 0.8 1 1.2
0 100 200
Ct/C0
Time(mins)
https://dx.doi.org/10.24001/ijaems.3.4.7 ISSN: 2454-1311
constant bed depth of 6 cm, the values of KYN increased
from 0.016 to 0.027 and those of T decreased from 40.69 to 34.88.Similarly, for bed depth of 8 cm, when the concentration increased from 170 to 240 mg/L, the values of KYN increased from 0.014 to 0.023 and those of T
decreased from 91.12 to 48.65.
With the increase in bed depth for a fixed influent concentration there was no significant change for the values of KYN and T.
With the increase in flow rate from 7.0 to 10, 12, and 14 mL/min, KYN increased from 0.040 to 0.046, 0.056 and
0.064 respectively and the values of T increased from 53.11 to 57.10, 57.78 and 58.23 respectively.
With the increase of pH of the inlet concentration from 5.1 to 9.2, there was no significant effect on KYN value. T
value increased slightly with the increasing pH of the solution. The linear regression coefficient (R2) in all cases
was around 0.76 which indicated that this model cannot be used to explain the overall kinetics explicitly in the column adsorption.
4.8 Data fitting to Adams-Bohart Model
A plot of ln (Ct/C0) against time (t) was used to calculate
the values of N0 and KAB. The Table-4 the different model
parameters like bed depth, concentration of initial adsorbate concentrations, flow rate of solution dyes and the pH of the solution were studied. From the table it indicated that with the increase in influent concentration from 200 to 240 mg/L at bed depth of 8 cm, KAB
increased from 0.040 to 0.050 whereas the values of uptake (N0) decreased from 0.09 to 0.006. Similar trend
on parametric values was also observed for a bed depth of 10cm
The effects of bed depth over the reaction constant KAB
and uptake N0 was investigated and was shown in the
Table. With the increase in bed depth, the reaction constant (KAB) increased while the uptake (N0) decreased.
The effect of flow rate over the reaction constant (KAB)
and the uptake value (N0) was depicted in the Table-3. As
the flow rate increased from 7.0 to 14 mL/min, the values of KAB and N0 increased.
The effect of pH of the inlet solution was studied. The reaction constant (KAB) decreased and uptake (N0)
increased when pH increased from 5.1 to 9.2. The R2
value for over all reactions more than 0.9 indicated that Adams-Bohart model described the experiment well.
Table.1: Thomas model parameter
H cm
C0
mg/L q mL/min
pH KTh
mL/mg/min
q0
mg/g
6 190
7.5 7.0
0.126 13.82
200 0.125 14.09
10 190 0.084 18.01
200 0.042 18.14
6 200
7.5
7.0
0.105 12.11
10.0 0.170 13.43
12.5 0.235 15.36
14.0 0.265 16.34
8 200 7.5
5.1 0.165 24.26 7.0 0.192 20.12 9.2 0.205 18.44
Table.2: Yoon-Nelson Model Parameters
H cm
C0
mg/L q mL/min
pH KYN
L/min
T min
6 170
7.5 7.0
0.016 40.69
240 0.027 34.88
8 170 0.014 69.92
240 0.023 44.83
6 200
7.5
7.0
0.040 53.11
10.0 0.046 57.10
12.5 0.056 57.78
14.0 0.064 58.27
8 200 7.5
5.1 0.019 64.63 7.0 0.014 69.93 9.2 0.014 81.00
Table.3: BDST Model Parameters
C0 C0/Ct K0 N0
170 0.1 0.0005 485.9
0.2 0.0002 302.3
200 0.2 0.0003 1174
0.4 0.0001 774.18
Table.4: Adams-Bohart Model Parameter
H cm
C0
mg/L q mL/min
pH KAB
L/mg.min
N0
mg/L
8 200
7.5 7.0
0.040 0.09
240 0.050 0.006
10 200 0.050 0.007
240 0.053 0.004
6 200
7.5
7.0
0.09 0.09
10 0.10 0.10
12.5 0.13 1.16
14 0.15 1.21
8 200
https://dx.doi.org/10.24001/ijaems.3.4.7 ISSN: 2454-1311
V. CONCLUSION
The present study confirmed that the abundant agricultural waste product rice husk ash could be used as an alternative to commercial activated carbon for the removal of two basic dyes MB and MG from aqueous mixture. The breakthrough curve (Ct/C0 vs. t) for various
parameters viz. flow rate, initial concentrations of two dyes in solution, bed heights of the adsorbent, and pH of the dyes in initial solution was plotted. The breakthrough time and exhaust time decreased with increasing flow rate, increases with increasing bed height and pH value of the concentration. The breakthrough time and exhaust time decreased with increasing initial dye concentration. These variations can be accounted for by the fact that for lower flow rate and higher bed depth, the contact time is longer and hence the interaction between adsorbate and adsorbent is greater. The experimental data were fitted to Thomas, Adams-Bohart, Yoon-Nelson, and BDST models. The maximum adsorption capacity related to BDST model was found to be 774.18 mg/l at initial concentration (C0) 200mg/L, flow rate (q0) 10 mL/min,
and bed height (H) 10 cm. The investigation showed that the Thomas model and Adams- Bohart model were more effectively applicable than other two models for their higher R2 value.
ACKNOWLEDGEMENTS
The authors are thankful to Mr. Anirban Kundu Chowdhury, Research Scholar, School of Environmental Sciences, Jadavpur University for his sincere support during the course of experimental work. The authors are also grateful to Mr. Snehil Kumar M.E. student and all laboratory staff members of Department of Civil Engineering, Jadavpur University for their technical assistance.
.
REFERENCES
[1] A.Saiful, G. Liew, D.Faizul, “Dye removal from aqueous solution by using adsorption on treated sugarcane bagasse,” American Journal of Applied Science, 2005 2(11), 1499-1503.
[2] V.K. Garg, Rakesh Kumar and G .Renuka,,”Removal of malachite green dye from aqueous solution by adsorption using agro-industries waste: A Case Study of Phosopisceneraria,” Dyes & Pigments, 2004 62(1), 1-10 .
[3] V.K. Garg, G. Renuka, Anu Bala Yadav and Rakesh
Kumar, “Dye removal from aqueous solution by adsorption on treated saw dust” , Bioresource
Technology,2003 89(2), 121-124.
[4] G. Annaduari, R. Juang, and D. Lee, “Use of cellulose-based wastes for adsorption of dyes from
aqueous solution” J. Hazard. Mater. 2002 (B92),
263-274.
[5] K.G. Bhattacharya and A. Sharma “Adsorption characteristics of the dye, brilliant green on neem leaf
powder” , Dyes & Pigments, 2003 (57), 211-222.
[6] C. Namasivayam, R.C. Yamuna, “Removal of Rhoda
mine-B by biogas slurry from aqueous solutions,” Water and soil Pollution, 1992 65(1-2), 133-139.
[7] M.T. Uddin, M. Rukanuzzaman, and M.A. Islam, “
Adsorption of methylene blue from aqueous solution by jackfruit (Artocarpus heteropyllus) leaf powder: a fixed-bed column study”, Journal of Environmental Management,2009 90(11), 3443-3450.
[8] A.A. Ahmad, and B.H. Hameed, “Fixed-bed
adsorption of reactive azo-dye onto granular
activated carbon prepared from waste,” Journal of
Hazardous Materials,2010 175(1-3), 298-30
[9] P. Sivakumar, and P.N. Palanisamy, “Adsorption
studies of basic red 29 by a non-conventional activated carbon prepared from Euphorbia
Antiquorum L,” International Journal of Chem. Tech.
Research,2009 1(3), 502-510.
[10] R. Han, Y.F. Wang, W.H. Yu, W.H. Zou, H. Shi, and
H.M. Liu, “Biosorption of methylene blue from
aqueous solution by rice husk ash in a fixed-bed
column,” Journal of Hazardous Materials, 2007
141(3), 713-718.
[11] M. Calcero, F.Herna’inz, G. Bla’zquez G. M.A. Tenorio, Martin-Lara “Study of Cr (III) biosorption in a fixed-bed column,” Journal of Hazardous Materials,2009 141 (3), 713-718.
[12] R. Han, Y. Wang, X. Zhao, Y. Wang, F. Xie, J. Cheng, and M. Tang, Adsorption of methylene blue by phoenix tree leaf powder in a fixed-bed column: experiments and prediction of breakthrough curves. Desalination, 2009 245(1-3), 284-297.
[13] J. Wu, and H.Q. Yu, “Biosorption of 2,4 -dichlorophenol from aqueous solutions by immobilized phanerochaete chrysosporium biomass in a fixed-bed column,” 2008 Chemical Engineering Journal, 138(1-3), 128-135.
[14] J. Goel, K. Kadirvelu, C. Rajagopal,.and V. Kumar
Garg, “Removal of lead (II) by adsorption using
treated granular activated carbon: Batch and column
studies,”. Journal of Hazardous Materials,2005
125(1-3), 211-220.
K. Kannan, K. Senthil Kumar, P. Akilamudhan, V.
Sangeetha, and B. Manikandan, “Studies on
effectiveness of Low Cost adsorbents in Continuous
Column for Textile Effluents,” International Journal
![Fig.4.2 Effect of flow rate (at 7, 10, 12 and 14mL/min) on adsorptive removal of methylene blue and malachite green onto RHA [at C0= 200mg/L, H= 6cm]](https://thumb-us.123doks.com/thumbv2/123dok_us/1304549.1637717/3.595.315.555.178.307/fig-effect-adsorptive-removal-methylene-malachite-green-rha.webp)