481 | P a g e
INFLUENCE OF LOW DELIVERY PRESSURE OF AIR
COMPRESSOR ON MOTOR SPEED USING VARIABLE
SPEED DRIVE
Amit Bahekar
1, Dr. Sanjeev Yadav
21
Research Scholar, Department of Mechanical Engineering, Sunrise University, Alwar(India)
2
Research Supervisor, Department of Mechanical Engineering, Sunrise University, Alwar(India)
ABSTRACT
For the same capacity, Air compressor required more electric power at high delivery pressure and vice versa. If
we operate compressor at very high pressure which is not essential for desired application then it is only a
waste of energy but also leads to a excessive wear, leads to further waste of energy. If we operate compressor at
high pressure then its volumetric affiance get automatically reduced. There is a huge possibility of saving
electric power as well as component life by lowering delivery pressure as well as lowering motor speed of
compressor. In this paper we have used AT 8952 Micro controller to reduced motor speed with the help of
variable speed drive unit. Of course operating a compressor at 8 bar instead of 5 bar which is sufficient to fulfill
application requirement leads to higher consumption of electric units. In such leakage rate also increases. Ever
effort has been made to reduce compressor pressure and motor speed to lowest possible setting. A reduction in
delivery pressure by 1 bar would reduce electric power by 7 to 10 percent.
Keyword -- Energy Efficient Comressor, VSD Controlled Electric Motor
I. INTRODUCTION
1.1 Basic System
Before implementing energy reduction strategies in compressor, be familiar with all aspects of your compressed
air system.
1.1.1 System supply
Evaluate the supply side of your compressed air system for the types of compressors used and the type,
suitability and settings of capacity controls and other operating conditions. Understand the fundamental
capabilities of the system and its various modes of operation.
Validate that air compressors are not too big for end uses. For example, an air compressor is oversized if the end
use only requires air pressure that is 50 % of the pressure that the compressor is capable of producing.
1.1.2 System demand
Identify all the uses of compressed air in the plant with their pressure ranges. Quantify the volume of air used in
each application and produce a demand profile, quantity of air used as a function of time, for the compressor.
Equipment specifications for operations that use air are good resources for obtaining data on air volume use
rates. The profile highlights peak and low demand. A general evaluation of compressed air use will help identify
482 | P a g e
1.1.3 System diagram
Develop a draft of your compressed air system—including compressors, air supply lines with dimensions, and
compressed air end uses—to supply an overall view of the entire compressed air process.
1.1.4 Distribution system
Examine the distribution system for any problems related to line size, pressure loss, air storage capacity, air
leaks and condensation drains. Corroborate that all condensation drains are operating properly because
inadequate drainage can increase pressure drop across the distribution system.
1.1.5 Maintenance
Calculate maintenance reports, procedures, records and training. Ensure that procedures are inplace for
operating and maintaining the compressed air system, and that employees are trained in these measures.
II. CONSERVATION STRATEGIES
Identify easy to execute energy conservation opportunities in your compressed air arrangement by conducting a walk-through assessment. Simple conservation opportunities can result in savings up to 25% of the current cost to run the compressor.
2.1 Leaks
Routinely check your compressor system for leaks. A distribution system under 150 pounds-per-square-inch
gauged (psig) of pressure, running 40 hours per week, with the equivalent of a quarter-inch diameter leak will
drop compressed air at a rate of over 100 cfm costing over $2,800 per year. In noisy environments an ultrasonic
detector may be needed to place leaks.
2.2 Compressor pressure
The compressor must produce air at a pressure high enough to beat pressure losses in the supply system and
still gathering the minimum operating pressure of the end use equipment. Pressure loss in a properly designed
compressed air system will be less than 10% of the compressor’s discharge pressure—found on a gage on the
outlet of the compressor. If pressure loss is larger than 10%, evaluate your distribution system and identify areas
causing excessive pressure drops. Every two pounds-per-square-inch decrease in compressor pressure will
decrease your working costs 1.5%.
2.3 Identify artificial demands
Artificial demand is produced when an end use is supplied air pressure higher than necessary for the
application. If an application requires 50 psi but is supplied 90 psi, surplus compressed air is used. Use pressure
regulators at the end use to minimize artificial demand.
2.4 Inappropriate use of compressed air
Look for wrong uses of compressed air at your facility. Instead of using compressed air, use air conditioning or
fans to cool electrical cabinets in industry; use blowers to agitate, aspirate, cool, mix, and inflate packaging; and
use low-pressure air for blow guns and air lances. Separate the compressed air source from unused equipment.
2.5 Heat Recovery
As much as 80 to 90% of the electrical energy used by an air compressor is converted to heat. A properly
designed heat recovery unit can improve 50 to 90% of this heat for heating air or water. Approximately 50,000
483 | P a g e
For example, consider a 100 hp compressor that generates 350 cfm at full load for 75% of the year. If 50% ofheat loss is well again to heat process water, the savings, at $0.50 per them, would be about $4,100 per year in
natural gas.
2.6 Inlet air filters
Maintain inlet air filters to stop dirt from causing pressure drops by restricting the flow of air to the compressor.
Retrofit the compressor with large-area air intake filters to help decrease pressure drop.
2.7 Compressor size
If your compressor is extra-large add a smaller compressor and sequence-controls to make its operation more
capable when partially loaded. Sequence-controls can regulate a number of compressors to equal compressed air
needs, as they vary throughout the day.
2.8 Air receiver/surge tank
If your compressed air system does not have an air receiver tank, add one to buffer short-term demand changes
and reduce on/off cycling of the compressor. The tank is sized to the power of the compressor. For example, a
40 hp air compressor needs approximately a 40-gallon air receiver tank.
2.9 Cooler intake air
When in taking cooler air, which is more intense, compressors use less energy to generate the required pressure.
For example, if 90o F intake air is tempered with cooler air from another source to 70o F, the 20o F temperature
drop will lower operating costs by almost 3.8%.
2.10 V-belts
Routinely check the compressor’s v-belts for accurate tightness. Loose belts slip more frequently which reduces
compressor efficiency.
III. ENERGY SAVING AIR COMPRESSOR
Why save energy?
Energy efficiency in compressed air has turn out to be a key issue on every Finance Directors and Plant
Managers agenda. With ever increasing costs of energy the have to generate compressed air in the most energy
efficient method possible is of dominant importance. Every rupee saved is straight off the direct cost of the
business and therefore provides major benefits to all companies be they large or small concerns. Direct Air are
able to propose advice and recommendations for all areas of your industry concerning the energy efficient
generation and use of compressed air with a pro active approach committed to providing energy efficient
solutions therefore driving down the cost of running your system.
Furthermore, you may be eligible for an interest free, energy-efficiency loan from The Carbon Trust towards the
cost of your energy savings solution
3.1 Energy Survey
Undergoing an energy survey is repeatedly the first step to improving the energy efficiency of your compressed
air unit. Direct Air exploit the most advanced energy surveying equipment to audit all areas including
generation, treatment, distribution and process usage. With energy costs ever increasing the require to control
the cost of your systems compressed air is becoming increasingly important. Direct Air's engineers will install
state of the art logging equipment which will permit us to forward a detailed survey on your compressed air
484 | P a g e
Following a full analysis of your systems energy and air usage Direct Air will forward a report on potentialways to generate energy savings via various methods dependent upon your site specific needs.Direct Air are
committed to providing energy efficient solutions for your sites air compressor requirements.
3.2 Retrofit Variable Speed Drive
If you have a variable air demand profile on site yet have enough air compressor capacity then why not change
an existing air compressor to Variable Speed? Direct Air offer retrofit variable speed drive systems that are
designed for utilize with all rotary screw air compressors and include the essential components to complete
integration of the drive with the compressor. The drive will convert an existing fixed speed air compressor to a
variable speed drive air compressor and is fully compatible for integration with the Energy Air compressor
control system.
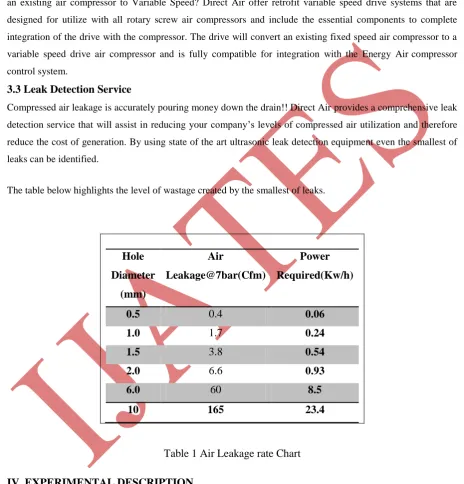
3.3 Leak Detection Service
Compressed air leakage is accurately pouring money down the drain!! Direct Air provides a comprehensive leak
detection service that will assist in reducing your company’s levels of compressed air utilization and therefore
reduce the cost of generation. By using state of the art ultrasonic leak detection equipment even the smallest of
leaks can be identified.
The table below highlights the level of wastage created by the smallest of leaks.
Table 1 Air Leakage rate Chart
IV. EXPERIMENTAL DESCRIPTION
For Experiment 150 pound reciprocating air compressor is used with 0.5HP 3 phase induction motor
@2880rpm and variable speed drive unit.
Electronic circuit has prepared with AT 8051 microcontroller witch give signal to variable speed drive
for speed control
Our aim of this set up is to reduce speed of motor according to desired pressure pressure.
Hole
Diameter
(mm)
Air
Leakage@7bar(Cfm)
Power
Required(Kw/h)
0.5
0.4
0.06
1.0
1.7
0.24
1.5
3.8
0.54
2.0
6.6
0.93
6.0
60
8.5
485 | P a g e
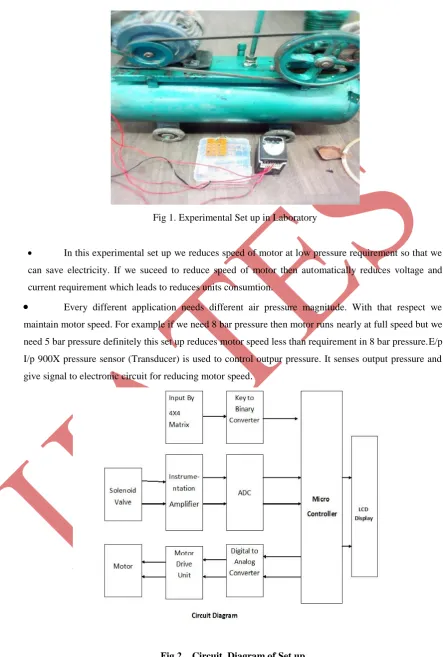
Fig 1. Experimental Set up in Laboratory In this experimental set up we reduces speed of motor at low pressure requirement so that we
can save electricity. If we suceed to reduce speed of motor then automatically reduces voltage and
current requirement which leads to reduces units consumtion.
Every different application needs different air pressure magnitude. With that respect we maintain motor speed. For example if we need 8 bar pressure then motor runs nearly at full speed but weneed 5 bar pressure definitely this set up reduces motor speed less than requirement in 8 bar pressure.E/p
I/p 900X pressure sensor (Transducer) is used to control outpur pressure. It senses output pressure and
give signal to electronic circuit for reducing motor speed.
486 | P a g e
Experimental set up is connected as mentioned in above figure. LCD display shows input pressure as well as
existing pressure inside the tank.
If receiver tank is full of pressure say 10 bar and our application requirement is 5 bar in such case motor will
be shifted to stand by mode i.e. not in running condition. This standby position is maintained till receiver
pressure reduces to 6 bar.
As soon as receiver pressure reaches to 6 bar Soleboid valve senses that pressure and give signal to
microcontroller for motor start. In that situation motor start running at 2250 rpm instead of 2880 rpm.
In above statement we have found two benefits. One is speed difference and another one is time difference.
Both are reduces our electrical energy cost.
If we run the motor at 2250 rpm instead of 2880 rpm definitely voltage and current consumption get reduced
which affect to reduces electrical unit consumption.
Total 22sec motor keeps in standby mode which also saved large amount of power.
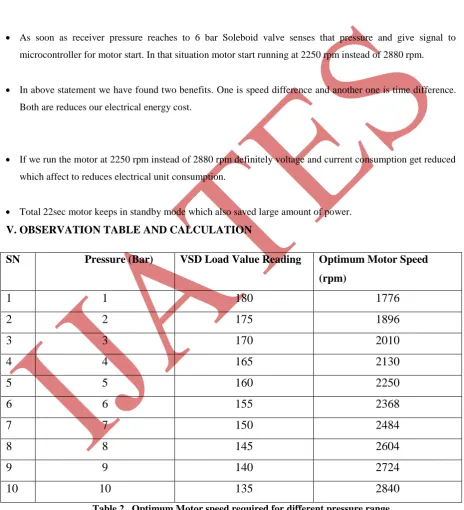
V. OBSERVATION TABLE AND CALCULATION
SN
Pressure (Bar)
VSD Load Value Reading
Optimum Motor Speed
(rpm)
1
1
180
1776
2
2
175
1896
3
3
170
2010
4
4
165
2130
5
5
160
2250
6
6
155
2368
7
7
150
2484
8
8
145
2604
9
9
140
2724
10
10
135
2840
Table 2. Optimum Motor speed required for different pressure range.
If compressor run 1896rpm for supplying 2 bar pressure.
Voltage= 160V , current =1.18 amp
487 | P a g e
P= 160 x 1.18=188.8watt1Kwh=1unit
(188.8x1)/1000= 0.1888 units
For 1 day = 0.188x24=4.5312 units
Commercial per unit cost is Rs 10
One day cost is =4.5312x10=Rs. 45.31
If compressor run 2130 rpm for supplying 4 bar pressure.
Voltage= 180V , current =1.25 amp
Power P= VxI
P= 180 x 1.25=225watt
1Kwh=1unit
(225x1)/1000= 0.225 units
For 1 day = 0.225x24=5.4 units
Commercial per unit cost is Rs 10
One day cost is =5.4x10=Rs. 54
The cost difference per day is nearly Rs 10
VI. CONCLUSION
It has been observed that if we used optimum pressure for particular application then we definitely saved
electrical units by lowering motor speed. This aspect is more important in those industries which are running
compressor in all time. In this experiment microcontroller chip is used with Embedded system programming
which is chiipest set up at mass production. In this paper the aim has been to determine a Power saving
Compressor in all aspect i.e. electric cost as well as maintenance. This set also help reducing wear & tear as
well as volumetric efficiency.
REFERENCES
[1] Schachter N. Energy efficient speed control using modern variable frequency drives. Available online at: http://www.cimentec.com [retrieved on 26th October 2010].
[2] Solomon S. Understanding variable speed drives (part 2), 1999. Available online at: http://ecmweb.com [retrieved on 14th October 2010].
488 | P a g e
[4] Eknath SY. Variable speed drive. Available online at: http://www.energymanagertraining.com [retrieved on26th October 2010].
[5] Rashid MH. Power electronics handbook. Canada: Academic press; 2001.
[6] ABB. A guide to using variable speed drives and motors in hospitals and healthcare centers; 2010. Available online at: http://www05.abb.com [retrieved on 28th October 2010].
[7] Al-Bahadly I. Energy saving with variable speed drives in industry applications. WSEAS Int.
[8] Carrier. Operation and application of variable frequency drive (VFD) technology. New York: Carrier Corporation Syracuse; 2005.
[9] Euro Pump. Variable speed pumping a guide to successful applications.U.S. Department of Energy, Energy Efficiency and Renewable Energy. Available online at: ttp://www1.eere.energy.gov
[10] Mustaffah S, Azma S. Variable speed drives as energy efficient strategy in pulp and paper industry. Master thesis. Malaysia: University Technology Malaysia; 2006.
[11] Saidur R. A review on electrical motors energy use and energy savings. Renewable and Sustainable Energy Reviews 2009;14:877–98.
[12] Shepherd W, Hulley LN, Liang DTW. Power electronics and motor control. Cambridge University Press; 1995, 539 pp.
[13] Okaeme N. Automated robust control system design for variable speed drives. PhD thesis. UK: University of Nottingham; 2008.