INTERNATIONAL RESEARCH JOURNAL OF PHARMACY
www.irjponline.com
ISSN 2230
–
8407
Research Article
DEVELOPMENT AND VALIDATION OF MICROBIAL BIOASSAY FOR QUANTIFICATION OF
CEPHALEXIN IN PHARMACEUTICAL PREPARATIONS
G. Rohit Reddy *, Chavi Dagar, T. Ramesh
Department of Pharmaceutical Analysis and Quality Assurance, Vishnu Institute of Pharmaceutical Education and
Research, Vishnupur, Narsapur, Medak, Telangana, India
*Corresponding Author Email: [email protected]
Article Received on: 15/05/17 Approved for publication: 18/06/17
DOI: 10.7897/2230-8407.08696
ABSTRACT
The aim of this study was to develop and validate a simple, sensitive, precise and cost-effective one-level agar diffusion (5+1) bioassay for estimation of potency and bioactivity of Cephalexin in pharmaceutical preparation which has not yet been reported in any pharmacopoeia. Escherichia coli MTCC-443 was selected as the most significant strain against Cephalexin. Bioassay was optimized by investigating several factors such as buffer pH, inoculums concentration and reference standard concentration. Identification of Cephalexin in commercial sample Cephadex tablet was done by FTIR spectroscopy. Mean potency recovery value for Cephalexin in Cephalexin tablet was estimated as 100.2%. A validated bioassay method showed linearity (r2=0.999), precision (Intraday RSD=1.09%, and Interday RSD=0.94%) and accuracy (99.53%, RSD=0.306%). Bioassay was correlated wi th
HPLC using same sample and estimated potencies were 100.2% and 99.25%, respectively. Results show that bioassay is a suitable method for estimation of potency and bioactivity of Cephalexin pharmaceutical preparations.
Keywords: Cephalexin, Escherichia coli MTCC-443, Cephadex, Nutrient Agar medium, HPLC, FT-IR.
INTRODUCTION
Cephalexin is chemically (6R, 7R) -7-[(2R) – Aminophenylacetyl] amino]-3-methyl-8-oxo-5-thia-1-aza bicyclo [4.2.0] Oct-2-ene-2-Carboxylic acid1 with molecular formulaC16H17N3O4S1and molecular weight 347.389 g/mol1. It is a white to off white crystalline powder3.Cephalexin is a semi synthetic first generation Cephalosporin antibacterial for the treatment of susceptible infections including those of respiratory tract, urinary tract and skin. It is effective against gram positive and gram negative organism2.Cephalexin is a beta-lactam antibiotic of the cephalosporin family.4 It is bactericidal and acts by inhibiting synthesis of the peptidoglycan layer of the bacterial cell wall by irreversibly bind to the active site of PBP, which is essential for the synthesis of the cell wall.5
Figure 1: Cephalexin structure
Among all pharmaceutical products, the most commonly faked and adulterated ones are antibiotics probably because the frequency of their use is very high 6. The misuse of antibiotics fosters the increase and spread of antibiotic resistance and may lead to super infections 7. An important factor in the development of drug-resistant trains of microorganisms is that many antibiotics are bacteriostatic rather than bactericidal 8. In order to over- come the resistance problem and for the safe use of antibiotics, the correct measurement of potency and bioactivity of antibiotics is essential. Due to the increased resistance problem, the quantification of the actual concentration of active ingredients in antibiotic preparation is critical. A mild difference in the concentration of active ingredient in antibiotic preparations may have impact on actual efficacy.
practical and economical methods which can be applied in the validation and dosage of drugs 13, 14. The application of microbiological assay has been recently developed for intravenously administered antibiotics. This method is highly acceptable by regulating authorities to control antibiotic potency 15,16. Microbiological bioassay plays an essential role in the manufacturing and quality control of antibiotic medicines and demands considerable skill and expertise to assure success 16,17. Microbiological assay helps in estimating active constituents, biological activity and in monitoring the stability of antibiotics. Any small change in the antibiotic molecule, which may not be detected by chemical methods, will be revealed by a change in antimicrobial activity. Hence, microbiological assay is very useful for resolving doubts regarding possible change in potency of antibiotics and their preparations. The potency of antibiotics can be measured by microbial bioassay, in which their inhibitory effect on the growth of test microorganisms is evaluated 12,18. Bioassays do not require specialized equipment or toxic solvents 19. The agar diffusion method widely used in antibiotic assay relates the size of the zone of inhibition to the dose of the antibiotic assayed. The relation of the diameter of inhibitory zones to concentration of antibiotic in a solution applied in cups has been considered theoretically 20,21. The ability of an antibiotic is to inhibit or to kill the growth of living microorganisms.
The inhibition of microbial growth in standardized conditions may be utilized for demonstrating the therapeutic efficacy of antibiotics. The proposed article focuses on the development and validation of a simple, sensitive, accurate, precise and cost-effective one-level agar diffusion (5+1) bioassay for the quantification of potency and bioactivity of Cephalexin in pharmaceutical preparations.
MATERIALS AND METHODS Apparatus
All equipments used for the bioassay study were calibrated and validated. Sterilized glassware such as Petri plates, test tubes, volumetric flasks, pipettes and were used in the experiment. Autoclave was used to sterilize the media at 121˚C and15psi for 15min.Glycerol stocks of microbial cultures stored at Deep freezer were used as test strains. Identification of Cephalexin was performed by an FTIR spectroscopy (Bruker) and HPLC (Agilent Technologies) was used for comparative study. Bioassay plates were incubated at 37˚C inside the incubator (Bio Tech India) for bacterial growth. Zones of inhibition were measured by an antibiotic zone reader.
Reagents and Materials
Cephalexin drug was procured as a gift sample from Chandra Labs Pvt. Ltd. Kukatpally, Hyderabad, Telangana. Sodium Chloride, Peptone, Beef Extract, Agar Agar, Phosphoric acid, Hydrochloric acid, Pottasium Dihydrogen Phosphate and Dipottasium Hydrogen Phosphate [A.R.Grade, SD Fine Chemicals Ltd., Mumbai] were used in the study. Escherichia coli cultures were procured from MTCC-443 used for microbiological bioassay.
Preparation of Reagents and Working standard stock solution
Preparation of Phosphate Buffer
13.6gms of Dipotassium Hydrogen Phosphate and 4gms of Potassium Dihydrogen Phosphate is weighed accurately and
dissolved in distilled water make up to 1000ml and adjust the PH with 8M Phosphoric acid and kept for Sterilization 22.
Preparation of Microbiological Media
Primary objective of the media was to support the rapid growth of indicator microorganism being used in the bioassay. Antibiotic assay mediumNo.9 was used as a bioassay medium. Nutrient Agar medium were used for slant preparation for bacterial growth. The media were dissolved in the distilled water and pH was adjusted as prescribed in Indian Pharmacopeia. Media were sterilized in the autoclave at 121˚C and 15 psi for 15min 23.
Preparation of Standard Solution
100mg of cephalexin (API) is dissolved in 100ml of Phosphate buffer to obtain 1000µg/ml. From the above stock solution take 0.1,0.2,0.3,0.4,0.5ml and make upto 10ml with Phosphate buffer to obtain 10,20,30,40,50µg/ml which is represented as S1,S2,S3,S4,S5 (S3 is considered as mean concentration level for
the standard).
Preparation of Sample Solution
A quantity of powder equivalent to 100mg of the commercial sample cephalexin tablet was weighed accurately and transferred into 100 ml volumetric flask. The final volume was made upto 100 ml with Phosphate buffer to obtain 1000µg/ml and finally a dilution was made (T1-5).
Inoculum Preparation
Nutrient agar medium was sterilized by autoclaving at 120°C at pressure 15lb/inch2. After Sterilization, the agar medium inoculated with the respective strains of bacteria and was transferred aseptically into each sterile Petri plate. Complete procedure was carried under laminar air flow chamber under aseptic conditions. The plates were left at room temperature to consent for solidification.
Comparison of Zone of Inhibition Cephalexin (Bulk drug) with Cephadex (Commercial sample)
Before performing the one level assay it is necessary to compare the zone of inhibition of bulk drug with commercial sample to ensure that the sample perform the activity or not as shown in figure 2.
Methodology
One Level Assay/Cup-Plate/ Cylinder-Plate
For preparing the standard curve, use a total of 12Petri dishes or plates to accommodate 72 cylinders or cavities.
A set of 3 plates (18 cylinders or cavities) is used for each dilution. On each of the three plates of a set fill alternate cylinders or cavities with solution S3 (representing the median concentration of the standard solution) and each of the remaining 9 cylinders or cavities with one of the other 4 dilutions of the standard solution. Repeat the process for the other 3 dilutions of the standard solution 24 shown in figure 2.
temperature 37˚C and measure the diameters or the zones of inhibition 24 shown in figure 2.
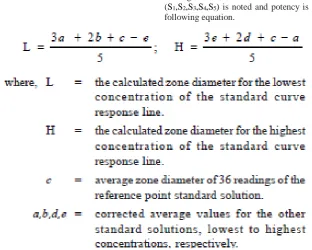
Estimation of Potency
Average the readings of 36 cavities of S3 and the average readings of the 9 cavities of each standard concentration (S1,S2,S3,S4,S5) is noted and potency is calculated by using the
following equation.
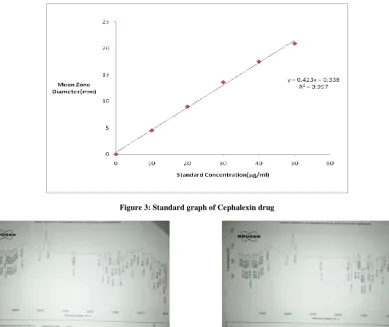
After the potency is determined, standard curve of Cephalexin (Bulk drug) is plotted against concentration on x axis V/s mean zone diameter on y axis shown in the figure 3 and table 1. Finally, the test sample concentration is extra plotted with the standard curve of drug and the mean potency of commercial sample is determined as shown in the table 2.
FTIR Spectroscopy analysis
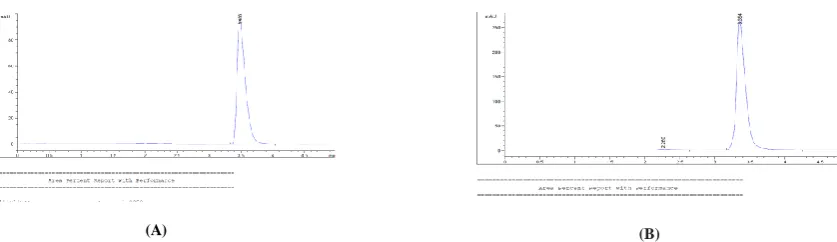
Fourier transform infrared (FTIR) spectroscopy analysis was used to ascertain the presence or absence of Cephalexin in the market tablet sample (Cephadex). Identification of Cephalexin was performed by FTIR spectroscopy using Bruker Opus software (ATR module). The commercial sample (Cephadex) and reference standard spectra were recorded between 4000cm-1 and 400cm-1under the same operational conditions shown in the figure 4 and functional groups are tabulated in table 3.
HPLC Assay
The specificity of the proposed bioassay was compared with HPLC. The HPLC assay was carried out on a system of Agilent Technologies, Series1100, which is composed of a quaternary pump, an autosampler, a photodiode array detector and Chemstation software. The column used was a Cosmosil C18 MS-II.
All solutions were filtered through 0.45 mm membrane filter before injection. The spectrophotometer was set at 254nm.Flow rate was maintained as 1.5 ml/min and the injection volume was10 ml.
Preparation of Standard solution
100mg of drug is dissolved in 100ml of 0.1M HCL26 (PH-1.25) to obtain 1000µg/ml. From the above stock solution 10 ml was taken in 100ml of volumetric flask containing distilled water gives 100 µg/ml.
From these take 1,2,3,4,5ml was taken in 10 ml of volumetric flask and make up with it distilled water gives 10,20,30,40,50 represented as S1,S2,S3,S4 & S5.
Preparation of Sample solution
100mg of Commercial sample is dissolved in 100ml of 0.1M HCL (PH-1.25) to obtain 1000µg/ml. From the above stock solution 10 ml was taken in 100ml of volumetric flask make up with it distilled water gives 100 µg/ml.
From these take 1,2,3,4,5ml was taken in 10 ml of volumetric flask and make up with it distilled water gives 10,20,30,40,50 represented as T1,T2,T3,T4 & T5.
Preparation of Mobile phase
It contains of mixture of 85 volumes of distilled water, 10ml of Phosphate buffer and 5 volumes of methanol 25.
Method Validation 27
Linearity: Five points calibration curve were obtained in a concentration range from 10-50 µg/ml for Cephalexin. The response of the drug was found to be linear in the investigation concentration range and the linear regression equation was Y= 500.4x+226.2 with correlation coefficient 0.999 results are tabulated in Table 4 & Figure 6.
Accuracy: Accuracy of the method is ascertained by standard addition method at 3 levels. Standard quantity equivalent to 10%, 30% and 50% is to be added in sample. The result shown that best recoveries (97.6-99.53%) of the spiked drug were obtained at each added concentration, indicating that the method was accurate and results are tabulated in Table 6.
Robustness: Measure of the capacity of an analytical method to remain unaffected by small intentional variations in the operational parameters and provide an assurance of its reliability during the normal usage. It may be determined by various parameters like ph, flow rate, temperature etc. Robustness studies are performed during the method development stage. Results are tabulated in Table 7.
Sensitivity
Limit of Detection and Quantitation (LOD and LOQ) From the linearity data calculate the limit of detection and quantitation using the following formula.
LOD = 3.3σ / S
σ = Standard deviation of response.
S = Slope of the calibration curve of the analyte.
LOQ = 10σ / S
σ = Standard deviation of response.
S = Slope of the calibration curve of the analyte. The results are tabulated in Table 8
RESULTS AND DISCUSSION
Selection of Significant Microbial Strain
The criteria for selection of significant microbial strain were well- defined edges and large measurable zone diameter under antibiotic treatment. Among all tested strains, Escherichia coli MTCC-443 showed the most significant result at the same conditions. Hence, Escherichia coli MTCC-443 strain was used further for one level (5+1) bioassay study.
Effect of PH on Zone Diameter
The growth rate of microorganisms is highly influenced by buffer PH. The activity of Cephalexin was studied in the range of phosphate buffer PH 6.0–8.0. The phosphate buffer PH 7.0 was selected as the most suitable for significant growth of Escherichia coli MTCC-443 had given sharp zone of inhibition.
Percentage potency calculation
The correction in zone diameter with standard was carried out by taking average zone diameter of the standard mean concentration “S3” separately for each of the standard response line concentrations S1, S2, S4, and S5. Similarly, average zone
diameter of standard response line concentrations (S1, S2, S4, andS5) was taken. All the 36 responses of “S3” were averaged for all the four sets of plates. The average of the 36 responses of “S3” was considered as the correction point of the response line and by putting these values in the standard equation the percentage potency was calculated as 100.2%.
HPLC
The analytical method was developed by studying different parameters. The method was validated for all validation parameters as per ICH guidelines. Linearity was found with the concentration range 10-50 µg/ml and correlation coefficients found to be 0.999 indicate good linearity between concentration and slope area. Beer’s law was obeyed by the fundamental spectrum. This method was found to be simple, sensitive, accurate, precise and economical for routine analysis for the estimation of Cephalexin in Bulk form.
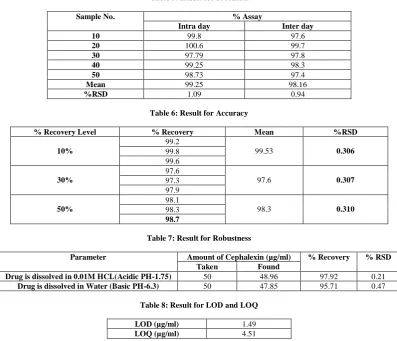
Recovery studies were found to be close 99% indicated the accuracy and precision of the above two proposed methods. Values of LOD and LOQ were found to be 1.49 and 4.51 respectively. The accuracy and robustness was calculated to be 99.5 and 97.9%. The Retention time for the Standard drug (Cephalexin) and Commercial Sample (Cephadex) was found to be 3.35 mins and 3.48 mins. The Chromatograms of Standard drug and Test sample as shown in figure 5.
Identification by FTIR spectroscopy
Spectrum obtained from a commercial sample Cephalexin tablet was compared with reference standard of Cephalexin. The full IR spectrum of the commercial sample Cephadex showed characteristic peaks similar to those of the reference standard of Cephalexin (Figure 4A and B). These peaks are known to be used in the identification of Cephalexin.
Correlation of Microbial Bioassay results and HPLC
Figure 2: One-level agar diffusion bioassay: Five Petri dishes represent the reference solutions S1 (10µg/ml), S2 (20µg/ml), S3 (30µg/ml), S4 (40µg/ml) and S5 (50µg/ml). “T” represents the test sample solution
Figure 3: Standard graph of Cephalexin drug
(A) (B)
(A) (B)
Figure 5: HPLC Chromatograms of Cephalexin. (A) Commercial sample Cephadex (B) Reference standard
Figure 6: Linearity graph
Table 1: Effect of different concentrations of reference standard of Cephalexin on Zone of Inhibition
Standard Concentration (µg/ml) Mean Zone Diameter(mm)
10 4.5
20 9
30 13.6
40 17.5
50 20.9
Table 2: Percentage Potency of Cephalexin in a commercial sample
Test Sample Zone of inhibition(nm) % Potency
1 4.6 100.7
2 8.9 101.2
3 13.4 102.9
4 17.3 100.8
5 20.7 96.2
Mean Potency (%) 100.2
Table 3: Comparison of Functional groups of Cephalexin drug and Commercial Sample (Cephadex)
Functional groups Bulk drug Tablet dosage Carboxylic acid 2880.61 2881.24
Methyl 3061.5 3061.4
Ketone 1757.47 1757.46
Amino 3419.93 3419.60
Phenyl 694.54 694.02
Table 4: Result for Linearity
Concentration((µg/ml) Area under curve
10 5400.8
20 10489.6
30 15009.4
40 20390.2
50 25132.9
Correlation 0.999
Intercept 226.2
Table 5: Result for Precision
Sample No. % Assay
Intra day Inter day
10 99.8 97.6
20 100.6 99.7
30 97.79 97.8
40 99.25 98.3
50 98.73 97.4
Mean 99.25 98.16
%RSD 1.09 0.94
Table 6: Result for Accuracy
% Recovery Level % Recovery Mean %RSD
10%
99.2
99.53 0.306
99.8 99.6
30%
97.6
97.6 0.307
97.3 97.9
50%
98.1
98.3 0.310
98.3
98.7
Table 7: Result for Robustness
Parameter Amount of Cephalexin (µg/ml) % Recovery % RSD Taken Found
Drug is dissolved in 0.01M HCL(Acidic PH-1.75) 50 48.96 97.92 0.21
Drug is dissolved in Water (Basic PH-6.3) 50 47.85 95.71 0.47
Table 8: Result for LOD and LOQ
LOD (µg/ml) 1.49
LOQ (µg/ml) 4.51
Table 9: Percentage potency of Cephalexin in a commercial sample obtained by bioassay and HPLC methods
Sample % Potency
Bioassay HPLC
1 100.7 99.8
2 101.2 100.6
3 102.9 97.79
4 100.8 99.25
5 96.2 98.73
Mean 100.2 99.25
CONCLUSION
A standard validated analytical method is mandatory for the maintenance of quality of pharmaceutical preparations. In the literature, mostly HPLC assay was found for the measurement of Cephalexin concentration in different preparations. However, validated microbial bioassay method for the potency assessment of Cephalexin in pharmaceutical preparation has not yet been reported in any pharmacopoeias. Bioactivity of an antibiotic can be determined only by the microbial bioassay method, which is the main advantage over the HPLC method. Although both bioassay and HPLC methods are complementary to each other, due to the estimation of both potency and bioactivity by bioassay it seems to be the most suitable method. Experimental results show the significance of the proposed bioassay method in estimating the potency and bioactivity of antibiotic by comparing their quantitative effect with a reference standard of defined potency. The optimization of the bioassay was performed using various conditions and Escherichia coli MTCC-443 was selected as the most susceptible organism against
Cephalexin. Several factors were also examined such as buffer pH, inoculums concentration and standard solution concentration. The commercial sample Cephadex tablet was analyzed by the bioassay and the percentage potency was determined as100.90%. The specificity of bioassay was correlated with the HPLC method and the potency was estimated as100.2% and 99.25 %, respectively, which are significantly identical. The obtained results show that both methods are reliable for potency estimation of Cephalexin. Moreover, bioassay is less expensive and is appropriate while investigating drug dynamics and bioactivity.
ACKNOWLEDGMENTS
REFERENCES
1. https://pubchem.ncbi.nlm.nih.gov/compound/Cefalexin. 2. https://pubchem.ncbi.nlm.nih.gov/mesh/68002506.
3. Osol, A. and J.E. Hoover, et al. (eds.). Remington's Pharmaceutical Sciences. 15th ed. Easton, Pennsylvania: Mack Publishing Co., 1975., p. 1119
4. Bothara SS, Kadam KR, Mahadik KG (2006). "Antibiotics". Principles of Medicinal Chemistry. 1 (14th ed.). Pune: Nirali Prakashan. p. 81 5. Fisher JF, Meroueh SO, Mobashery S (Feb 2005). "Bacterial
resistance to beta-lactam antibiotics: compelling opportunism, compelling opportunity". Chemical Reviews. 105 (2): 395–424
6. U.C. Ejikeme, O.J. Ademola, Microbiological assay of the active component of ampicillin in ampicillin and ampicillin/cloxacillin suspensions using Bacillus megatharium NCTC10342A as indicator organism, Afr. J.Microbiol.Res.4(2010)51–54.
7. L.M. Prescott, J.P.Harley, D.A.Klein, Microbiology, seventhed. McGraw-Hill, NewYork, 2008, pp.835–858. 8. J.G. Black, Microbiology: Principles and Explorations,
sixthed. John Wiley&SonsInc., USA, 2005, pp.352–384. 9. W. Hewitt, Microbiological Assay: An Introduction to
Qualitative Principles and Evaluation, first ed., Academic Press, NewYork, 1977, pp.1–50.
10.S.P. Denyer, N.A. Hodges, S.P. Gorman, Hugo & Russell’s Pharmaceutical Microbiology, seventhed., Blackwell Publishing Company, UK, 2004.
11.Alwarthan AA, Fattah SA, Zahran NM. Spectrophotometric determination of Cephalexine in dosage forms with imidazole reagent. Talanta. 1992; 39:703–707.
12.E.C.L. Cazedey, H.R.N. Salgado, Development and validation of a microbiological agar assay for determination of Orbifloxacin in pharmaceutical preparations, Pharmaceutics 3 (2011)572–581.
13.C.H. Yamamoto, T.J.A.Pinto, Rapid determination of neomycin by a microbiological agar diffusion assay using triphenyl tetrazolium chloride, J.Assoc. Anal.Chem.79 (1996)434–440.
14.F.R. Lourenco, T.J.A.Pinto, Comparison of three experimental designs employed in Gentamycin microbiological assay through agar diffusion, Braz.J. Pharm.Sci.45 (2009)559–566.
15.A.F.Zuluaga, M.Agudelo, C.A. Rodriguez, etal. Application of microbiological assay to determine pharmaceutical equivalence of generic intravenous antibiotics, BMC Clin.Pharmacol.(2009).
16.N.A. Dafale, U.P. Semwal, P.K.Agarwal, etal. Quantification of ceftriaxone sodium in pharmaceutical preparations by a new validated microbiological bioassay, Anal. Methods 4 (2012)2490–2498.
17. R.M. Baired, N.A. Hodges, S.P. Denyer, Handbook of Microbiological Quality Control: Pharmaceuticals and Medical Devices, CRC Press, Boca Raton, FL, USA, 2000. 18.Nishant A. Dafale-Development and Validation of
Microbial Bioassay for Quantification of Levofloxacin in Pharmaceutical Preparations-Journal of Pharmaceutical Analysis 2015: (1) : 18-26
19. T.J.A. Pinto, F.R. Lourenco, T.M. Kaneko, Microbiological assay of Gentamycin employing an alternative experimental design. In: AOAC Annual Meeting and Exposition, 121, 2007; Anais. Anahein-California, 2007, p. 157.
20. J.H. Humphrey, J.W. Light bown, A general theory for plate assay of antibiotics with some practical applications, J.Gen.Microbiol.7 (1952) 120–143.
21.K.E. Cooper, A.H. Lindon, Importance of temperature during the early hour of incubation of agar plates in assay, J.Gen.Microbiol.7 (1952) 8–17.
22.Indian Pharmacopoeia, Ghaziabad, India, 2007 volume -1-pg.46.
23.Indian Pharmacopoeia, Ghaziabad, India, 2007-volume -1-pg.37.
24.Indian Pharmacopoeia, Ghaziabad, India, 2007-volume -1-pg.50-51.
25. Indian Pharmacopoeia, Ghaziabad, India, 2007volume 2 -pg.271.
26.Ramachandran*, C.N.Nalini - discriminating dissolution method development and validation for cephalexin-IJPSR
(2011), Vol. 2, Issue 11. 27.ICH Harmonised Tripartite Guidelines, Validation of
Analytical Procedures, Methodology 1996 pg. 8-13.
Cite this article as:
G. Rohit Reddy et al. Development and validation of microbial bioassay for quantification of cephalexin in pharmaceutical preparations. Int. Res. J. Pharm. 2017;8(6):51-58 http://dx.doi.org/10.7897/2230-8407.08696
Source of support: Nil, Conflict of interest: None Declared