FINITE ELEMENT MODELLING AND ANALYSIS OF
INDIAN TECTONIC PLATE
1
Laxman. R.M,
2Arun Kumar. Y.M
1
MTech, Structural Engineering,
2Assistant Professor, Department of Civil engineering,
MIT Manipal, Manipal Karnataka (India)
ABSTRACT
The present study is important for the exploration and recovery of hydrocarbons, allowing for the creation of a predictive framework for fault reactivation and planning of deviated drilling and also provides insights into the mechanisms driving plate motion and intra plate seismicity. In the present work, the finite element modeling and analysis for the tectonic plate of peninsular India is carried out. The tectonic plate will be modeled as a 2D structure and is subdivided into regions based on the geological age of the plate. The thickness of the plate in these subdivided regions varies from 35 km to 55 km. The inter-plate forces introduced by the Australian and Eurasian plates are applied as forces and boundary conditions. In the analysis, displacements, strains and stresses are computed, which gives the information on the direction of the plate motion and the stress orientations to understand the intra plate seismicity.
Finite-element modeling of the Indian peninsular plate shall be carried out using the software package ABAQUS. The images from satellite data shall be digitized according to appropriate scale by using ORIGINLAB software. From these the model shall be created with the help of HYPERMESH. The 2D plane-stress elastic finite element model will be created by considering an appropriate number of elements so that the required spatial resolution of both latitude and longitude is obtained. This model was then analyzed according to appropriate method in ABAQUS.
Keywords: Geodynamics, Tectonic Plate, FEM, Hypermesh®, ABAQUS®
I. INTRODUCTION
Horizontal compressive stress plays a major role in our understanding of the mechanisms driving the plate
motion. It is important in understanding the mechanisms of plate tectonics and intra plate seismicity. The
planning of drilling for oil exploration requires a knowledge of the horizontal compressive stress in the region.
Fault reactivation studies are based on the horizontal compressive stress. This is relevant, in particular to
petroleum resources that occur in structural or structural/stratigraphic (set of strata) traps formed by reactivation
of basin-forming or basement structures.
Although there are many in-situ methods of stress measurement, numerical techniques have gained a lot of
importance. Finite element method is the most common numerical technique that is used for the analysis.
Previously most of the models of Indian tectonic plate were created as homogeneous plates. But due to the
heterogeneous model of the Indian plate has been created and analysed. Assuming elastic rheology, although an
oversimplification, the model was created using the Hypermesh software. The model was created as 2D plane
stress finite element model consisting of 13,018 elements. The heterogeneous model was created with varying
thickness.
II.
MODELLING METHOD
In the modelling of a tectonic plate, for the results to be accurate realistic rheology has to be considered. Since
tectonic plates are made up of different materials with varying thickness at different regions the realistic
modelling of a crustal plate is very complex. Considering the lateral heterogeneities and surface topographical
deformations and also the creation of faults between the plates makes realistic modelling very complex. Also
vertical stress is neglected in the present study.
Therefore the crustal plate analysis in these cases can be performed within elastic limit.
The thickness of the lithosphere and asthenosphere which make up the crust is small compared to the length of
the lithospheric plate i.e., the lithospheric plates are found to be rigid entities coupled with the underlying
asthenosphere in a quasi-viscous manner. This reduces the analysis problem to 2D. Also in 2D analysis
computation time is very much reduced and the storage and complexity of the model and the interconnectivity
of nodes between various regions is also reduced making a 2D model more feasible than the 3D model without
reducing more in terms of the accuracy of results as compared to the 3D model. The ratio of the length to
thickness of the Indian plate was within the limits of the plate analysis of solid mechanics. Therefore the
analysis of the Indian tectonic plate can be considered as a plane stress problem of plate analysis.
2.1 Partitions
The Indian tectonic plate was modelled in Hypermesh® software and the analysis of the model is carried out by
the software ABAQUS®. Previously most of the models of Indian tectonic plate were created as homogeneous
plates. But due to the complex nature of the crust in reality, homogeneous models do not give satisfactory
results when compared with the in situ studies conducted on the crustal plate. Therefore in the present work
heterogeneous model of the Indian plate has been created and analyzed.
The Indian tectonic plate consists of Archaean age cratons and Proterozoic and Phanerozoic sediments [Biswas
1999]. To create the heterogeneous model of the Indian tectonic plate, the crust was divided based on the
Geological age of the various regions of the Indian plate [Deshraj Trivedi et al 2012].
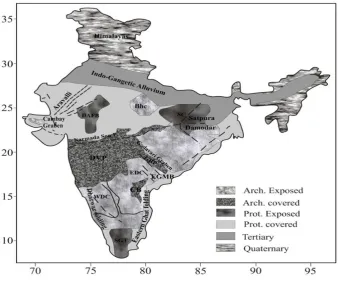
Archean rocks are the oldest stratigraphic regions in the Indian shield. They occur predominantly in the Dharwar
region in the south, Singbhum, Bundelkhand and Bastar cratons. The Eastern Ghat and Aravalli oregons are
believed to have formed in the late Proterozoic age. The Indo Gangetic plains were formed in Quaternary period
due to the erosion of Himalayas. The Deccan traps were formed in the early Tertiary period. Fig. 1. shows the
Indian shield divided into various regions based on the geological age.
The boundary of the Indian tectonic plate as a whole was obtained from a satellite image of the crustal plate.
The satellite image was digitized using software and the boundary was extracted from the obtained data. Fig. 2.
The data extracted from these images was then imported into the HYPERMESH® software for modelling of
heterogeneous Indian tectonic plate. The data, which was in terms of nodes in Hypermesh®, was used to create
the finite element models of Indian tectonic plate as a whole and the Indian shield with different rheology
separately. These digitized images were modelled separately and then they were merged to form a single
heterogeneous plate. Numerical modeling has been carried out by finite element analysis as a plane stress
problem. The numerical model comprises of triangular and quadrilateral shell elements.
Fig. 1. Indian Shield Divided into Various Regions Based on Age
Fig. 2. Satellite Image of Indian Tectonic Plate
The total number of nodes in the model is 12,567. The total number of elements is 13,018. They were analyzed
less than 4% so that the curvature of the Earth’s surface is neglected. For greater accuracy, all elements were
created to have a minimum Jacobian of 0.7. In the present study we are dealing with the elastic behavior of the
structure and it is mainly controlled by the isotropic Poisson’s coefficient , Young’s modulus E and elastic
thickness h. The value of Poisson’s coefficient for all the regions is 0.3 and that of Young’s modulus is varying
according to different regions of the tectonic plate. For the oceanic lithosphere, of the Indian tectonic plate the
thickness was taken as 40km. Thickness values different parts of the Indian shield are as shown in Table 1.The
value of Young’s modulus, E was taken as 70 GPa.
Table 1 – Value of material properties and age of different regions of heterogeneousmodel
2.2. Load Definition and boundary condition
In the case of the contemporaneous Indian Plate the dominant plate driving forces are the ridge push, slab pull
and collisional forces originating at collision zones of the Indian plate. The ridge push force (FRP) arises due to
elevated topography at mid-ocean ridges (MOR), and is a distributed pressure gradient that acts normal to the
strike of the mid-ocean ridge. The force contribution from the subsiding oceanic lithosphere created at the MOR
is given by the relationship
where gravity ( ) is 10m/s2, the densities of the mantle ( ) and water ( )are 3300Kg/m3and 1000Kg/m3
respectively, thermal diffusivity (K) is 1mm2/s, the temperature difference between the mantle and the surface
(Tm and T0 respectively) is 1200K, the thermal expansion coefficient ( ) is 3x10⁻⁵/K and t is the age of the
lithosphere in seconds.
The ridge push force was implemented in the modelling process as a pressure applied along a boundary
representing the location where maximum ridge push force would be there. For example, if the ridge push force
The magnitude of the force is applied to the Indian plate is 1.0X10¹⁷ GPa. It is applied at the Mid Oceanic ridge, the boundary between Indian and Australian tectonic plates.
The place of collision between Indian tectonic plate and Eurasian plate has been found to be the most
appropriate place to be considered as fixed boundary to maintain the mechanical equilibrium condition.
III. RESULTS AND DISCUSSION
The static analysis performed gave the displacement results. Also the principal stresses were obtained.
The results according to the numerical analysis performed were quite closer to the measured data since the
model was heterogeneous thus replicating the real conditions as closely as possible.
Indian tectonic plate was found to move in the N-E direction. The results obtained have been shown below.
Fig. 3. Displacement Plot for Heterogeneous Model of Indian Tectonic Plate
Fig. 5. Max Horizontal Compressive Stress
IV. CONCLUSION
The geometry of the Indian plate was constructed by taking the satellite images as reference. In the first phase, a
uniform material and plate thickness distribution was assumed for the plate. Appropriate boundary condition in
the form of fixed condition at the Himalayas was applied. Inter-plate forces, imposed by the Australian tectonic
plate onto the Indian plate at the mid-oceanic ridge was applied. The displacement and its orientation were then
computed by performing static analysis in ABAQUS. In the second phase, thickness variation in the peninsular
India was considered for updating the finite element model. Five regions on the Indian plate based on the age of
the plate in these regions were identified and appropriate thicknesses were assigned with the data available in
the literature. The static analysis with the same set of boundary conditions and inter-plate forces was carried out.
Displacement and their orientation has been computed and the orientation has shown to agree well with the
measured data from the recording stations that are distributed at different locations in Peninsular India.
The material distributions have been applied to the model as given in literature. Therefore with more accurate
rheology values the model can give more realistic results. The force applied on the Indian tectonic plate was
considered only at the mid oceanic ridge and considered forces are exerted by the Australian plate. For further
work, various plate driving forces at different boundaries of the Indian plate can be taken into account.
Further, a 3D model of the Indian plate can be created to account for the material distribution in the vertical
direction and thermodynamic analysis can also be considered to account for mantle convection.
REFERENCES
1. Dyksterhuis, S., Albert, R., & Müller, R. (n.d.). Finite-element modelling of contemporary and
paleo-intraplate stress using ABAQUS®™. Computers & Geosciences, 31, 297-307. doi:10.1016
2. Trivedi, D., Singh, Y., Maji, T., Kandpal, S., & Nair, R. (2012). A new assessment of the elastic thickness
3. Rajesh, R., & Mishra, D. (2004). Lithospheric thickness and mechanical strength of the Indian shield. Earth
and Planetary Science Letters, 225, 319-328. doi:10.1016
4. Watts, A., & Burov, E. (2003). Lithospheric strength and its relationship to the elastic and seismogenic
layer thickness. Earth and Planetary Science Letters, 213, 113-131. doi:10.1016
5. Manglik, A. (2015). Thermo-mechanical structure of the Indian continental lithosphere. Journal of Indian
Geophysics Union, 19(3), 243-255.
6. Stephen, J., & Singh, S. (2003). Elastic thickness and isostatic coherence anisotropy in the South Indian
Peninsular Shield and its implications. Geophys. Res. Lett. Geophysical Research Letters, 30(16),
1853-1853. doi:10.1029
7. Kumar, P., Yuan, X., Kumar, M., Kind, R., Li, X., & Chadha, R. (2007). The rapid drift of the Indian
tectonic plate. Nature, 449, 894-897. doi:10.1038
8. Reddy, P., & Rao, V. (2000). Structure and tectonics of the Indian peninsular shield- Evidences from