398 | P a g e
EXPLORATION OF THE STRESS CONCENTRATION
IN METALLIC PLATES WITH EXTRAORDINARY
CUTOUT AND BLUNTNESS
Shabana M. Sayyad
1, Jagdish S. Shitole
2 1Dept.of Mechanical Engineering, DGOI FOE, Swami Chincholi (Bhigwan), Maharashtra,India
2
Asst. Professors Dept. of Mechanical Engineering
DGOI FOE Swami Chincholi (Bhigwan), Maharashtra (India)
ABSTRACT
Stress concentration factor is the significant parameter in the design of the any structural component. The structural elements, panels and pressure vessel shells contain different types of cut-outs or openings for its functional requirements. Generally failure of mechanical component occurs due to high stress concentration. Stress concentration is high near to the discontinuities in continuum, abrupt changes in cross section and due to contact stresses. In this study a rectangular plate is taken with square and triangular cut-outs for experimentation. The Stress exploration near these openings is indispensable; generally the stress concentration is extreme near the cut-outs. The main objective of this study is to demonstrate the accuracy and simplicity of presented analytical solution for stress analysis of plates with central cut-out. The varying parameters, such as cut-out shape and bluntness, load direction or cut-out orientations, which affect the stress distributions and SCF in the perforated plates, are considered. The results presented herein indicated that the stress concentration factor of perforated plates can be significantly changed by using proper cut-out shape, bluntness and orientation. In these paper efforts have been taken for scrutinizing the stress concentration by using FEA method, the ANSYS 14.5 is used for the experimentation and Experimental electrical strain gauge method is used for validation.
Keywords : Bluntness, Different cut-outs, FEA, Orientation, SCF etc…
I. INTRODUCTION
Openings/cut-outs are made into structures in order to satisfy some service requirements, results in strength
degradation. In practice different shape of holes are used for different applications for example manhole of any
pressure vessel is either circular or elliptical while the window or door of an airplane is square hole having
chamfer of some radius at corners. Plates and shells of various constructions find wide uses as crucial structural
elements in aerospace, mechanical and civil engineering structures. In recent years, the increasing need for
lightweight efficient structures has led to structural shape optimization. Different cut-out shapes in structural
elements are needed to reduce the weight of the system and provide access to other parts of the structure. It is well
known that the presence of a cut-out or fleabag in a stressed member creates highly localized stresses at the
vicinity of the cut-out. The ratio of the maximum stress at the cut-out edge to the nominal stress is called the
399 | P a g e
stress concentration and magnitude of localized stresses, a dimensionless factor called Stress ConcentrationFactor (SCF), Kt is used
Kt = (1)
Where, σ max is maximum stress at the discontinuity and σ nom is nominal stress.
Stress analysis of the critical elements under various loading conditions is carried out by the researchers for safe
design of the element. Stress is measured by experimental methods or analytical/numerical method. In this
research Finite Element Method is used for stress analysis, the structural model to be analyzed is divided into
many small pieces of simple shapes called elements. Finite Element Analysis (FEA) program writes the
equations governing the behavior of each element taking into consideration its connectivity to other elements
through nodes. These equations relate the unknowns, for example displacements in stress analysis, to known
material properties, restraints and loads. The program assembles the equations into a large set of simultaneous
algebraic equations - thousands or even millions. These equations are then solved by the program to obtain the
stress distribution for the entire model.
II. FINITE ELEMENT MODEL
Finite element analyses are conducted for the stress concentration analyses of Structural Steel plates. The plates
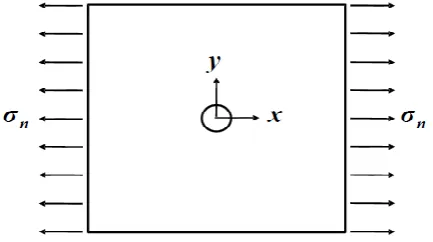
have dimensions 200 mm (x-direction), 200 mm (y-direction), and 5mm (z-direction) as shown in Fig. 1. Material
properties are shown in Table 1 and the location of cutout is at the centre of the plates. To clearly observe the
concentration effect, the plate size is modeled as rather large for the cutout size. ANSYS, a general purpose finite
element program, is used. To investigate stress concentration in an elastic range, the plates are modeled as a linear
elastic material. The loading condition is a uni-axial tensile force at the left and right sides as shown in Fig. 1. In
this study, to limit the Maximum stress to the elastic range, 20 MPa is loaded as the tensile loading condition.
Fig.1. Loading condition of uniaxial tensile force
Table 1. Material properties of aluminumalloy
Young‟s modulus (GPa) 71.0
Poisson ratio 0.33
Tensile yield strength (MPa) 280
400 | P a g e
III. CUT-OUT SHAPES, ORIENTATION AND BLUNTNESS
We consider the two shapes of cutout like square and triangular as shown in Fig. 2 and Fig. 3 The rotation angle
ϕ represents how the cut-outs are oriented from the baseline (x axis). As shown in the Fig. 2 and 3
Fig.2. Rotation of square cutout
Fig.3. Rotation of triangular cutout
Figs.4 and 5show a number of parts of the rotated cutouts for each case. The angle of increment 15° is applied
for both the cutouts; hence, a total of seven cases are considered (0°, 15°, 30°, 45°, 60°, 75° and 90°) for the
square cutouts, and for triangular cutouts, a total of five cases are considered (0°, 15°, 30°, 45° and 60°) [3, 4]
ϕ
=0˚
ϕ
=15˚
ϕ
=30˚
ϕ
=45˚
ϕ
=60˚
ϕ
=75˚
ϕ
=90˚
Fig.4. Rotated cut-outs for square
ϕ =0˚ ϕ =15˚ ϕ =30˚ ϕ =45˚ϕ =60˚
401 | P a g e
the radius ratio increases. For an extreme example, a circular cut-out has a unit radius ratio but it has zerobluntness. In other words, the degree of bluntness decreases as r/R increases. Here, again, we emphasize that the
term „bluntness‟ is used to describe that the edges of polygons are blunt. We consider a total of seven different
degrees of bluntness, including 0.1, 0.25, 0.3, 0.5, 0.7, 0.9 and 1.0 for the cut-outs.
Fig.6. Radius ratio r/R (w)
IV. RESULTS
By considering the design variables or factors like cutout shape, the degree of bluntness, and cutout rotation we
obtained the stress concentration pattern, the maximum von-Mises stress, and the stress concentration factor.
These results are as shown in the following sections.
4.1 Cutout shapes and bluntness
As mentioned previously, there are three different cutout shapes circle, square, and triangle. In addition, for
considering bluntness (a counter measure of r/R), a total of seven radius ratios are considered: r/R = 0.1, 0.25,
0.3, 0.5, 0.75, 0.9 and 1.0 respectively. This section discusses the variation of stress concentration with respect
to the cutout shapes and bluntness. All of the other factors remain the same, for example the uni-axial tensile
forces are fixed at 1 MPa. Table II shows the maximum von-Mises stress and stress concentration factor. It
should be noted here that the zero bluntness (r/R = 1) actually means that the cutout shape is a circle; hence,
from the table, we can see how the shapes and the degrees of bluntness vary the Maximum von-Mises stress and
stress concentration factor. Fig.7.shows how the stress concentration factor (SCF) varies with respect to cutout
shapes and the radius ratio (a counter measure of degree of bluntness).
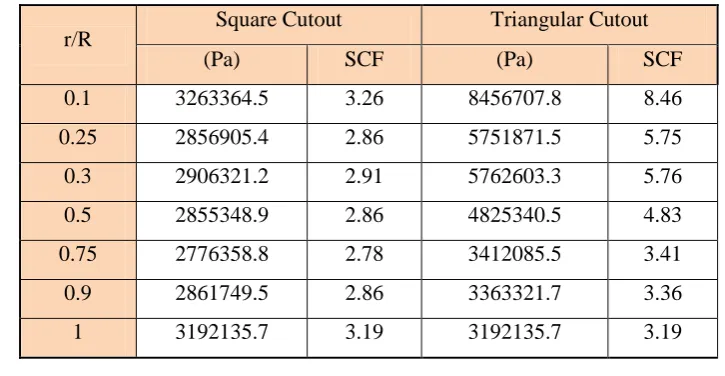
Table 2. Maximum Von-mises Stress and Stress Concentration Factor with Respect to Bluntness.
r/R
Square Cutout
Triangular Cutout
(Pa)
SCF
(Pa)
SCF
0.1
3263364.5
3.26
8456707.8
8.46
0.25
2856905.4
2.86
5751871.5
5.75
0.3
2906321.2
2.91
5762603.3
5.76
0.5
2855348.9
2.86
4825340.5
4.83
0.75
2776358.8
2.78
3412085.5
3.41
0.9
2861749.5
2.86
3363321.7
3.36
402 | P a g e
Fig.7. SCF with Respect to Radius ratio (r/R) WIn the case of the circular cutout, the maximum stress is 3192135.7 Pa and the stress concentration factor is 3.19.
According to previous studies, the maximum stress is about three times the tensile force. Since our tensile force
is 1MPa, the magnitude of 3.19MPa exactly concurs with the previous observation. As showing Table II, the
maximum von-Mises stresses and accordingly stress concentration factors change, depending on the cutout
shapes and bluntness In the case of the square cutout, It is interesting to note that: (a) the SCFfor r/R = 0.1is
larger than that of r/R = 1.0 which is the circular cut-out case, and for w = 0.25, 0.3, 0.5, 0.75 and 0.9the SCF
value is less than that for circular cutout(b) the maximum stress (8456707.8 Pa) occurs in the case of r/R = 0.1.
And it decreases as r/R ratio increases. In the case of the triangular cutout, it is interesting to note that the
maximum stress is the eight times the applied tensile force and it decreases as r/R ratio increases.To visualize
the stress patterns, two stress contours are shown in Figs. 8 and 9. Fig. 8 shows the stress contour in the case of
the square cutout with r/R = 0.1. The circle on the contour indicates the area having the maximumvon-Mises
stress. In addition, the topandbottomballoon shapes represent the areas under 576890Pa.
403 | P a g e
Fig.9. Stress Contour of Plate with Triangular Cutout (r/R = 0.1)Fig. 9shows the stresscontour in the case ofthe triangle cutout with r/R = 0.1. The circle on the contour shows
the area having the maximum von-Mises stress. Similarly, the topand bottomballoon shapes represent the area
under 957790 Pa. It is interesting tonote that stress concentration occurs inthe broad range of the leftand
rightsides in the case of the square cutout while stress concentration occurs in the narrow range of the leftand
right edges in the case of the triangle cutout. From the observation, we can conclude that the bluntness effect on
the stress concentration patterns is also dependent on cutout shapes.
4.2 Rotation of Cut-outs
This section discusses the stress analysis results by considering the rotation of the cutouts. In thecases of the
square cutout, sevenrotation angles areconsidered, 0°, 15°, 30°, 45°, 60°, 75° and 90°,while fiveangles,0°, 15°,
30°, 45° and 60°, are considered in the case ofthe triangle cutout.
Table 3 and 4showsthe maximum von-Mises stresses and stress concentration factors for theplates with square
cut-outs,which have the seven rotations. As a result, we can see that manydifferences occur in the maximum
stresses, depending on the rotation angle.However, forall of the cases consistently, the stresses increase as the
rotation angles increaseup to 45˚ and then decreases from it because for the square we can rotate it up to 45˚
after it the same side. By combining the rotation effect with the bluntness effect, the maximum stress
(7.3752MPa) occurs in the case of the r/R = 0.1 (maximum bluntness) and the rotation of 45° (maximum rotation).
Table 3. Maximum Von-mises Stress of Square Cutouts with Rotation angle.
0˚
15˚
30˚
45˚
60˚
75˚
90˚
(MPa)
(MPa)
(MPa)
(MPa)
(MPa)
(MPa)
(MPa)
0.1
3.2634
4.9543
6.6515
7.3752
6.5088
4.8796
3.2930
0.25
2.8569
4.0193
5.1117
5.8264
5.1168
3.9069
2.9496
0.3
2.9063
3.7784
5.0593
5.2981
5.0869
3.8425
2.8790
0.5
2.8553
3.3234
4.3766
4.7431
4.3627
3.1947
2.7881
0.75
2.7764
2.9288
3.5715
3.7699
3.5037
2.9444
2.7808
0.9
2.8617
3.1302
3.4767
3.2149
3.3984
3.0732
2.8810
1
3.1921
3.1921
3.1921
3.1921
3.1921
3.1921
3.1921
404 | P a g e
Table 4. SCFof Square Cutouts with Rotation angle.0˚
15˚
30˚
45˚
60˚
75˚
90˚
SCF
SCF
SCF
SCF
SCF
SCF
SCF
0.1
3.26
4.95
6.65
7.38
6.51
4.88
3.29
0.25
2.86
4.02
5.11
5.83
5.12
3.91
2.95
0.3
2.91
3.78
5.06
5.30
5.09
3.84
2.88
0.5
2.86
3.32
4.38
4.74
4.36
3.19
2.79
0.75
2.78
2.93
3.57
3.77
3.50
2.94
2.78
0.9
2.86
3.13
3.48
3.21
3.40
3.07
2.88
1
3.19
3.19
3.19
3.19
3.19
3.19
3.19
r/R
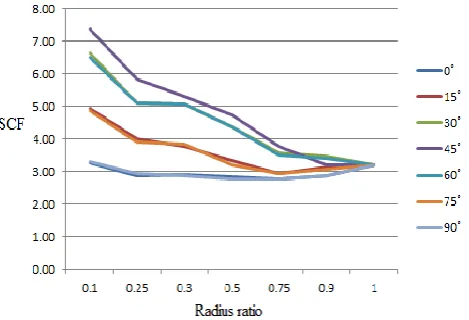
Fig.10.shows the graph of SCF vs Radius ratio with respect to rotation of square cutouts. From the graph it is
observed that the as the radius ratio increases the stress concentration factor SCF decreases up to a certain value
(nearly equal to 3) for all angular rotation, that is if radius ratio is 1.0 that means it is a circle and we know for
circular hole the SCF is 3. Fig.11. shows the maximum stress contour for square cutout when (r/R = 0.1, ϕ =
45°), red coloured markindicates the region of maximum stress concentration.
Fig.10. SCF with Respect to Rotation of Square Cutouts
405 | P a g e
triangularcut-outs,which have the five rotations. As a result, we can see that many differences occur in themaximum stresses, depending on the rotation angle.However, forall of the cases consistently, the stresses
increase as the rotation angles increase up to 30˚ and then decreases from it because for the triangle we can rotate it up to 30˚ after it the same side. By combining the rotation effect with the bluntness effect, the maximum
stress (176.8 MPa) occurs in the case of the r/R = 0.1 (maximum bluntness) and the rotation of 30° (maximum rotation).
Table 5. Maximum Von-mises Stress of Triangular Cutouts with Rotation angle.
0˚
15˚
30˚
45˚
60˚
(MPa)
(MPa)
(MPa)
(MPa)
(MPa)
0.1
8.4567
7.6974
6.0225
7.4838
7.9664
0.25
5.7519
5.6075
4.6234
5.4068
6.2169
0.3
5.7626
5.5658
4.4594
5.3104
5.7788
0.5
4.8253
4.2521
3.5780
4.5976
4.9241
0.75
3.4121
4.1657
3.7660
3.8144
3.3555
0.9
3.3633
3.0973
3.4965
3.1174
3.4054
1
3.1921
3.1921
3.1921
3.1921
3.1921
r/R
Table 6. SCFof Triangular Cutouts with Rotation angle.
0˚
15˚
30˚
45˚
60˚
SCF
SCF
SCF
SCF
SCF
0.1
8.46
7.70
6.02
7.48
7.97
0.25
5.75
5.61
4.62
5.41
6.22
0.3
5.76
5.57
4.46
5.31
5.78
0.5
4.83
4.25
3.58
4.60
4.92
0.75
3.41
4.17
3.77
3.81
3.36
0.9
3.36
3.10
3.50
3.12
3.41
1
3.19
3.19
3.19
3.19
3.19
r/R
Fig.12. shows the graph of SCF vs Radius ratio with respect to rotation of triangular cutouts. From the graph it
is observed that the as the radius ratio increases the stress concentration factor SCF decreases up to a certain
value (nearly equal to 3) for all angular rotation, that is if radius ratio is 1.0 that means it is a circle and we
know for circular hole the SCF is 3. Fig.13. shows the maximum stress contour for triangular cutout when (r/R =
406 | P a g e
Fig.12. SCF with Respect to Rotation of Triangular cutoutsFig.13. Stress Contour for Triangular Cutout (r/R=0.1, θ=0°)
V. CONCLUSIONS
From above experimentation it is cleared that for square cutout the maximum stress is occurred when its
orientation is at 45˚ that means any two opposite sides of square are inclined at 45˚ to the direction of applied
force. If we increase the radius ratio then the stress concentration factor decreases up to value nearly equal to 3,
for triangular cutout the maximum stress is occurred when its orientation is at 0˚, that is one side of triangle
e is parallel to applied force, If we increases the radius ratio then the stress concentration factor decreases up to
value nearly equal to 3. If we combining the effect of bluntness with angle of rotation then we get different
combination of stress values for different values of bluntness and orientation.
VI. ACKNOWLEDGMENT
The satisfaction and exhilaration that accompany the successful completion of any task would be incomplete
without the mention of the people whose constant guidance and encouragement aided in its completion. The
authors would like to express the voice of gratitude and respect to all who had directly or indirectly supported
407 | P a g e
REFERENCES
[1] P.S. Theocaris, L. Petrou, “Stress distributions and intensities at corners of equilateral triangular holes”,
International Journal of Fracture, 31 (1986), pp. 271–289.
[2] E.S. Folias, J.J. Wang, “On the 3-dimensionl stress field around a circular holes in a plate of
arbitrary thickness”, Computational Mechanics, 6 (3) (1990), pp. 379–391
[3] D.S. Um, S.W. Kang, J.H. Park, and W.I. Ha, “A Study on the Stress Concentration Factor and
Fatigue Strength for T-Tubular Joins by FEM”, J. of Ocean Engineering and Technology, 8 (2) (1994)
141-150
[4] W.J. Sim and S.H. Lee, “Numerical Analysis of Dynamic Stress Concentration in Axisymmetric
Problems”, J. of Korean Society of Mechanical Engineers, A26 (11) (2002) 2364-2373
[5] A.V.Singh, U.K. Paul, “Finite displacement static analysis of thin plate with an opening- a variational
approach”, International Journal of Solids and Structures, 40 (2003), pp. 4135–4151.
[6] Jianlin Wang, Steven L. Crouch, Sofia G. Mogilevskaya, “A complex boundary integral method for
multiple circular holes in an infinite plane”, Journal of Engineering Analysis with Boundary Elements,
Vol. 27, pp. 789-802, (2003).
[7] J. Rezaeepazhand, and M. Jafari, “Stress analysis of perforated composite plates”, Composite Structures,
71 (3-4) (2005) 463-468.
[8] V. G. Ukadgaonker, Vyasraj Kakhandki, “Stress analysis for an orthotropic plate with an irregular
shaped hole for different in-plane loading conditions-Part 1”, Journal of Composite Structures, Vol. 70,
pp. 255-274, (2005).
[9] J.H. Won, J.H. Choi, J.H. Gang, D.W. An, and G.J. Yoon, “Local shape optimization of notches in
airframe for fatigue-life extension”, Journal of Korean Society of Mechanical Engineers, A32 (12) (2008)
1132-1139.
[10]D. K. N. Rao, M. Ramesh Babu, K. Raja Narender Reddy, D. Sunil, “Stress around square and rectangular