International Journal of Integrated Engineering, Vol. 10 No. 8 (2018) p. 164-174
© Penerbit UTHMDOI: https://doi.org/10.30880/ijie.2018.10.08.026
*Corresponding author: djamal@uthm.edu.my
2018 UTHM Publisher. All right reserved. penerbit.uthm.edu.my/ojs/index.php/ijie
164
Wind and Solar Assessment in the Sahelian Zone of Chad
Abdelhamid Issa Hassane
1, Djamal Hissein Didane
2*, Abakar Mahamat Tahir
3,
Jean-Marie Hauglustaine
41Department of Petroleum Management and Economics, Higher National Institute of Petroleum of Mao, 4377 Mao,
Kanem, Chad
2Department of Energy and Thermofluid Engineering, Faculty of Mechanical and Manufacturing Engineering, Universiti
Tun Hussein Onn Malaysia (UTHM) 86400 Parit Raja, Batu Pahat, Johor, Malaysia
3Faculty of Exact and Applied Science, University of N'Djamena 1027, N'Djamena, Chad
4Research unit Energy SuD (Energy and Sustainable Development), University of Liège, Longwy Avenue 185,6700,
Arlon, Belgium
Received 28 May 2018; accepted 7 October 2018, available online 30 December 2018
1. Introduction
Renewable energy sources such as wind and solar have long been renowned as potential sources of free, clean and inexhaustible energy that could play an important role in contributing towards energy demands in the coming years, particularly where a small amount of energy is needed such as the rural areas or small individual households [1], [2], [3]. It is, however, perceived that the sources of energy in many third world countries including Chad are still exploited from non-renewable and depleting sources such as fossil fuels and biomass, although recent evidence suggests that alternative energy sources in these countries appear to be abundant [4],[5]. Thus, discovering and establishing the potentials of these sensible renewable sources are vital. Moreover, the fact that Chad’s population are scattered with the vast majority living in rural areas, complicated the government’s effort to provide electrified grid system throughout the country. As a result, the electrical grid system is only available in big towns [6]. Therefore, a renewable energy conversion system such as a wind turbine or solar panels might be the most viable option or a more reasonable approach for such situations [7].
While the development and adaptation of renewable energy sources are widely undertaken and fully established globally, in Chad, however, up to now, there is only a little, published data on the assessment or feasibility study on renewable energy resources. They are now starting to take a turn in the last couple of years. Currently, assessment of wind and solar resources have emerged and begins to see the light. Far too little attention has been paid to other forms of renewable resources. This partly due to lack of political will, limited skills and public awareness pertaining to the impact of renewable resources on the ground. Thus, they are still unexploited and underutilized in both industrial and household scales.
Recently, Didane et al. [6] studied broadly the potential of wind energy in Chad while covering thirteen meteorological stations from the three main zones in the country which are the Sahara desert, the Sahel and the Sudanian zone. It was found that the potential of wind energy in Chad is promising with the Sahel and the Sahara zones seem to show the highest potentials of wind energy harvesting in the country. Soulouknga et al. [8] also carried wind assessment in the Sudanian zone in Chad. It is, however, indicated that in this zone, wind energy could be regarded as a potential alternative only at 67 m height above the ground for electricity generation, heating and
Abstract: Renewable energy sources have long been renowned as potential sources of free, clean and inexhaustible
energy. However, energy in Chad is still exploited from non-renewable sources due to lack of comprehensive wind and solar maps, skills and public awareness pertaining to its significance in the country. This study is therefore set out to provide assessments of both wind and solar energies in the Sahelian zone in Chad, using the statistical two-parameter Weibull distribution function and Angstrom-Prescott model, respectively for a ten-year period. The evaluation of wind potential shows that the annual mean of the shape and scale parameters for all stations under study varied in the range of 1.26 – 1.56 and 2.49 m/s – 3.91 m/s, respectively. Stronger wind speed was observed during the dry season and a relatively slower wind speed was perceived during the wet season. Among the four stations, N’Djamena showed the highest power density compared to the other three stations with a mean power density that ranges between 100 W/m2 – 220 W/m2. The prediction of solar potential in this region indicates that the global solar
radiation for all stations is promising with station Abeche however, to show the highest solar energy density on average. A good agreement between Angstrom model and NASA data was also observed.
165
pumping water. In terms of solar energy, Soulouknga et al.[9] revealed that the Sahel zone has an encouraging potential for solar energy harvesting. However, previously published studies are either limited to one region in the case of solar assessment or failed to explore extensively with regard to a higher altitude in the case of wind energy assessment. It is recognized that this study is important for transitioning Chad’s energy infrastructure to renewable energy. Therefore, it is hoped that the findings should make an important contribution by providing and outlining the untapped wind and solar energy resources in the Sahelian zone in Chad which may likely reassure interested parties that the future of these energies in this region is promising.
2.
The Sahel Zone in Chad
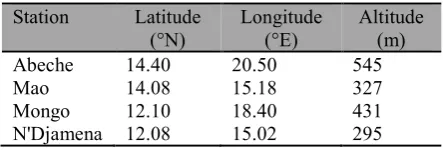
The Sahel or Sahelian zone in Chad which is largely a semi-desert country is semiarid zone located in the middle of the country between the dry Sahara desert in the north and Sudanian tropical zone in the south. It creates an about 500 kilometers wide belt that stretches from the western border with Niger and Nigeria to the eastern border with Sudan as shown in Fig. 1. The main cities that have been covered in this study as shown in Fig. 1, are Abeche, Mao, Mongo and N’Djamena. The Geographic coordinates of these stations are given in Table 1. The raining or wet season in this zone starts as early as June to September and a dry season from October to May. The Sahel zone is studied in particular due to its variety and presence of a large number of population beside the huge untapped potential of wind and solar. The cities selected for study are the main cities with highest population density in the Sahelian zone.
Fig. 1 Sahel zone in Chad.
Table 1: Geographic coordinates of four synoptic stations.
Station Latitude (°N)
Longitude (°E)
Altitude (m)
Abeche 14.40 20.50 545
Mao 14.08 15.18 327
Mongo 12.10 18.40 431
N'Djamena 12.08 15.02 295
3.
Theoretical formulation for wind energy
3.1
Extrapolation of Wind Data
The meteorological wind data are collected from the National Meteorological General Administration at N’Djamena airport in Chad for a ten-year period. They were recorded in a monthly-average form at the standard height of 10 m. The measured data vary from one station to another due to lack of consistent wind data record. Thus, the data used were recorded between the year 1970 and 2013. Given that the wind speed at a site varies with altitude, which is also known as wind shear, the raw meteorological data needs to be extrapolated to the required heights when the annual energy production (AEP) of a site is being assessed. That is owed to the fact that the meteorological data are typically measured at the standard height of 10 m. However, the usual height of a wind turbine hub is usually beyond 10 m, which makes such analysis imperative in order to achieve a reliable estimation of the particular site’s potentials. Furthermore, Al-Mohamad & Karmeh [10] also indicated that the Weibull parameters are deemed accurate at higher wind speeds which is available at higher altitude. Hence, the wind profile power law as given in Equation 1 is commonly used to measure the wind speed at the desired heights.
1 2 1 2
Z
Z
V
V
(1)
where V1 and V2 are respectively the actual wind speed at
height Z1 and the required wind speed at the height Z2. The
exponent, ∝ is a coefficient that depends on the stability of the atmospheric condition (surface roughness). A value of approximately 0.143 is usually used for well-exposed, low surface roughness or neutral stable sites [11]. In the present study, a constant value of 0.143 is used throughout the assessment analysis.
3.2
Weibull Distribution Function
D.H Didane et al., Int. J. of Integrated Engineering Vol. 10 No. 8 (2018) p. 164-174
166
0
,
0
,
1
,
exp
1
c
v
k
c
v
c
v
c
k
v
f
k k(2)
k c ve
v
F
1
(3)
where c and k are the Weibull scale parameter and the dimensionless shape parameter, respectively. They are given as follows:
5 . 0
83
.
0
V
k
(4)
k
V
c
1
1
(m/s) (5)
where and and Γ are respectively, average wind speed and gamma function. The average wind speed is calculated using the following equation:
ni
v
in
V
1
(m/s) (6)3.3
Wind Power and Energy Density
The wind power density based on Weibull distribution and the wind energy density for the desired time, T are predicted using Equation 7 and Equation 8, respectively.
k
k
c
A
P
1
2
1
30
(7)
T
k
k
c
A
E
3
2
1
3(8)
where the air density, is 1.225 kg/m3 at sea level with a
mean temperature of 15˚C and 1 atmospheric pressure.
4.
Theoretical formulation for solar energy
For a country like Chad that does not have meteorological stations equipped with a Pyranometer to measure sunshine, the evaluation of solar potential must be made by empirical models such as that of Angstrom to overcome this insufficiency. The results obtained can be validated by comparing them with those provided by international databases such as those of NASA [17]. Several solar potential assessment studies have been carried out in some sub-Saharan countries such as Nigeria [18],[19],[20],[21], Burkina Faso [22] and Ghana [23]. In order to evaluate the solar energy potential of Chad, a
series of meteorological data (sunshine duration, average temperatures, maximum temperatures, relative humidity, etc.) were collected from four regional synoptic stations in the Sahelian zone (Abeche, Mao, Mongo and N'Djamena) for a duration of 10 years.
4.1
Global solar radiation
In general, on a horizontal plan, the relation of Klein [24] defines the solar radiation (H0) outside the atmosphere
as:
sin
sin
360
2
sin
cos
cos
365
360
cos
33
.
0
1
24
0L
L
D
I
H
s s n sc (9) where:Isc: a solar constant which equals 1367 W/m2
Dn: number of days of the year
L: latitude of the site in degrees
δ and ωs are respectively the solar declination angle
and the angle of the sunset hour angle that are calculated by the following relationships [25]:
365
284
360
sin
45
.
23
D
n
(10)
s
cos
1
tan
L
tan
(11)From H0, there are several models for estimating
global solar radiation (H) according to the climatic parameters of the site such as the duration of sunshine, the maximum and minimum temperature, the relative humidity, etc. [17]. Three models are typically used to estimate global solar radiation on a horizontal plane: the Angstrom-Prescott model, the Allen model and the Sabbagh model.
4.2
Estimation of global solar radiation by
Angstrom-Prescott model
The first pioneer on solar radiation modelling was Angstrom (1924). Using sunshine data collected from the meteorological stations of a site, he developed a linear model for estimating the ratio of solar radiation (S/S0),
where S0 is the maximum of the average monthly duration
sunshine on the site and S is the average daily sunshine duration [25].
This model was then improved by Prescott in 1940 and Page in 1961 by taking into account the mean global radiation on a horizontal surface H and the duration of sunshine in a relation stated as follows [26]:
167
where:
0
323
.
0
cos
235
.
0
110
.
0
s
s
L
a
(13)
0
694
.
0
cos
533
.
0
449
.
1
s
s
L
b
(14)
cos
tan
tan
24
10
L
s
(15)5.
Results and discussion
The results are presented in two distinct parts in order to give the reader a sense of continuity and clarity. The first part comprises the assessment/analysis of wind data, while the second part embodies the assessment of solar potentials in Sahel region. The evaluation of the wind resources in each site was investigated at four different heights including 10 m, 30 m, 50 m and 100 m. This is done in an effort to highlight the zones with the most favorable potentials for wind energy exploitation.
5.1
Monthly wind speed variation
The annual average wind speed for the four meteorological stations at the Sahel zone ranges between 1.75 m/s to 4.5 m/s at 10 m height and from 2.5 – 6.5 m/s, at 100 m above ground level. As shown in Figs. 2 – 5, the variation of the mean speed fluctuates between 2.5 m/s to 4.5 m/s at N'Djamena, Abeche and Mongo. However, it drops to less than 3 m/s at Mao throughout the year. The trends of monthly mean wind speed variations between the different stations are almost similar throughout the years under study. The peak wind speed tends to occur during the dry season with March to be the month with highest wind speed potentials. This also corresponds to the highest electrical demand in the country [6]. This indicates that a wind energy conversion system could solve the incessant power outage in this period. On the other hand, the lowest mean wind speed occurs during the wet season in September. Among the four Sahel zones, N'Djamena station exhibits the highest mean wind speed values, while Mao shows the lowest mean.
Moreover, it is observed that the seasonal variation along the year indicates that strong mean wind speed is found during the dry season (November to April), while a relatively low mean speed is found in autumn (June to October). A similar pattern is observed for all stations.
Fig. 2 Monthly variations of wind speed at 10 m.
Fig. 3 Monthly variations of wind speed at 30 m.
Fig. 4 Monthly variations of wind speed at 50 m.
Jan Feb Mar Apr May Jun Jul Aug Sep Oct
Nov Dec
--1.0 1.5 2.0 2.5 3.0 3.5 4.0 4.5 5.0
M
e
a
n
w
in
d
s
p
e
e
d
(
m
/s
)
Months
Abeche Mao Mongo N'Djaména
Jan Feb Mar Apr May Jun Jul Aug Sep Oct
Nov Dec
--1.5 2.0 2.5 3.0 3.5 4.0 4.5 5.0 5.5
M
e
a
n
w
in
d
s
p
e
e
d
(
m
/s
)
Months
Abeche Mao Mongo N'Djaména
Jan Feb Mar Apr May Jun Jul Aug Sep Oct
Nov Dec
--1.5 2.0 2.5 3.0 3.5 4.0 4.5 5.0 5.5 6.0
M
e
a
n
w
in
d
s
p
e
e
d
(
m
/s
)
Months
D.H Didane et al., Int. J. of Integrated Engineering Vol. 10 No. 8 (2018) p. 164-174
168
Fig. 5 Monthly variations of wind speed at 100 m.
5.2
Wind power and energy density
The yearly mean wind power density and wind energy density are calculated using Equation 7 and Equation 8, respectively. The calculated output for the four stations at four different heights starting from 10 m up to 100 m height are tabulated in Table 2 and illustrated in Fig. 6. It is clear that N'Djamena shows the highest amount of wind power density with a maximum of more than 160 W/m2 at
100 m above ground level compared to nearly 74 W/m2 at
10 m height. The corresponding wind energy density at the same station has peaked up to 1.34 MWh/m2/year at 100
m. The lowest power density occurred in Mao with only 30 W/m2 at 10 m height and increased to 61 W/m2 at 100
m. The annual mean wind at Mao station has not changed much with height due to the lowest mean wind speed at this station. It was observed that extrapolating the wind data from 10 m to 100 m height has increased the wind speed by nearly 40%, which resulted in an increase of power potentials by almost 125%.
Fig. 6 Comparison of yearly mean wind power density at different heights.
Table 2: Wind energy density at different height.
Parameters
Station
10 m 30 m 50 m 100 m
E/A (kWh/m2)
E/A (kWh/m2)
E/A (kWh/m2)
E/A (kWh/m2)
Abeche 602.72 868.39 1034.65 1340.36 Mao 260.79 365.34 429.31 536.73 Mongo 442.77 632.73 749.79 947.58 N'Djamena 648.71 937.79 1117.11 1421.33
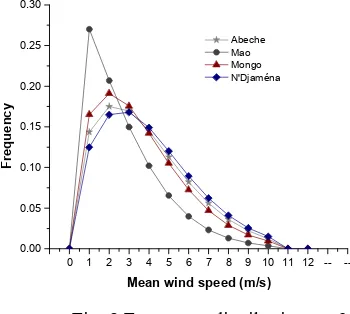
Fig. 7 Frequency distributions at 10 m.
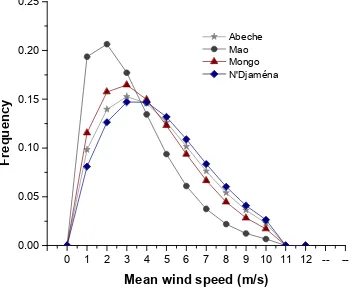
Fig. 8 Frequency distributions at 30 m.
Fig. 9 Frequency distributions at 50 m.
Jan Feb Mar Apr May Jun Jul Aug Sep Oct
Nov Dec
--1.5 2.0 2.5 3.0 3.5 4.0 4.5 5.0 5.5 6.0 6.5 7.0
M
e
a
n
w
in
d
s
p
e
e
d
(
m
/s
)
Months
Abeche Mao Mongo N'Djaména
Abeche Mao Mongo N'Djaména
0 20 40 60 80 100 120 140 160 180
M
e
a
n
p
o
w
e
r
d
e
n
s
it
y
(
W
/m
2)
Station
10 m 30 m 50 m 100 m
0 1 2 3 4 5 6 7 8 9 10 11 12 -- --0.00
0.05 0.10 0.15 0.20 0.25 0.30 0.35
F
re
q
u
e
n
c
y
Mean wind speed (m/s)
Abeche Mao Mongo N'Djaména
0 1 2 3 4 5 6 7 8 9 10 11 12 -- --0.00
0.05 0.10 0.15 0.20 0.25 0.30
F
re
q
u
e
n
c
y
Mean wind speed (m/s)
Abeche Mao Mongo N'Djaména
0 1 2 3 4 5 6 7 8 9 10 11 12 -- --0.00
0.05 0.10 0.15 0.20 0.25 0.30
F
re
q
u
e
n
c
y
Mean wind speed (m/s)
169
5.3
Weibull Distribution
The Monthly mean speed, scale parameter and shape parameter of Weibull distribution for all stations under study are presented in Table 3 and Table 4. The Weibull parameters of each station were assessed at heights that range between 10 m to 100 m above ground level. It was found that the shape parameter, k varies between 1.3 at 10 m height to almost 2 at 100 m height throughout the year for most of the stations such as Abeche, Mongo and N'Djamena. Given that the typical value of shape parameter is in the range of 1.5 to 3 for a stable and persistent site, stations such as Abeche, Mongo and N'Djamena could be considered stable in most of the months of the year starting from the height of 10 m above the ground. However, although Mao station showed the least output at low altitudes, nevertheless higher values of shape parameter were observed at 100 m height.
In terms of the scale parameter, c greater temporal variations were observed. The highest scale parameter was witnessed in N'Djamena in March with the value of 5 m/s at 10 m to 7 m/s at 100 m height. While the lowest values were witnessed again in Mao station in September with only 1.8 m/s and 2.6 m/s at 10 m and 100 m height, respectively. This clearly indicates the huge difference in the strength of wind in N'Djamena compared to Mao and also the significant variation of wind with altitude. An almost similar trend to this is observed throughout the year for all other stations with N'Djamena to exhibit the strongest wind speed.
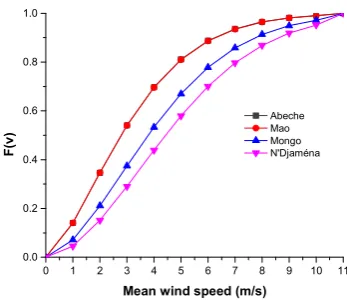
Figs. 7 – 10 and Figs. 11 – 14, respectively show the frequency distribution and cumulative distribution for all stations at four different heights. It can be seen in Figs. 7 – 10 that the frequency distributions have similar trends with Abeche alone to possess a frequency percentage over 20% at every altitude and it is in the range of 1 m/s – 4 m/s wind speed. Moreover, the frequency distribution decreases as the altitude increases and cover more strong wind speed but with less frequency. On the other hand, the cumulative distribution increases with wind speed and reaches nearly a unity at 11 m/s wind speed.
Fig. 10 Frequency distributions at 100 m.
Fig.11 Cumulative distributions at 10 m.
Fig. 12 Cumulative distributions at 30 m.
Fig. 13 Cumulative distributions at 50 m.
0 1 2 3 4 5 6 7 8 9 10 11 12 -- --0.00
0.05 0.10 0.15 0.20 0.25
F
re
q
u
e
n
c
y
Mean wind speed (m/s)
Abeche Mao Mongo N'Djaména
0 1 2 3 4 5 6 7 8 9 10 11 0.0
0.2 0.4 0.6 0.8 1.0
F
(v
)
Mean wind speed (m/s)
Abeche Mao Mongo N'Djaména
0 1 2 3 4 5 6 7 8 9 10 11 0.0
0.2 0.4 0.6 0.8 1.0
F
(v
)
Mean wind speed (m/s)
Abeche Mao Mongo N'Djaména
0 1 2 3 4 5 6 7 8 9 10 11 0.0
0.2 0.4 0.6 0.8 1.0
F
(v
)
Mean wind speed (m/s)
International Journal of Integrated Engineering, Vol. 10 No. 8 (2018) p. 164-174
© Penerbit UTHMDOI: https://doi.org/10.30880/ijie.xx.xx.xxxx.xx.xxxx
*Corresponding author: djamal@uthm.edu.my
2018 UTHM Publisher. All right reserved. penerbit.uthm.edu.my/ojs/index.php/ijie
170
Table 3: Monthly mean wind speed and Weibull parameters (k, c).
Station Abeche Mao
Month Parameters Height
10 m 30 m 50 m 100 m 10 m 30 m 50 m 100 m
Jan
3.38 3.95 4.25 4.70 2.57 3.01 3.23 3.57
k 1.53 1.65 1.71 1.80 1.33 1.44 1.49 1.57 c 3.75 4.42 4.77 5.28 2.80 3.31 3.58 3.98
Feb
3.3 3.86 4.15 4.59 2.66 3.11 3.35 3.70
k 1.51 1.63 1.69 1.78 1.35 1.46 1.52 1.60 c 3.66 4.31 4.65 5.15 2.90 3.44 3.71 4.12
Mar k 1.62 3.8 4.45 1.75 4.78 1.82 5.28 1.91 2.81 1.39 3.29 1.50 3.54 1.56 3.90 1.64 c 4.24 4.99 5.38 5.95 3.08 3.64 3.93 4.36
Apr
3.60 4.21 4.53 5.00 2.27 2.66 2.86 3.15
k 1.57 1.70 1.77 1.86 1.25 1.35 1.40 1.47 c 4.01 4.72 5.09 5.63 2.44 2.90 3.14 3.49
May k 1.53 3.38 3.95 1.65 4.25 1.71 4.70 1.80 2.17 1.22 2.54 1.32 2.73 1.37 3.02 1.44 c 3.75 4.42 4.77 5.28 2.32 2.76 2.99 3.32
Jun
2.99 3.50 3.76 4.15 2.20 2.57 2.77 3.06
k 1.44 1.55 1.61 1.69 1.23 1.33 1.38 1.45 c 3.29 3.89 4.20 4.65 2.35 2.80 3.03 3.37
Jul k 1.52 3.34 3.91 1.64 4.20 1.70 4.64 1.79 2.16 1.22 2.53 1.32 2.72 1.37 3.00 1.44 c 3.70 4.37 4.71 5.22 2.31 2.74 2.97 3.31
Aug
2.81 3.29 3.54 3.90 1.88 2.20 2.37 2.61
k 1.39 1.50 1.56 1.64 1.14 1.23 1.28 1.34 c 3.08 3.64 3.93 4.36 1.97 2.35 2.55 2.85
Sep k 1.36 2.68 3.14 1.47 3.37 1.52 3.72 1.60 1.75 1.10 2.05 1.19 2.20 1.23 2.43 1.29 c 2.93 3.46 3.74 4.15 1.81 2.17 2.36 2.63
Oct
3.28 3.84 4.13 4.56 2.19 2.56 2.76 3.04
k 1.50 1.63 1.69 1.77 1.23 1.33 1.38 1.45 c 3.63 4.29 4.62 5.12 2.34 2.79 3.02 3.36
Nov k 1.53 3.39 3.97 1.65 4.27 1.71 4.71 1.80 2.62 1.34 3.07 1.45 3.30 1.51 3.64 1.58 c 3.76 4.44 4.78 5.30 2.85 3.38 3.65 4.06
Dec
3.25 3.80 4.09 4.52 2.54 2.97 3.20 3.53
DOI: https://doi.org/10.30880/ijie.xx.xx.xxxx.xx.xxxx
*Corresponding author: djamal@uthm.edu.my
2018 UTHM Publisher. All right reserved. penerbit.uthm.edu.my/ojs/index.php/ijie
171
Table 4: Monthly mean wind speed and Weibull parameters (k, c).Station Mongo N'Djamena
Month Parameters Height
10 m 30 m 50 m 100 m 10 m 30 m 50 m 100 m
Jan
2.41 2.82 3.03 3.35 3.65 4.27 4.59 5.07
k 1.29 1.39 1.45 1.52 1.59 1.72 1.78 1.87 c 2.60 3.09 3.34 3.71 4.07 4.79 5.16 5.71
Feb k 1.47 3.13 3.66 1.59 3.94 1.65 4.35 1.73 4.07 1.67 4.76 1.81 5.12 1.88 5.66 1.97 c 3.46 4.08 4.40 4.88 4.56 5.36 5.77 6.38
Mar
3.47 4.06 4.37 4.82 4.5 5.26 5.66 6.25
k 1.55 1.67 1.73 1.82 1.76 1.90 1.98 2.08 c 3.86 4.54 4.90 5.42 5.05 5.93 6.39 7.06
Apr k 1.56 3.51 4.11 1.68 4.42 1.74 4.88 1.83 1.57 3.6 4.21 1.70 4.53 1.77 5.00 1.86 c 3.90 4.60 4.96 5.49 4.01 4.72 5.09 5.63
May
3.71 4.34 4.67 5.16 3.33 3.90 4.19 4.63
k 1.60 1.73 1.79 1.88 1.51 1.64 1.70 1.79 c 4.14 4.87 5.25 5.81 3.69 4.35 4.70 5.20
Jun k 1.56 3.55 4.15 1.69 4.47 1.75 4.93 1.84 4.09 1.68 4.79 1.82 5.15 1.88 5.68 1.98 c 3.95 4.65 5.02 5.55 4.58 5.38 5.80 6.41
Jul
3.16 3.70 3.98 4.39 3.7 4.33 4.66 5.14
k 1.48 1.60 1.66 1.74 1.60 1.73 1.79 1.88 c 3.49 4.12 4.45 4.93 4.13 4.86 5.23 5.79
Aug k 1.34 2.6 3.04 1.45 3.27 1.50 3.61 1.58 2.78 1.38 3.25 1.50 3.50 1.55 3.86 1.63 c 2.83 3.35 3.63 4.02 3.04 3.60 3.89 4.32
Sep
2.36 2.76 2.97 3.28 2.44 2.85 3.07 3.39
k 1.28 1.38 1.43 1.50 1.30 1.40 1.45 1.53 c 2.55 3.02 3.27 3.63 2.64 3.13 3.39 3.76
Oct k 1.38 2.76 3.23 1.49 3.47 1.55 3.84 1.63 2.53 1.32 2.96 1.43 3.18 1.48 3.52 1.56 c 3.02 3.57 3.86 4.28 2.75 3.26 3.52 3.91
Nov
3.04 3.56 3.83 4.22 3.29 3.85 4.14 4.57
k 1.45 1.57 1.62 1.71 1.51 1.63 1.69 1.77 c 3.35 3.96 4.27 4.74 3.65 4.30 4.64 5.14
International Journal of Integrated Engineering, Vol. 10 No. 8 (2018) p. 164-174
© Penerbit UTHMDOI: https://doi.org/10.30880/ijie.xx.xx.xxxx.xx.xxxx
*Corresponding author: djamal@uthm.edu.my
2018 UTHM Publisher. All right reserved. penerbit.uthm.edu.my/ojs/index.php/ijie
172
Fig. 14 Cumulative distributions at 100 m.
5.4
Analysis of
solar parameters
This section presents the calculated parameters of global solar radiation by the Angstrom model and also a comparison with those NASA estimated for the four meteorological stations of the Sahelian zone of Chad. The data were collected for a period of 10 years. For each station, the parameters such as ωs, δ, S0, S, a, b, H0 and H
were calculated using the equations of the model and the global solar radiation was described in the figures.
Fig. 15 illustrates the global solar radiation (H) for the four stations. The annual average global solar radiations observed are 6.52 kWh/m2/day, 6.66 kWh/m2/day, 6.78
kWh/m2/day and 6.82 kWh/m2/day, respectively at
Mongo, N'Djamena, Mao and Abeche stations. In general, the value of the global solar radiation of the Sahelian zone is of the order of 6 kWh/m2/day. These results are similar
to those obtained in the evaluation of global solar radiation made by Soulouknga et al.[9] and those of the NASA database as shown in Figs. 16, 17, 18 and 19. With a 13% rate of return for the solar photovoltaic sector, the solar energy produced is estimated, respectively at Mongo, N'Djamena, Mao and Abeche stations as 309.38 kWh/m2/year, 316.02 kWh/m2/year, 321.71 kWh/m2/year
and 323.61 kWh/m2/year.
Figure 15: Global solar radiation-Angstrom model.
Figure 16: Global solar radiation of Abeche
Figure 17: Global solar radiation of Mao
Figure 18: Global solar radiation of Mongo
0 1 2 3 4 5 6 7 8 9 10 11 0.0
0.2 0.4 0.6 0.8 1.0
F
(v
)
Mean wind speed (m/s)
Abeche Mao Mongo N'Djaména
Jan Feb Mar Apr May Jun Jul Aug Sep Oct Nov Dec
5.0 5.5 6.0 6.5 7.0 7.5
G
lo
b
a
l
ra
d
ia
ti
o
n
,
H
(
k
W
h
/m
²)
Months
Abeche N'Djamena Moa Mongo
Jan Feb Mar Apr May Jun Jul Aug Sep Oct Nov Dec
4.0 4.5 5.0 5.5 6.0 6.5 7.0 7.5 8.0
G
lo
b
a
l
ra
d
ia
ti
o
n
,
H
(
k
W
h
/m
²)
Months Angstrom NASA
Jan Feb Mar Apr May Jun Jul Aug Sep Oct Nov Dec
4.0 4.5 5.0 5.5 6.0 6.5 7.0 7.5 8.0
G
lo
b
a
l
ra
d
ia
ti
o
n
,
H
(
k
W
h
/m
²)
Months Angstrom NASA
Jan Feb Mar Apr May Jun Jul Aug Sep Oct Nov Dec
4.0 4.5 5.0 5.5 6.0 6.5 7.0 7.5 8.0
G
lo
b
a
l
ra
d
ia
ti
o
n
,
H
(
k
W
h
/m
²)
173
Figure 19: Global solar radiation of N'Djamena6.
Conclusion
In this assessment, a long-term meteorological data of ten years for four key stations at the Sahelian zone of Chad has been analyzed. The assessment has included the potential of wind power as well as solar power potential in the Sahel zone of Chad. The main goal of the current study was to determine the prospects of wind and solar energy and to provide the first comprehensive assessment of these energies at the Sahelian zone. The Weibull density function and empirical Angstrom model have been used to determine the wind energy and solar energy potentials, respectively. The yearly average shape and scale parameters of the Weibull distribution are broadly varied between 1.56 and 3.91 m/s at Abeche, 1.26 and 2.49 m/s at Mao, 1.44 and 3.33 m/s at Mongo and 1.54 and 3.85 m/s at N’Djamena, at the standard 10 m height.
The annual mean wind speed at this zone ranges between 2 m/s and 5.5 m/s with a corresponding mean power density between 69 W/m2 to 74 W/m2, at the
standard height of 10 m. The data has been extrapolated to up to 100 m using the Power-Law. The power density has been found to increase significantly by nearly 120%, at 100 m height. The seasonal variations show that stronger wind speeds are generally available during the dry season between June and October and relatively lower wind speed is found during the wet season. The highest mean wind speed for all stations considered is found in the month of March except at Mongo where the highest speed occurred during May. The yearly maximum mean wind speed found was 4.42 m/s at N’Djamena, 3.8 m/s at Abeche, 3.79 m/s at Mongo and 2.76 m/s at Mao at 10 m height. However, with regard to energy density, Ndjamena showed the highest wind energy density, followed by Abeche, Mongo and Mao the exhibit the least energy density.
According to Angstrom, the more reliable mean global solar radiation value at the Sahelian zone is observed during the month of July with 5.64 kWh/m2/day
at the meteorological station of Mao. Meanwhile, the highest mean global solar radiation is observed in June at the Mao station again with 7.06 kWh/m2/day. In
comparison with the NASA data, the Angstrom model has proven to be favorable for the evolution of global solar
radiation in the four meteorological stations of Sahelian zone of Chad. Furthermore, it is also concluded that although the average wind energy density at N’Djamena was found to be the highest, the solar energy potential at Abeche was observed to be the most promising. Whereas, the lowest wind and solar potentials are found respectively at Mao and Mongo stations.
Acknowledgment
The authors wish to express their sincere gratitude and gratefully acknowledge the support received from Universiti Tun Hussein Onn Malaysia under the research grant H126.The authors also wish to express their sincere gratitude to the National Meteorological General Administration (ASECNA) in Chad for the provision of the meteorological data.
References
[1] Didane, D. H., Rosly, N., Zulkafli, M. F., & Shamsudin, S. S. (2018). Performance evaluation of a novel vertical axis wind turbine with coaxial contra-rotating concept. Renewable Energy, 115, 353-361. [2] Didane, D. H., Mohd, S., Subari, Z., Rosly, N., Ghafir,
M. A., & Masrom, M. M. (2016, November). An aerodynamic performance analysis of a perforated wind turbine blade. In IOP Conference Series: Materials Science and Engineering (Vol. 160, No. 1, p. 012039). IOP Publishing.
[3] Lau, K. X., Leow, P. L., Jamani, J. J., Arsat, R., Abdeltawab, A. A. A., Rahman, S. S., ... & Khalid, I. A. (2018). Harvesting Electrical Energy from Rooftop Ventilator. International Journal of Integrated Engineering, 10(4).
[4] Emovon, I., Samuel, O. D., Mgbemena, C. O., & Adeyeri, M. K. (2018). Electric Power generation crisis in Nigeria: A Review of causes and solutions. International Journal of Integrated Engineering, 10(1).
[5] Emovon, I., & Samuel, O. D. (2017). Prioritising Alternative Solutions to Power Generation Problems Using MCDM Techniques: Nigeria as Case Study. International Journal of Integrated Engineering, 9(3).
[6] Didane, D. H., Rosly, N., Zulkafli, M. F., & Shamsudin, S. S. (2017). Evaluation of Wind Energy Potential as a Power Generation Source in Chad. International Journal of Rotating Machinery, 2017.
[7] Didane, D. H., Ab Wahab, A., Shamsudin, S., & Rosly, N. S. (2016). Wind as a sustainable alternative energy source in Malaysia-a review. ARPN Journal of Engineering and Applied Sciences, 11, 18.
[8] Soulouknga, M. H., Oyedepo, S. O., Doka, S. Y., & Kofane, T. C. (2017). Assessment of Wind Energy Potential in the Sudanese Zone in Chad. Energy and Power Engineering, 9(07), 386.
[9] Soulouknga, M. H., Coulibaly, O., Doka, S. Y., & Kofane, T. C. (2017). Evaluation of global solar radiation from meteorological data in the Sahelian
Jan Feb Mar Apr May Jun Jul Aug Sep Oct Nov Dec
4.0 4.5 5.0 5.5 6.0 6.5 7.0 7.5 8.0
G
lo
b
a
l
ra
d
ia
ti
o
n
,
H
(
k
W
h
/m
²)
D.H Didane et al., Int. J. of Integrated Engineering Vol. 10 No. 8 (2018) p. 164-174
174
zone of Chad. Renewables: Wind, Water, and Solar, 4(1), 4.
[10] Al-Mohamad, A., & Karmeh, H. (2003). Wind energy potential in Syria. Renewable Energy, 28(7), 1039-1046.
[11] Nassar, W., Alhajraf, S., Enizi, A., & Al-Awadhi, L. (2005). Potential wind power generation in the State of Kuwait. Renewable Energy, 30(14), 2149-2161.
[12] Didane, D. H., Wahab, A. A., Shamsudin, S. S., Rosly, N., Zulkafli, M. F., & Mohd, S. (2017, April). Assessment of wind energy potential in the capital city of Chad, N’Djamena. In AIP Conference Proceedings (Vol. 1831, No. 1, p. 020049). AIP Publishing.
[13] Keyhani, A., Ghasemi-Varnamkhasti, M., Khanali, M., & Abbaszadeh, R. (2010). An assessment of wind energy potential as a power generation source in the capital of Iran, Tehran. Energy, 35(1), 188-201. [14] Islam, M. R., Saidur, R., & Rahim, N. A. (2011).
Assessment of wind energy potentiality at Kudat and Labuan, Malaysia using Weibull distribution function. Energy, 36(2), 985-992.
[15] Ahmed, A. S. (2010). Wind energy as a potential generation source at Ras Benas, Egypt. Renewable and Sustainable Energy Reviews, 14(8), 2167-2173. [16] Goh, H. H., Lee, S. W., Chua, Q. S., Goh, K. C., &
Teo, K. T. K. (2016). Wind energy assessment considering wind speed correlation in Malaysia. Renewable and Sustainable Energy Reviews, 54, 1389-1400.
[17] Besharat, F., Dehghan, A. A., & Faghih, A. R. (2013). Empirical models for estimating global solar radiation: A review and case study. Renewable and Sustainable Energy Reviews, 21, 798-821.
[18] Medugu, D. W., & Yakubu, D. (2011). Estimation of mean monthly global solar radiation in Yola–Nigeria
using angstrom model. Advances in Applied Science Research, 2(2), 414-421.
[19] Adaramola, M. S. (2012). Estimating global solar radiation using common meteorological data in Akure, Nigeria. Renewable Energy, 47, 38-44. [20] Musa, B., Zangina, U., & Aminu, M. (2012).
Estimation of global solar radiation in Maiduguri, Nigeria using Angstrom model. ARPN Journal of Engineering and Applied Sciences, 7(12), 1623-1627. [21] Okonkwo, G. N., & Nwokoye, A. O. C. (2014). Relationship between global solar radiation and sunshine hour duration for Bida in Nigeria. International Journal of Renewable and Sustainable Energy, 3(2), 43-46.
[22] Coulibaly, O., & Ouedraogo, A. (2016). Correlation of global solar radiation of eight synoptic stations in Burkina Faso based on linear and multiple linear regression methods. Journal of Solar Energy, 2016. [23] Quansah, E., Amekudzi, L. K., Preko, K., Aryee, J.,
Boakye, O. R., Boli, D., & Salifu, M. R. (2014). Empirical models for estimating global solar radiation over the Ashanti region of Ghana. Journal of Solar Energy, 2014.
[24] Klein, S. A. (1977). Calculation of monthly average insolation on tilted surfaces. Solar energy, 19(4), 325-329.
[25] Khorasanizadeh, H., & Mohammadi, K. (2013). Introducing the best model for predicting the monthly mean global solar radiation over six major cities of Iran. Energy, 51, 257-266.


![Rheumatoid Arthritis of the Temporomandibular Joint; Comparison of Digital Panoramic Radiographs Taken Using the Joint Limitation Program [JLA View] and CT Scans](data:image/gif;base64,R0lGODlhAQABAIAAAP///wAAACH5BAEAAAAALAAAAAABAAEAAAICRAEAOw==)