© Penerbit UTHM DOI: https://doi.org/10.30880/ijie.2018.10.06.009
Towards Formulating Dynamic Model for Predicting Defects
in System Testing using Metrics in Prior Phases
Muhammad Dhiauddin Mohamed Suffian
1,2*, Dayang Norhayati Abang
Jawawi
1, Rd. Rohmat Saedudin
3, Mohd Adham Isa
11
School of Computing, Faculty of Engineering,
Universiti Teknologi Malaysia, 81310 Skudai, Johor, Malaysia. 2
Business Solution and Services
MIMOS Technology Solutions Sdn. Bhd., 57000 Kuala Lumpur, Malaysia. 3
School of Industrial Engineering, Telkom University, 40257 Bandung, West Java, Indonesia.
Received 28 June 2018; accepted 5 August 2018, available online 24 August 2018
1. Introduction
WATERFALL has been well-known as one of the traditional software engineering process model. The model arranges the phases according to linear sequence [1], namely concept definition, requirement, design, code, testing and maintenance phases [2]. Early testing has been put into emphasis when the improved model of Waterfall referred as model was introduced [3]. In V-model, early testing means every phase has to undergo rigour verification and validation (V&V) activities before releasing the software to end-users or its operational environment. These activities may include the following, but not limited to requirement review, design review, code inspection and corresponding test level: unit test, integration test, system test as well as acceptance test [4]. This allows defects to be discovered hence fixed as early as possible in the life cycle.
System testing is executed when all required subsystems are fully integrated into one system [5] that consists of wider range of functional and non-functional testing. Typically, independent testing team is responsible for carrying out system testing to ensure software under test meet user’s requirement and expectation. The defects
found either functional or non-functional defects are sent back to developers for fixing and then retested again for confirmation. One of the challenges faced by team in completing test execution is making sure all defects have been found by testers and fixed by developers within the timeline. Furthermore, it is also expected that when all defects have been detected and fixed during system testing in which the environment setup mimics the production environment, the same defects should not be re-introduced and detected again in the end-user’s environment. However, this might not be the ideal case since there is no clear mechanism or measurement to help the team in giving such confirmation. Thus, early and reliable indicator is essential in helping testing team to know the predicted total number of defects to be found at the start of system testing execution.
It is important to have prediction of defects specifically for system testing. Testing team could use the prediction as the guide on the number of defects that they should find in the software under test. The more the defects could be found, the lesser or zero-known defects escapes to end-users. From management point of view, the right number of testers could be allocated across Abstract: Many studies have been carried out in formulating software defect prediction but it is of limited knowledge that those studies emphasized on predicting defects in system testing phase. This study specifically focuses on establishing a prediction model for system testing defects by exploiting metrics prior to system testing under V-model development. The initiative helps independent testing team to prevent as many defects as possible from escaping to production environment. The proposed model analyzes development-related and testing-related metrics collected from requirement, design and construction phases in determining which of those could significantly predict defects at the start of system testing. By applying statistical analysis to those metrics, this model able to formulate one generalized mathematical equation for predicting defects in system testing. The model applies 95% prediction interval to ensure the accuracy of the prediction.
Keywords: system testing, metrics, model, prediction, software
*Corresponding author: [email protected]/[email protected]
2018 UTHM Publisher. All right reserved. penerbit.uthm.edu.my/ojs/index.php/ijie
multiple test projects by comparing historical data on testers per total defects found in previous projects against the current prediction. Realistic number of days for test execution could also be scheduled by referring to this information. All these shall contribute towards the completion of system testing within the time frame. Defect prediction also influences the test strategy employed by testing team in finding defects. Putting the prediction in place allows the team to plan and adopt most effective test types and techniques so that the defects found are closer enough with the prediction due to understanding that it is difficult to have 100% accuracy in predicting defects. This will increase the coverage of testing and lead to the production of high quality software. Therefore, in order to predict defects in system testing, a right and systematic approach is required for developing the prediction model. In this research context, the focus is to analyze, utilize and select significant metrics collected from development and testing-related activities taking place before system testing as predictors for defects. As mentioned earlier, V-model is chosen as the process model for the research since V & V activities are heavily carried out from requirement to deployment phase involving the collection and monitoring of various metrics.
This discussion in this paper is organized into several sections. Section II describes the related works while Section III highlights about testing and V-model. Section IV discusses the findings of the proposed model followed by Section V, which illustrates the implementation of the proposed model in case study. Section VI summarizes the key contributions of the research together with the opportunities for future works
2.
Related Works
Although defect prediction is not a new area of interest, there is limited information on how prediction of defects is done specifically for system testing. Among the earliest works on defect prediction was done by [6] which used cyclomatic complexity and lines of code (LOC) as defect predictors. [7] demonstrated that predictors for defects can be categorized into project management, process improvement and work product assessment. [8] took similar approach by using review, code testing, code peer review, product release usage and defect validation metrics to formulate prediction model via regression analysis. Software defects could also be predicted by adopting mathematical distributions [9] or applying Defect Type Model (DTM) which relies on defect severity based on Bayesian Network [10]. In different perspective, [11] viewed defect prediction as defect inflow prediction that could be obtained by employing multivariate linear regression. Quality Function Deployment (QFD) and transfer function in Six Sigma were another techniques used to predict defects in software [12]. Apart from that, instead of predicting total number of software defects, [13] approached it in different ways by utilizing COnstructive QUALity Model (COQUALMO) to predict defect density.
Software defect prediction can be observed from various angles. [14] viewed defect prediction as the area of remaining defect when testing activities are still on-going. On the other hand, defects found in e-mail and website of open source software became the area of concern for [15]. Under the study using Rayleigh model, [16] consider each phase in software life cycle as the area of defect prediction. This supported by similar effort by [17] and [18] via the use of Bemar and CDM model, respectively.
Choosing and using the right predictors serve as the crucial element in prediction as this will determine how significant the predictors are in discovering defects. [15] believed object-oriented metrics serve as good predictors for defects while [19] were more comfortable in using developer-related metrics to predict software defects. These involve metrics on number of developers who made modification prior to release, during the release and all releases. Metrics from historical were also used as defect predictors [20]. This is similar to the work by [21] that used detailed requirements and potential defects from each phase in development to develop the prediction model. Furthermore, [22] managed to develop an effective defect prediction model by adopting only three software metrics as significant predictors.
Performance and accuracy of the formulated model is important to ensure the model can successfully predict the correct or acceptable number of defects. Percentage of faults found was one of the good measures for a successful prediction [23]. In other forms, a defect prediction is said to successful when the prediction result could be used for software maintenance in the future [24]. Number of commit data can also serve as good measurement for prediction performance [25]. However, regardless of any method or result of the prediction, it can only serve as a good benchmark if the data set used is significantly huge [26].
Several areas of concern have been addressed by several recent studies on predictors for defect. One of them is about categorization of data for generating the defect prediction into qualitative and quantitative [27], which is more focused on early stage defects in development life cycle. Qualitative data can be found in COQUALMO. For quantitative data, it can be referred to team size, effort, test cases and software size. Both categories of data exist as product and process metrics which are employed in this research. Apart from that, defect prediction should also address various context and nature of software. [28] proposed phases of preparation, model creation and model usage to form the framework for context-specific prediction towards producing reliable software defect prediction. It is also important to use finer granularity of metrics, tackle new ‘customers’ for prediction and deal with prediction noise [29]. By incorporating such aspects, a practical model of defect prediction can be established and serves as the basis for the term called “Defect Prediction 2.0”. The works on future defect prediction should also address various challenges such as prediction for new areas, fast pace
development and understanding of ways for fixing defects (30).
Considering all those prior efforts, this research has been undertaken with the emphasis on establishing a systematic model to formulate realistic prediction for defects to be found in system testing by making use of development and testing-related metrics in prior phases. The focus is only for software projects that adopt V-model as the development process.
3.
Testing and V-Model
Generally, the introduction of V-Model is to show corresponding test activities for each phase of development [4]. The left ‘V’ represents the typical waterfall phases while the right ‘V’ depicts the related test levels. [3] added smaller details in between the left and right ‘Vs’ by putting planning activities for each test level. [3] described the phases for left ‘V’ as requirement, analysis, high-level design and low-level design while [4] refer those phases as requirement specification, functional specification, technical specification and program specification. But, both refer to the same understanding of typical waterfall phases comprise of user requirement, system requirement, system design and component or unit design, respectively. The V-model diagram as illustrated by [3] can be represented below in Figure 1:
Fig. 1: V-model development process. It clearly shows each waterfall phase with its corresponding test level. From Fig. 1, there is no detail description on how V&V activities are incorporated and integrated into the V-model process. Thus, the diagram is revisited and reconstructed to illustrate these activities. The revised diagram also includes the area of defect prediction. This is represented below in Figure 2:
Fig. 2: Verification and validation activities in V-model development process. Note the testing phase as area of prediction, which is highlighted in dotted-square area.
The diagram divides the V&V activities into upper part for development-related activities while the lower part for testing-related activities that take place in parallel throughout the software life cycle. Development-related activities under V&V can include but not limited to requirement review, high-level design review low-level design review and Graphical User Interface (GUI) design review. In parallel, V&V activities related to testing are also carried out including test planning and review, test cases design and review, test scripts design and review, sanity testing, system testing as well as post-testing activities such as user acceptance test (UAT), beta testing, pilot implementation and software release. However, post-testing activities are not considered in this research as the scope is up to system testing phase only.
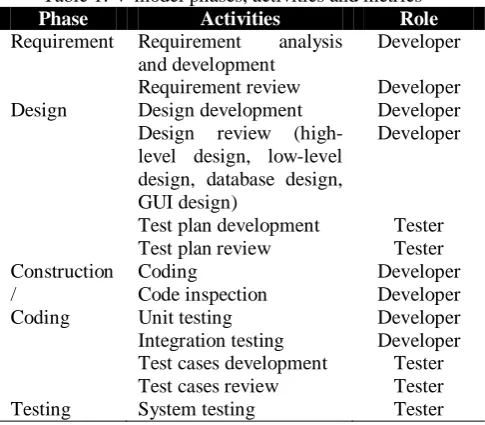
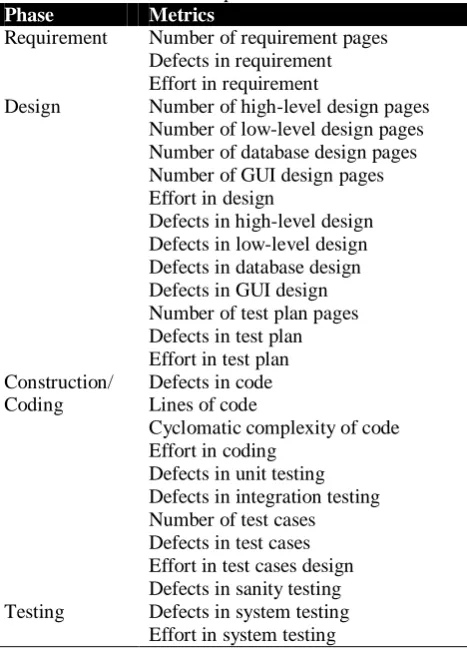
Each activity is tracked and measured by collecting metrics, either by developer or tester. These details are summarized in Table 1. As for Table 2, it outlines the possible metrics to be collected for each phase.
Table 1: V-model phases, activities and metrics
Phase Activities Role
Requirement Requirement analysis and development
Developer Requirement review Developer Design Design development Developer
Design review (high-level design, low-(high-level design, database design, GUI design)
Developer
Test plan development Tester Test plan review Tester Construction
/ Coding
Coding Developer
Code inspection Developer
Unit testing Developer
Integration testing Developer Test cases development Tester Test cases review Tester
Testing System testing Tester
Table 2: V-model phases and metrics
Phase Metrics
Requirement Number of requirement pages Defects in requirement Effort in requirement
Design Number of high-level design pages Number of low-level design pages Number of database design pages Number of GUI design pages Effort in design
Defects in high-level design Defects in low-level design Defects in database design Defects in GUI design Number of test plan pages Defects in test plan Effort in test plan Construction/
Coding
Defects in code Lines of code
Cyclomatic complexity of code Effort in coding
Defects in unit testing Defects in integration testing Number of test cases Defects in test cases Effort in test cases design Defects in sanity testing Testing Defects in system testing
Effort in system testing
Since the focus is to predict defects in system testing, metrics collected in prior phases to testing are considered as independent variables that will serve as potential predictors for the model while metrics in testing phase are treated as dependent variables. The actual metrics that will be finally used in the model could only be obtained once the analysis is completed. Further explanation is provided later in the Case Study section.
4.
Findings of Proposed Model
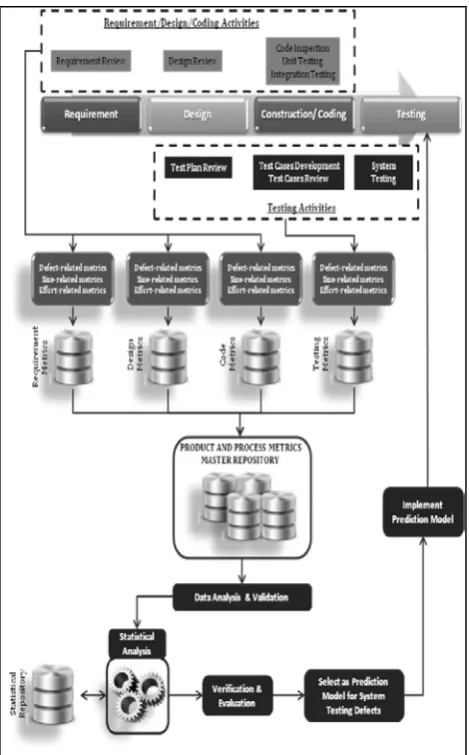
The model of using prior phases metrics to formulate the prediction for system testing incorporates process and practices of executing development and testing-related activities, collecting metrics, storing metrics, analyzing metrics, verifying results and implementing the verified prediction model. The whole comprehensive model for formulating and implementing this defect prediction is represented in Figure 3. Important note here is that the model involves historical data as well as new data.
Metrics are collected for related activities in every development phase and stored into their own repository, which can be referred as logical repository. All these logical repositories make up the master repository of product and process metrics that can be decomposed further into defect-related metrics, size-related metrics and effort-related metrics. They are differentiated based on type of software project and the methodology used.
This model will then use this repository as the main source for creating the prediction model. Once the data are extracted, they are filtered so that only accurate data are used for further analysis, in which only metrics from software projects that adopt V-model are considered.
During the analysis stage, statistical analysis techniques are applied to the metrics. The interactions between metrics for independent variables and metrics for dependent variables are observed to determine which set of independent variables can serve as significant predictors for the discovery of defects in system testing phase. Several mathematical equations are produced as the results of the statistical analysis, which are also kept in own repository for future reference. These equations can be referred as candidates of defect prediction model for system testing. In order to verify which equation is fit for final implementation, every prediction model candidate is applied into fresh new projects which are yet to enter system testing phase. These projects should not be part of the set metrics used for generating the equations. During this verification stage, actual defects found are compared against defects predicted by each equation for each project. The suitable equation for defect prediction model is selected from the equation that produces the most significant prediction result, in which it could predict the defects within the specified prediction range. This equation is then finally incorporated and implemented back into the software development process.
Fig. 3: Proposed model of formulating prediction for system testing defects by exploiting metrics in prior phases. It shows the cycle that need to be followed for generating the model and implementing back into V-model software process
.
In this research perspective, only multiple regression analysis is adopted as the statistical technique to generate the prediction equation. The reason being is to demonstrate that this model works and able to produce reliable prediction.
In the proposed model, there is a stage of conducting statistical analysis, in which several mathematical equations are formulated. In more detail, this stage involves following procedures:
1. Identify metrics to be collected from each phase in V-model: requirement, design, construction or coding and testing. Metrics from phases prior to testing are put as independent variables while metrics in testing phase are treated as dependent variables.
2. Collect the identified metrics from development and testing repositories.
3. Filter and validate the metrics data to ensure only accurate metrics are used.
4. Perform statistical analysis by using the validated metrics interchangeably, in which in this research
context multiple regression analysis. During this analysis, observe the interaction between various independent variables and dependent variables to determine which set of interactions produce the best mathematical prediction equation.
5. Acceptance criteria for selecting the mathematical equation as prediction equation candidate is based on R-squared and R-squared (adjusted) values of at least 90% as well as P-value of less than 0.05. This is to make sure the equation is a strong equation. Therefore, for this statistical analysis exercise, if the formulated equation satisfies all three aspects in the acceptance criteria, the equation could be considered as candidate for defect prediction model. Otherwise, if it fails to meet the acceptance criteria, revise the predictors (independent variables) used and perform regression analysis again.
6. Apply the selected candidates of prediction equation into new testing projects as explained earlier. Compare the actual defects found against predicted defects. Select the best defect prediction model when the actual defects found is between the specified range of 95% Prediction Interval (PI) for that particular equation. Otherwise, revise the selection of metrics if the actual defects found are out the PI range and repeat the analysis process. The above procedures are depicted below in Figure 4:
Fig. 4: The statistical analysis procedures in formulating prediction model for defects in system testing. The procedures need to be repeated in the event when the acceptance criteria are not satisfied.
As mentioned previously, the mathematical equation that has been selected as the final defect prediction model is incorporated back as part of the V-model software development process for actual implementation. The prediction model is still subjected for further refinement should the actual defects found do not fall within PI range. Figure 5 shows the implementation of the final prediction model.
Fig. 5: Implementation of final defect prediction model for system testing back into the V-model software development process. Comparison between actual defects found and predicted defect is done throughout the testing phase.
5.
Case Study
One organization was selected to conduct the case study. It is a research and development (R&D) organization that heavily involves in applied research activities, both in software and hardware. The interest is in their software development activities, which allow the demonstration of suitability for this model into real implementation. Furthermore, most software projects in the organization adopted V-model as their methodology or process model.
Historical data were collected from all completed projects, which comprise of following types of software: standalone or desktop-based, web-based and web-service. These projects were developed using various programming languages, namely PHP, Java and .NET. From the master repositories hold all metrics from requirement, design, coding and testing phase, following metrics were collected:
• Number of requirement pages
• Number of design pages
• Code size – kilo lines of code (KLOC)
• Number of test cases
• Effort in test cases design
• Effort in phases prior to system testing
• Defects in requirement
• Defects in design
• Defects in code and unit testing
• Defects in test cases
• Defects in system testing (for every software project)
Data for each metric were validated so that only accurate data are used for statistical analysis. For final set of data, fourteen (14) software projects were selected. For dependent variable, it is differentiated by either all defects in system testing or functional defects in system testing. The analysis used these two defects interchangeably to determine which category of defects can be closely predicted. Same thing for effort-related
metrics used for independent variables. Effort spent in test cases design and total effort spent for activities in requirement, design and coding phases that also include effort in test cases design were also used interchangeably so that the right effort-related predictor is used during the analysis. Table 3 outlines the final data set used in statistical analysis, which is regression analysis.
Table 3: Data set used for statistical analysis
Several sets of independent variables (predictors) and dependent variable (target/prediction) were used to conduct the regression analysis. The results of the analysis present the predictors that could be significant in predicting either functional defects only or all defects.
Table 4: Sets of independent and dependent variables for regression analysis
Set Independent
Variables (Predictors)
Dependent Variable (Target/
Prediction)
Set A • Requirement defects
• Code defects
• KLOC
• Requirement pages
• Design pages
• Total test cases
• Total effort
Functional defects
Set B • Requirement defects
• Code defects
• KLOC
• Requirement pages
• Design pages
• Total test cases
• Total effort
All defects
Set C • Requirement defects
• Code defects
• KLOC
• Requirement pages
• Design pages
• Total test cases
• Effort in test design
Functional defects
Set D • Requirement defects
• Code defects
• KLOC
• Requirement pages
• Design pages
• Total test cases
• Effort in test design
All defects
The results of regression analysis for each set in Table 4 are presented below in Figure 6, Figure 7, Figure 8 and Figure 9, respectively. Take note that there were slight differences in terms notation used when the data were put in the statistical software. Requirement error was used to refer to requirement defects, code and unit testing (CUT) error refers to code defects, effort days for total effort, effort test design refers to test cases design effort and total TC for total test cases.
Fig. 6: Regression analysis result for Set A
Fig. 7: Regression analysis result for Set B
Fig. 8: Regression analysis result for Set C
Fig. 9: Regression analysis result for Set D
The reasons for having four (4) sets of regression analysis were to determine whether the equations could better predict all defects or functional defects only, and whether effort for test case design or all efforts in phases prior to system testing should be considered as one of the predictors.
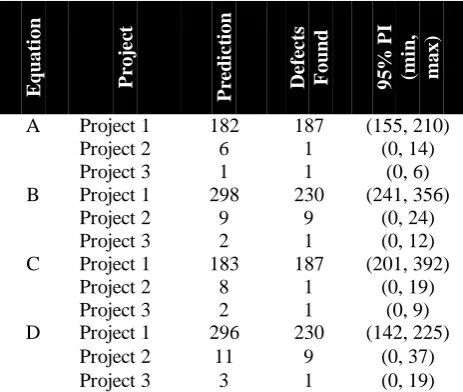
In general, all equations produced Squared and R-Squared (adjusted) of at least 90% while the P-value for each predictor was less than 0.05. For further confirmation on which equation should be selected as the defect prediction model, all equations were verified by applying them into new and fresh projects that have not yet entered system testing phase, in which their data were not part of the analysis. Prediction Interval (PI) for each equation was used as guidance for the range of prediction. PI of 95% specified the minimum and maximum number of defects that should be found by that particular equation. The verification results are presented below in Table 5:
Table 5: Verification results for each equation
Eq
u
ati
on
P
r
o
je
ct
Pr
ed
ict
io
n
De
fe
c
ts
F
o
und
95% P
I
(mi
n
,
max)
A Project 1 182 187 (155, 210)
Project 2 6 1 (0, 14)
Project 3 1 1 (0, 6)
B Project 1 298 230 (241, 356)
Project 2 9 9 (0, 24)
Project 3 2 1 (0, 12)
C Project 1 183 187 (201, 392)
Project 2 8 1 (0, 19)
Project 3 2 1 (0, 9)
D Project 1 296 230 (142, 225)
Project 2 11 9 (0, 37)
Project 3 3 1 (0, 19)
Based on the verification result, it is clear that Equation A demonstrated the most promising prediction within the specified PI range. This means that by using requirement defects, code defects, KLOC, requirement pages, design pages, total test cases and total effort spent by testers in phases prior to testing, functional defects for software under test adopting V-model process could be predicted. Besides that, this final result also explained that due to limited number of data used for analysis, the proposed model could only generate one generalized defect prediction that is only able to predict functional defects for any software under test. Thus, this proposed model is subjected to more improvements in the future to make it more robust and reliable in predicting defects for different type and nature of software produced.
6.
Conclusion
This effort has successfully proposed, established and demonstrated a systematic model of formulating prediction for system testing defects by using prior phases’ metrics, specifically for software adopting V-model development process. Metrics associated with development and testing activities collected during requirement, design and construction phases had been analyzed and exploited in order to discover the most significant predictors for system testing defects. Statistical analysis via regression analysis had served as useful and powerful technique in coming out with such mathematical equation for predicting defects. Furthermore, this had helped in proposing a model that predicts defects within a specified minimum and maximum range, not by absolute numbers.
As future measures for improving the proposed model, more metrics need to be considered in determining the suitable predictors. This shall include more product metrics rather than process metrics and also metrics granularity. Apart from this, this model could also look into ways of predicting defects beyond than just functional defects, such as performance defects, usability defects, and security defects. It is also expected that this model shall cater for formulating different defect prediction for different types of software. Obviously, any mechanism is welcomed to see the procedures introduced in this model can be automated for dynamically generating defect prediction for system testing in real-time.
References
[1] Jalote, P.A. Concise introduction to software engineering. Springer, 1st ed. (2008), New York.
[2] Laplante, P.A. What every engineer should know about software engineering. Taylor & Francis Group. (2007), Boca Raton, FL.
[3] Hambling, B. Software testing: an ISTQB-ISEB foundation guide, second edition. British Information Society Limited, (2010), North Star Avenue, Swindon.
[4] Desai, S. and Srivastava, A. Software testing: a practical approach. PHI Learning Private Limited, (2012), New Delhi.
[5] Spillner, A., Linz, T. and Schaefer, H. Software testing foundations: a study guide for the certified tester exam. Rocky Nook, (2007), Santa Barbara, CA.
[6] Fenton, N.E. and Neil, M. A critique of software defect prediction models. IEEE Transactions on Software Engineering.
Volume. 25 (5), (1999), pp.675-689.
[7] Clark, B. and Zubrow,D. How good is the software: a review of defect prediction techniques. Software Engineering Symposium, (2001), Carnegie Mellon University.
[8] Wahyudin, D., Schatten, A., Winkler, D., Tjoa, A.M. and Biffl, S. Defect prediction using combined product and project metrics: a case study from the open source “Apache” MyFaces project family. Proceedings of Software Engineering and Advanced Applications (SEAA '08), 34th Euromicro Conference, (2008), pp. 207-215.
[9] Sinovcic, I. and Hribar, L. How to improve software development process using mathematical models for quality prediction and element of six sigma methodology. Proceedings of the 33rd International Conventionions 2010 (MIPRO 2010), (2010), pp. 388-395.
[10] RadliRski, L. Predicting defect type in software projects. Polish Journal of Environmental Studies, Volume 18 (3B), (2009) pp. 311-315. [11] Staron, M. and Meding, W. Defect inflow
prediction in large software projects. E-Informatica Software Engineering Journal, Volume 4 (1), (2010), pp. 1-23.
[12] Fehlmann, T. Defect density prediction with six sigma. Presentation in Software Measurement European Forum (2009).
[13] Mittal, A. and Dubey, S.K. Defect handling in software metrics. International Journal of Advanced Research in Computer and Communication Engineering, Volume 1(3), (2012), pp. 167-170.
[14] Haider, S.W., Cangussu, J.W., Cooper, K.M.L. and Dantu, R. Estimation of defects based on defect decay model: ED3M. IEEE Transactions on Software Engineering, Volume 34 (3), (2008), pp. 336-356.
[15] Gyimothy, T., Ferenc, R. and Siket, I. Empirical validation of object-oriented metrics on open source software for fault prediction. IEEE Transactions on Software Engineering, Volume 31 (10), (2005), pp. 897-910.
[16] Thangarajan, M. and Biswas, B. Software reliability prediction model. Tata Elxsi Whitepaper, (2002).
[17] Bertolino, A. and Marchetti, E. A simple model to predict how many more failures will appear in testing. Proceedings of Quality Week Europe, (1998), Brussel, Belgium.
[18] Karcich, R.M., Cangussu, J.W. and Earl, A. System testing process behavior prediction at sun microsystem. 14th International Symposium on Software Reliability Engineering 2003 (ISSRE 2003), (2003).
[19] Weyuker, E.J., Ostrand, T.J. and Bell, R.M. Using developer information as a factor for fault prediction. Proceedings of the Third International Workshop on Predictor Models in Software Engineering (PROMISE'07), (2007), pp.8.
[20] Zimmermann, T., Nagappan, N. and Zeller, A. predicting bugs from history. Software Evolution (Software Evolution), (2008), pp. 69-88.
[21] Zawadzki, L. and Orlova, T. Building and using a defect prediction model. Presentation in Chicago Software Process Improvement Network, (2012).
[22] Wang, H., Khoshgoftaar, T.M. and Seliya, N. How many software metrics should be selected for defect prediction?. Proceedings of the Twenty-Fourth International Florida Artificial Intelligence Research Society Conference, (2011), pp. 69-74.
[23] Ostrand, T.J. and Weyuker, E.J. How to measure success of fault prediction models. Proceedings of Fourth International Workshop on Software Quality Assurance, (2007), pp. 25-30
[24] (SOQUA ’07), pp. 25-30, 2007Li, L.P. , Shaw, M. and Herbsleb, J. Selecting a defect prediction model for maintenance resource planning and software insurance. Proceedings of 5th Workshop on Economics-Driven Software Engineering Research (EDSER '03), (2003), pp. 32-37.
[25] Cavezza, D.G., Pietrantuono, R. and Russo, S. Performance of defect prediction in rapidly evolving software. Proceedings of IEEE 3rd International Workshop on Release Engineering,
(2015), pp. 8-11.
[26] D’a q, M., Lanza, M. and Robbes, R. Evaluating defect prediction approaches: a benchmark and an extensive comparison.
Journal of Empirical Software Engineering, Volume 17 (no. 4-5), (2012), pp. 531-577. [27] Wang, D., Wang, Q., Hong, Z., Chen, X.,
Zhang, L. and Yang, Y. Incorporating qualitative and quantitative factors for software defect prediction. Proceedings of the 2nd International Workshop on Evidential Assessment of Software Technologies (EAST’12), (2012), pp. 61-66. [28] Wahyudin, D., Ramler, R. and Biffl, S. A
Framework for Defect prediction in specific software project contexts. Book Section, Software Engineering Techniques, Lecture Notes in Computer Science, Volume 4980, (2011), pp. 261-274.
[29] Kim, S. Defect, Defect, defect: defect prediction 2.0. Proceedings of the 8th International Conference on Predictive Models in Software Engineering (PROMISE’12), (2012), pp. 1-2. [30] Kamei, Y. and Shihab, E. Defect prediction:
accomplishments and future challenges. Proceedings of IEEE 23rd International Conference on Software Analysis, Evolution and Reengineering (SANER), (2016), pp. 33-45.