http://www.sciencepublishinggroup.com/j/ijmpem doi: 10.11648/j.ijmpem.20170204.12
Modeling and Optimisation of Multigravity Separator for
Recovery of Iron Values from Sub Grade Iron Ore Using
Three Level Three Factor Box Behnken Design
Gottumukkala Venkateswara Rao
1, *, Ravvala Markandeya
2, Rajan Kumar
11
R&D Centre, NMDC Limited, Hyderabad, India 2
Principal, JNTUH College of Engineering, Manthani, India
Email address:
[email protected] (G. V. Rao), [email protected] (G. V. Rao) *
Corresponding author
To cite this article:
Gottumukkala Venkateswara Rao, Ravvala Markandeya, Rajan Kumar. Modeling and Optimisation of Multigravity Separator for Recovery of Iron Values from Sub Grade Iron Ore Using Three Level Three Factor Box Behnken Design. International Journal of Mineral Processing and Extractive Metallurgy. Vol. 2, No. 4, 2017, pp. 46-56. doi: 10.11648/j.ijmpem.20170204.12
Received: May 30, 2017; Accepted: July 7, 2017; Published: September 26, 2017
Abstract:
In this study, a three level, three factor Box- Behnken factorial design combined with Response Surface Methodology (RSM) for modeling of process parameters of Multi Gravity Separator (MGS) for recovery Iron values from sub grade iron ore, Deposit No. 5, Bailadila complex has been developed. The three significant operational parameters of MGS, Drum rotational speed, Drum inclination and wash water Flow rate were considered in the experimental work and all other parameters like feed percent solids, shake frequency and shake amplitude were maintained constant. The ‘as received’ sub grade iron ore sample is admixture of lump and fines and chemically assayed 40.80% Fe, 40.90% SiO2, 0.24% Al2O3 and0.22% Loss on Ignition (LOI). Experiments were conducted with representative sample ground to -100 mesh (0.152mm) as per the design matrix. The obtained results were evaluated with the Box-Behnken factorial design, RSM and also Quadratic programming (QP). Second order response functions were developed for grade (%Fe) and recovery (% yield) of the concentrate fraction. Taking advantage of quadratic programming (QP), it was observed that maximum grade of 64.00% Fe achieved at a drum inclination of 3 degrees, wash water flow rate of 6 Liters Per Minute (LPM) and at a drum rotational speed of 175 Revolutions Per Minute (RPM). Similarly a maximum concentrate recovery (Yield) of 67.87% by weight could be achieved at 5 degrees drum inclination, 2 LPM wash water flow rate and at a drum rotational speed of 225 RPM. Predicted values of responses obtained using model equations were in good agreement with the experimental values. The influence of the process variables of multi gravity separator on concentrate grade and recovery were discussed.
Keywords:
Response Surface Methodology, Box-Behnken Model, Optimisation, Multi Gravity Separator, Modeling, Bailadila and Sub Grade Iron Ore1. Introduction
With gradual depletion of the high grade iron ore reserves, it becomes obligatory on the part of the mining industry to consider exploitation and utilization of low/lean grade ores. The accumulation of low grade lumps and fines, have increased with the increase in the production of iron ore. By adopting, simple processes like washing/scrubbing, it was not possible to upgrade these ores suitable for sinter or pellet making. In the present investigation, the emphasis was on the development of a cost-effective process flow sheet to beneficiate these ores to make it suitable for user industry.
Huge reserves of (30-35 million tons) sub grade/low grade iron ores are available in the Bailadila range. This sub grade/low grade iron ore contains Banded Hematite Quartzite (BHQ), Banded Hematite Jasper (BHJ) and Banded Hematite Chert (BHC). The Fe content in these ores is very low and in the range of 35-50%.
stock for steel/pellet making, NMDC continuously making efforts to beneficiate its sub grade/ low grade ores available in its Iron ore mines of Bailadila and Donimalai. With due consideration of mineral conservation as well as effective utilization of low grade and sub grade iron ores, an attempt was made for upgrading the Sub Grade Iron Ore (SGIO) from Deposit No. 5, Bacheli, Bailadila, India. The main aim of the beneficiation of sub Grade Iron Ore is to produce suitable feed stock to Blast furnace or Direct Reduction process with optimum recovery and to use as Sinter feed or Pellet Feed.
One of the major problems of gravity based methods has been their limitation in treating particles in relatively fine size range. However application of centrifugal forces in some of the recent gravity separators (enhanced gravity separators) like Multi Gravity Separator (MGS) are proved to be effective for fine and ultra fine material (Singh R et al 2007). As the liberation size of ore and gangue particles for SGIO is around 100-150microns, it is proposed to use enhanced gravity separation (Multi Gravity Separator – MGS). Aslan (2008a and 2009) used MGS for chromite concentration and optimisation of parameters. Bandopadyaya (2000) studied MGS as a concentrating devise for fine particle. Cieck et al (2002) used MGS for beneficiation of Turkish fine chromite tailings.
Rao et al (2010, 2012) studied the process amenability studies of sub grade iron ore, BHQ by using Multi gravity Separator, Flotex Density separator. Roy (2009) used MGS for increasing the concentrate recovery from fine iron ore particles.
Response surface Methodology gaining more importance for both modeling and optimisation of different process engineering fields (Gunaraj & Murugan 1999, Ajay et al
2007)).
Evolution and use of Multi Gravity Separator (MGS) is available in literature (Chan 1991 and 1993). MGS was used to beneficiate chromite and chromite tailings (Ozdag 1994, Nermin 1999, Ozkan 2001 and Sunil Kumar 2012). Multi gravity separator was also used to separate graphite from lead concentrate (Patil 2000 and Bhaskar 2002).
The objective of this paper is to apply a Box- Behnken design, Response surface methodology to develop a mathematical model to represent the behavior of the system as a convincing function of process parameters.
2. Material and Methods
2.1. The Sample
The ‘as received’ sample of Sub Grade Iron Ore (SGIO) from Bacheli complex, Bailadila, Chattisgarh, India is an admixture of lump, fines and friable ore; where the fines contributes in higher proportion (up to 36%). The size of the ‘as received’ sample varies from 150mm to less than 1mm. The lump samples show alternate bands of iron and quartz.
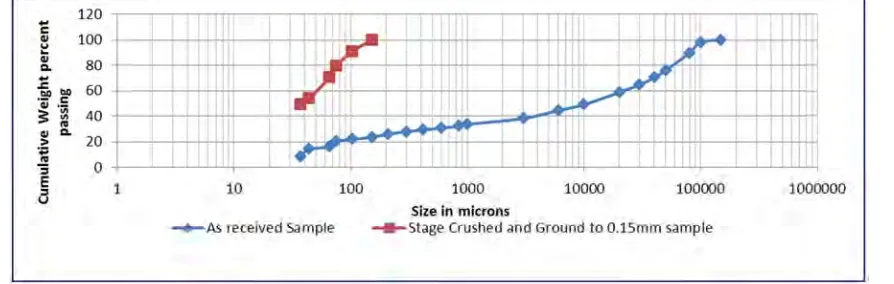
The ‘as-received’ sample was mixed thoroughly and representative samples were drawn for size analysis, characterisation, Screen Assay Analysis, evolution of physical properties and beneficiation studies. The chemical analysis was carried out by standard wet chemical analytical procedure and Induction Coupled Plasma (ICP) Model JY2000-2 and Make JOBINYVON. Size analysis of ‘as received’ and stage crushed and ground sample was presented in Figure 1 and the chemical analysis in Table 1.
Figure 1. Size analysis of ‘as received’ and Stage crushed and Ground sample.
Table 1. Chemical analysis of ‘as received’ ROM sample.
Constituent Fe FeO SiO2 Al2O3 LOI P S TiO2 CaO MgO MnO
Assay% 40.80 2.70 40.90 0.24 0.22 0.05 <0.01 0.091 0.119 0.110 0.045
Mineralogical studies indicate that the main ore mineral is Hematite and main gangue mineral is Quartz. The liberation studies indicate that the average particle size for liberation is around 100microns.
A representative portion of ‘as received’ sample was stage crushed and ground to less than 0.15 mm (150microns). A portion of the representative ground sample was subjected to
Figure 2. Distribution of Iron and silica in various size fractions of stage crushed and ground -0.150 mm product.
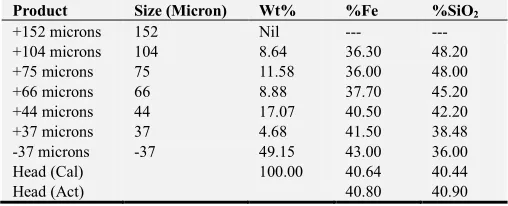
Table 2. Screen assay analysis of stage crushed and ground to 0.150 mm sample.
Product Size (Micron) Wt% %Fe %SiO2
+152 microns 152 Nil --- ---
+104 microns 104 8.64 36.30 48.20
+75 microns 75 11.58 36.00 48.00
+66 microns 66 8.88 37.70 45.20
+44 microns 44 17.07 40.50 42.20
+37 microns 37 4.68 41.50 38.48
-37 microns -37 49.15 43.00 36.00
Head (Cal) 100.00 40.64 40.44
Head (Act) 40.80 40.90
From Table 2 and Figure 2 it can be observed that Fe is in the range of 36% to 43% whereas SiO2 from 36% to 48% in
individual size fractions.
2.2. Multi Gravity Separator
The Multi Gravity Separator (MGS) supplied by Richard Mozley Ltd, UK (Presently known as Salter Cyclones) with a Capacity of 200 kg/hour (Model: C 900/presently known as SCMG1) which can treat 500 micron to 1 micron size, was used in this experimental work. Photograph of Multi Gravity Separator was shown in Figure 3. Cross section and parts of Multi Gravity Separator is shown in Figure 4. Its structure and operating conditions were given elsewhere (MGS Application Guide 1991; Chan et al. 1991). The feed to the MGS was prepared by mixing 500 grams of dry sample with one liter of water that gives 33.33% solids concentration (by weight). The mixture was stirred continuously to maintain uniform suspension. The main operating variables are shake amplitude, shake frequency, drum rotational speed (RPM), drum angle of inclination, wash water (LPM) and feed percent solids. The MGS variables were adjusted at the required level as per the experimental design. The feed slurry was then fed to the MGS feed vessel at predetermined rate while MGS is in operation. The MGS was kept running until the material flow finished, which took about 5 minutes and the MGS was stopped. Upper cover of the separator was removed and remaining material in the drum was thoroughly washed. Heavy product, which was collected through front
launder, referred to as Concentrate and light product, which was collected through back launder, referred to as Tails. In the present study drum rotational speed, drum inclination and wash water flow rate are chosen as variable and all other parameters are kept constant. A sinusoidal shake with amplitude varying between 12 mm to 25mm is superimposed upon the motion of the drum in an axial direction. The shake frequency ranges between 2 to 6 cps. The shake amplitude 18mm and the shake frequency is 4 cycles per second (cps) are maintained constant throughout the experimentation.
Figure 3. Photograph of a Multi Gravity Separator.
2.3. Response Surface Methodology
Response Surface Methodology (RSM) is a collection of statistical and mathematical methods that are useful for modeling and analyzing problems. In this technique, the main objective is to optimize the response surface that is influenced by various process parameters. The RSM also quantifies the relationship between the controllable input parameters and the response surfaces.
The design procedure of RSM is
I. Designing of experiments for adequate and reliable measurement of the response.
II. Developing a mathematical model of the second order response surface with the best fittings.
III.Finding the optimal set of parameters that produces the maximum or minimum value of a response.
IV.Representing the direct and interactive effects of process parameters through two or three dimensional plots.
If all variables are assumed to be measurable then the response surface can be expressed as:
y= f(x1, x2, x3……. xk) (1)
where y is the output and xi the variables of action called
factors. For the three-level three-factorial Box–Behnken experimental design, a total of 15 experimental runs are required. The objective is to optimize the response y with an assumption that the independent variables are continuous and controllable throughout the experimentation. It is also required to find a suitable approximation for the true functional relationship between independent variables and the response surface, typically a second-order model is utilized in response surface methodology.
= o + ∑ + ∑ + ∑ ∑ + Ɛ (2)
where x1, x2,…, xk are input factors which influence the
response y; b0, bii (i=1, 2,…, k), bij (i=1, 2,… k; j=1, 2,…k)
are unknown parameters and ε is a random error. The β coefficients, which should be determined in the second-order model, are obtained by the least square method. Generally equation (2) can be written in matrix form.
Y = bX+Ɛ (3)
where Y is defined to be a matrix of measured values, X to be a matrix of independent variables. The matrix b and ε consist of coefficients and errors, respectively. Further, the estimation of coefficients of Eq. (3) can be obtained by least
square method (Gunaraj et al 1999).
b= (XTX)-1 XTY (4)
where XT is the transpose of the matrix X and (XTX)−1 is the inverse of the matrix XTX. The coefficients, i.e. the main effect (bi) and two factors interactions (bij) can be estimated
from the experimental results by computer simulation programming applying the least squares method using Matlab 7.1.
2.4. Testing and Test Results
In the present study, the Box–Behnken factorial design was used to find out the relationship between the response functions (grade and recovery of the concentrate) and three variables of the multi gravity separator (Drum inclination, wash water flow rate and Drum rotational speed). All the experiments were conducted using a Mozley laboratory C 900 MGS supplied by Richard Mozley, UK. (Presently known as Salter cyclones and Model is SCMG1). Feed to MGS was prepared by mixing 500 grams of dry sample with one liter of water which gives 33.33% solids concentration (by weight). The mixture was stirred continuously to maintain uniform suspension. The MGS variables were adjusted at the required level as per the experimental design. The feed slurry was then fed to the MGS feed vessel at a constant flow rate while MGS was in operation. The machine was kept running until the material flow is finished, which took about 2-3 minutes and cleaned thoroughly for the next experiment. Upper cover of the separator was removed and remaining material in the drum was thoroughly washed. Tailing (light product) was collected through back launder and Concentrate (heavy product) through front launder. The variables and their levels considered for the test program are shown in Table 3. The products of each test were collected dried, weighed and analyzed for the grade and recovery values. The obtained results were used for the computer simulation programming applying the least square method using mathematical software package (Matlab 7.1).
The model based on Eq. (2) is of the following form:
Y = β0 + β1X1 + β2X2 + β3X3 + β11X1 2
+ β22X2 2
+ β33X3 2
+ β12X1X2 + β13X1X3 + β23X2X3 (5)
where β0 is the model constant; X1, X2 and X3 are
independent variables; β1, β2, β3 are linear coefficients; β12,
β13, β23 are cross product coefficients and β11, β22, β33 are the
quadratic coefficients.
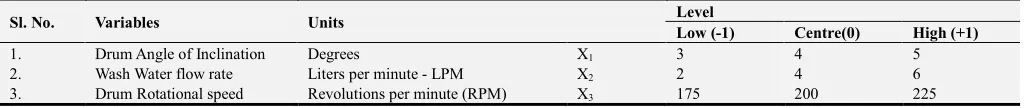
Table 3. List of variables and their levels.
Sl. No. Variables Units Level
Low (-1) Centre(0) High (+1)
1. Drum Angle of Inclination Degrees X1 3 4 5
2. Wash Water flow rate Liters per minute - LPM X2 2 4 6
3. Results and Discussion
The experiments were carried out using the multi gravity separator to separate the Iron values from sub grade iron ore. The variables and their levels are shown in Table 3. The experimental results of the test program along with their conditions were tabulated in Table 4. It was observed that rotational speed of the drum had great influence on the grade and recovery of the concentrate fraction. It was possible to achieve the concentrate grade of 64.00% Fe with a recovery of 9.55% by weight at 3 degrees of Drum inclination, 4 liter per minute (LPM) wash water and 175 revolutions per minute (RPM) drum rotational speed. The highest recovery
of 67.87% by weigh with a grade of 53.67% Fe at 5 degrees drum inclination, 2 LPM wash water and 225 RPM respectively. It was observed that the grade of the concentrate decreased as the drum rotational speed (RPM) increased from 175 to 225RPM and recovery (yield) increased. As the wash water flow increased from 2 LPM to 6 LPM recovery decreased and grade increased. It is also observed that the recovery decreased as the drum angle of inclination increased from 3 degrees to 5 degrees where as grade increased. The model equation for the recovery (YRecovery) and grade (YGrade)
of the concentrate fraction of the MGS are presented in Equations 6 and 7 respectively.
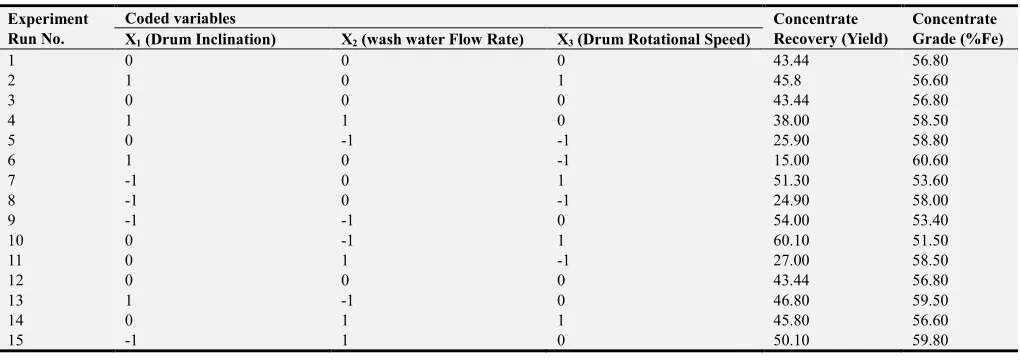
Table 4. Experimental results of coded and uncoded variables.
Experiment Run No.
Coded variables Concentrate
Recovery (Yield)
Concentrate Grade (%Fe) X1 (Drum Inclination) X2 (wash water Flow Rate) X3 (Drum Rotational Speed)
1 0 0 0 43.44 56.80
2 1 0 1 45.8 56.60
3 0 0 0 43.44 56.80
4 1 1 0 38.00 58.50
5 0 -1 -1 25.90 58.80
6 1 0 -1 15.00 60.60
7 -1 0 1 51.30 53.60
8 -1 0 -1 24.90 58.00
9 -1 -1 0 54.00 53.40
10 0 -1 1 60.10 51.50
11 0 1 -1 27.00 58.50
12 0 0 0 43.44 56.80
13 1 -1 0 46.80 59.50
14 0 1 1 45.80 56.60
15 -1 1 0 50.10 59.80
Y Recovery = 43.44- 4.338X1-3.237X2+13.775X3-0.832X12+4.617X22-8.358X32-1.225X1X2+1.1X1X3-3.85X2X3 (6)
YGrade = 56.8+ 1.3X1+1.275X2 -2.2X3+0.925X12+0.075X22-0.525X32-1.85X1X2+0.1X1X3+1.35X2X3 (7)
As per the derived equations (Eq. 6 and Eq. 7) the effect of main variables (X1, X2 and X3), their interaction effects
(X1X2, X1X3 and X2X3) and quadratic effects (X12, X22 and
X32) can be explained based on positive or negative sign
before the coefficient. The concentrate recovery (Yield) increases as the drum speed (X3) increases, where as
recovery decreases as the drum inclination (X1) and wash
water flow rate (X2) increases. The interaction effects (X1X2,
X1X3 and X2X3) and quadratic effects (X12, X22 and X32) can
also be explained in the same manner. The same is also applicable for derived equation for concentrate grade.
Equations (6) and (7) were derived from Equation (2) for the response factors for grade, and recovery of the concentrate from which the response factors at any regime in the interval of our experimental design can be calculated from these equations.
From Equation (6), it was analyzed that the term with a positive sign indicates their synergistic effect on grade while the term with a negative sign denotes antagonistic effect. This implies that the terms drum rotational speed (X3), square
term of wash water flow rate (X2) and interaction effect of
drum inclination and drum rotational speed (X1X3) tends to
increase the concentrate yield while the terms Drum inclination (X1), wash water flow rate (X2), square term of
drum inclination (X1), square term of drum rotational speed
(X3), interactional effects of drum inclination- wash water
flow rate (X1X2) and wash water flow rate- drum rotational
speed (X2X3) decreases the recovery (yield).
From equation (7), the terms drum inclination (X1), wash
water flow rate (X2), square term of drum inclination (X1 2
), square term of wash water flow rate (X2
2
), interactional effects of drum inclination- drum speed (X1X3) and wash
water flow rate – drum rotational speed (X2X3) increases the
concentrate grade, where as drum rotational speed (X3),
square term of drum rotational speed (X32) and interactional effect of drum inclination wash water flow rate (X1X2)
decreases the concentrate grade.
An Analysis of Variance (ANOVA) table provides statistics about the overall significance of the developed model. The sum of squares for the model is determined as
= ² − ( ²/$)
& &
where yi is the model prediction for the i th observation and n
sum-of-squares of errors divided by the number of observation and is expressed as
$ = ' (
The F-test for the model indicates the level of significance of the model prediction. This tests the full model against a model with no variables and with the estimate of the dependant variable being the mean of the values of the dependant variables. The F-value is the ratio of mean model sum of square by the mean error sum of squares and is expressed as
) − * + =, +, + + + - - $.$.
The ANOVA for all three response models are given in Table 5. The F-value of grade and recovery are 474.10 and 293.30 respectively at higher than 99.99% confidence level. The Prob >F for both the model are acceptable (less than 0.05) which indicated the developed models were significant. Experimental results and the predicted values obtained using model Eqs. (6) and (7) are tabulated in Table 6. Also the relationship between the predicted and observed value of the responses is shown in Figure 4, which shows that the fit is quite good as the R2 value for grade and recovery of the concentrate fraction of the MGS are 0.9988 and 0.9981 respectively. The standard deviations of both the predicted models are 0.14491 and 0.90967 for grade and recovery respectively which are acceptable values. Further, the residual plots for the predicted values of grade and recovery are plotted in Figure 5. From the Figure 5, it can be observed that, the residual values are uniformly distributed. Hence, it can be seen that the errors for both grade and recovery are well distributed. In order to check the validity of the proposed equations within the range of the variables selected, a few random experiments were also carried out following the afore-mentioned methodology. The comparisons between the actual and model predicted data at different combinations of variables are presented in Table 7. It is evident from Table 7, the proposed quadratic equations to predict the actual
grade and recovery (% Fe) of concentrate fraction of MGS is within average errors of 3.31 and 4.42%, respectively. Therefore, it may be considered that the proposed quadratic (Eqs. 6 and 7) are valid to predict the responses within the range of the variables selected. Further the model equations were optimized using quadratic programming of the mathematical software package (Mini Tab 17) to maximize the grade and recovery of the concentrate fraction. Any deviation from the operating range of the process variable such as beyond the higher/lower level would affect the performance of the MGS operation. Keeping this constraint, optimization of the MGS process variables for maximum grade and recovery of Fe in the concentrate fraction was obtained using quadratic programming of the mathematical software package Mini Tab 17. Observed and predicted values of concentrate yield and concentrate grade (%Fe) are presented in the Figure 6(a) and 6(b) respectively.
Table 5. Analysis of variance (ANOVA) for grade and recovery.
Statistics Grade (%Fe) Recovery (Wt%)
Sum of squares 89.6043 2184.37
Mean sum of squares 9.956 242.71
F Value 474.10 293.3
Probability of F 0.0036 <0.0001
R2 0.9988 0.9981
Standard deviation 0.14491 0.90967
i) Maximum grade of 62.60% of Fe of concentrate fraction can be achieved by optimizing the process variables at
a)Angle of inclination of drum: 5 degrees b)Wash Water: 2 LPM
c)Speed of the drum: 175 RPM.
ii) Maximum recovery of 61.74% concentrate fraction can be achieved by optimizing the process variables at
a) Angle of inclination of drum: 3 degrees b) Wash Water:2 LPM
c) Speed of the drum: 225 RPM.
It was desired to investigate the behavior of the multi gravity separator concentrator to the simultaneously changing operating parameters utilizing the aforementioned empirical model equations and discussed further.
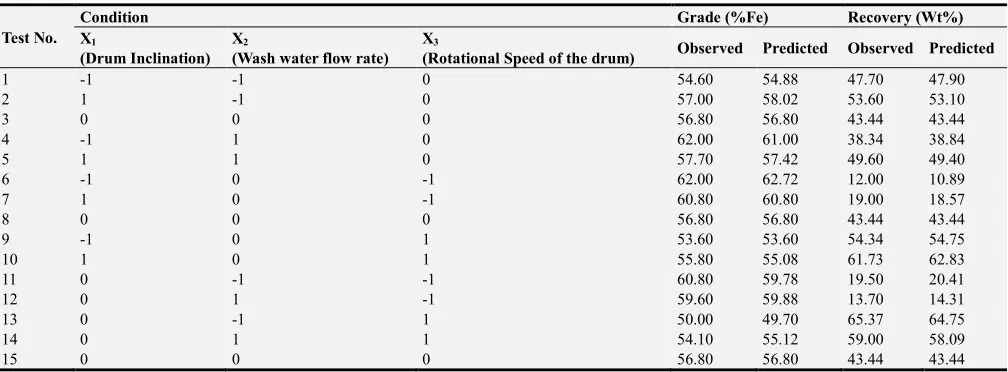
Table 6. Observed and predicted values of concentrate fraction grade and recovery.
Test No.
Condition Grade (%Fe) Recovery (Wt%)
X1
(Drum Inclination) X2
(Wash water flow rate) X3
(Rotational Speed of the drum) Observed Predicted Observed Predicted
1 -1 -1 0 54.60 54.88 47.70 47.90
2 1 -1 0 57.00 58.02 53.60 53.10
3 0 0 0 56.80 56.80 43.44 43.44
4 -1 1 0 62.00 61.00 38.34 38.84
5 1 1 0 57.70 57.42 49.60 49.40
6 -1 0 -1 62.00 62.72 12.00 10.89
7 1 0 -1 60.80 60.80 19.00 18.57
8 0 0 0 56.80 56.80 43.44 43.44
9 -1 0 1 53.60 53.60 54.34 54.75
10 1 0 1 55.80 55.08 61.73 62.83
11 0 -1 -1 60.80 59.78 19.50 20.41
12 0 1 -1 59.60 59.88 13.70 14.31
13 0 -1 1 50.00 49.70 65.37 64.75
14 0 1 1 54.10 55.12 59.00 58.09
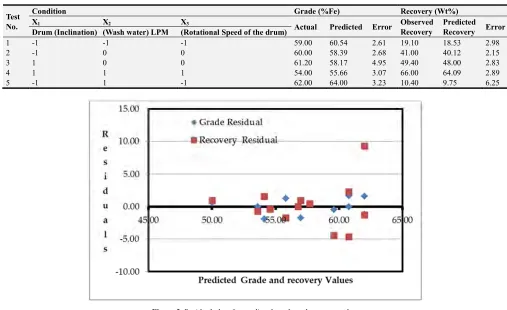
Table 7. Comparative data at random experimental conditions for validation purpose.
Test No.
Condition Grade (%Fe) Recovery (Wt%)
X1 X2 X3
Actual Predicted Error Observed Recovery
Predicted Recovery Error Drum (Inclination) (Wash water) LPM (Rotational Speed of the drum)
1 -1 -1 -1 59.00 60.54 2.61 19.10 18.53 2.98
2 -1 0 0 60.00 58.39 2.68 41.00 40.12 2.15
3 1 0 0 61.20 58.17 4.95 49.40 48.00 2.83
4 1 1 1 54.00 55.66 3.07 66.00 64.09 2.89
5 -1 1 -1 62.00 64.00 3.23 10.40 9.75 6.25
Figure 5. Residual plots for predicted grade and recovery values.
3.1. Effect of Process Variables on Recovery (Yield) of Concentrate Fraction
Similarly Eq.7 illustrates the model for estimating the recovery (Yield) of the concentrate fraction. It is envisaged that among the main effects Drum rotational speed (RPM) and angle of inclination as well as square of wash water and drum rotational speed has considerable effect on the separation. Among the interfacial effects angle of inclination and wash water flow rate have considerable effect on recovery of the concentrate fraction.
Figure 8 and 10 shows the effect of wash water flow rate on concentrate recovery at 3 degrees angle of inclination and 5 degrees angle of inclination respectively. From the Figure 8 and 10, it can be observed that, as the wash water flow rate increases the recovery decreases at all drum rotational speeds (175 RPM, 200 RPM and 225 RPM). Figure 9 and 11 shows the effect of wash water flow rate on concentrate grade at 3 degrees angle of inclination and 5 degrees angle of inclination respectively. From the Figure 9 and 11, it can be observed that, as the wash water flow rate increases the concentrate grade increases at all drum rotational speeds (175 RPM, 200 RPM and 225 RPM).
It may be noted angle of inclination and wash water flow rate and interaction between angle of inclination and wash water flow rate, wash water flow rate and drum rotational speed are less significant. The empirical models were further utilised for describing the effect of each variable at different combination variables on recovery of concentrate fraction are
shown in Figure 12, 13, 14 and 15.
The effect of angle of inclination and wash water flow rate on concentrate recovery at centre level of the drum inclination is shown in Figure 12. It is observed that higher concentrate recovery both at lower and higher level of drum inclination at both lower and higher wash water flow rate. The recovery of concentrate fraction decreases up to a certain extent and then increases.
Figure 16 and 18 shows the effect of drum rotational speed at different angle of inclination and wash water flow rates on concentrate recovery (yield).
3.2. Effect of Process Variables on Concentrate Grade (% Fe)
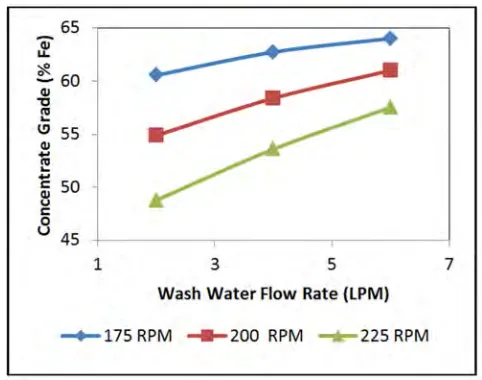
From Eq. 6, it was observed that the drum rotational speed and Wash water flow rate as well as the square of angle of inclination have significant effect on grade of the concentrate fraction. Among the interactional effects, interaction between angle of inclination and wash water has significant effect on grade (% Fe) of the concentrate fraction whereas the other sources (such as angle of inclination, square of wash water and rotational speed, interactional effects of angle of inclination and wash water) have very small effect. For explaining further, the empirical models were utilized for describing the effect of each variable at different combination variables on grade of the concentrate fraction and shown in Figure 9 and 11. The grade of the concentrate increased as wash water flow rate increased from 2 LPM to 6 LPM.
of angle of inclination (6 degrees) for 6LPM wash water where as lower grade is obtained for 2 LPM wash water at 4o drum inclination. It can also be observed that, with increase in wash water and drum inclination grade increased. This may be explained as there was an increase in the angle of inclination, the separation time for the individual particle decreased which in turn influenced by the centrifugal force and reported to the tailing fraction. Figure 9 explains the effect of wash water at different angle of inclinations on grade (% Fe) of concentrate fraction of multi gravity separator. As there is an increase in the angle of inclination, the grade of the concentrate fraction increased and the maximum grade is observed at low angle of inclination. The grade of the concentrate fraction increases as increase in the angle of inclination.
Figure 6. Relationship between observed and predicted values of concentrate yield (weight%).
Figure 7. Relationship between observed and predicted values of Concentrate grade (% Fe).
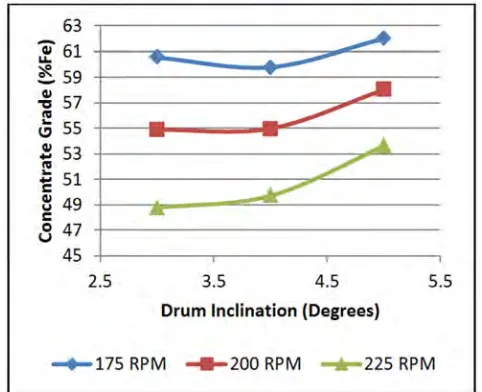
It is observed from Figure 9 and 11 that, as drum rotational speed increases there is decrease in the grade of the concentrate fraction. This is due to recovery of unwanted minerals. At lower values of drum rotational speed, the concentrate grade is higher due to better separation. At higher drum rotation speeds, higher centrifugal forces are generated on heavier and fine iron ore particles along with coarse lighter particles. There by increasing the recovery of iron and decreasing the grade. The bed formed by fine particle is difficult to be influenced by wash water effects. Figure 11 explains the effect of drum rotational speed at different angle of inclinations. It can be observed that at the lower wash water flow rate the concentrate grade continuously decreases as the drum rotational speed increases where as for higher wash water flow rate the grade first increases up to 200 RPM and beyond this point the concentrate grade decreases.
Figure 13 and 15 explains the effect of drum inclination on concentrate grade. As there is increase in drum inclination the recovery of concentrate decreased.
Figure 8. Effect of wash water flow rate on Concentrate Yield at 3 degrees Drum Inclination.
Figure 10. Effect of Wash Water Flow Rate on Concentrate Yield at 4 degrees Drum Inclination.
Figure 11. Effect of Wash Water Flow rate on Concentrate Grade at 4 degrees Drum Inclination.
Figure 12. Effect of Drum Inclination on Concentrate Yield at 2 LPM Wash Water Flow Rate.
Figure 13. Effect of Drum Inclination on Concentrate Recovery at 2 LPM Wash Water Flow Rate.
Figure 14. Effect of Drum Inclination on Concentrate Recovery (Yield) at 6 LPM Wash Water Flow Rate.
Figure 15. Effect of Drum Inclination on Concentrate Grade at 6 LPM Wash water Flow rate.
Figure 12 and 14 explains the effect of drum inclination on recovery of concentrate.
Figure 16. Effect of Drum Speed on Concentrate Yield at 2 LPM Wash Water Flow Rate.
Figure 17. Effect of Drum Speed on Concentrate Grade at 2 LPM Wash Water Flow Rate.
Figure 18. Effect of Drum Speed on Concentrate Yield at 6 LPM Wash Water Flow Rate.
Figure 19. Effect of Drum Speed on Concentrate Grade at 6 LPM Wash Water Flow Rate.
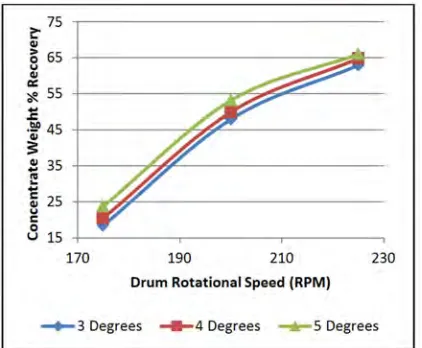
Figure 17 and Figure 19 shows effect of drum rotational speed on concentrate grade (%Fe). As the drum rotational speed increased the concentrate grade decreased. The effect of drum rotational speed at different angle of inclination is shown in the Figure 16, 17, 18 and 19 which envisages that the maximum recovery is reported at higher level of drum rotational speed and higher angle of inclination. It can also be noted that there is a marginal effect on recovery of concentrate fraction at lower wash water. It is observed that the higher concentrate recovery obtained at higher drum inclination. Also it is noted that, there is a marginal change in recovery with the change in angle of inclination at higher level of drum rotation. It is noticed that, as there is increase in the drum rotational speed, recovery of concentrate fraction increases at higher level of angle of inclination.
4. Conclusion
Iron values from sub grade Iron Ore can be recovered by optimum combination of process parameters of MGS. The ‘as received’ sample assayed 40.80% Fe and 40.90% SiO2 and all other constituents are well within the critical limits. Hematite is the main ore mineral and Quartz is the lone gangue mineral. The three process parameters considered in this study were Drum inclination, Wash water and drum rotational speed.
In this study, the effects of Drum inclination, wash water flow rate and Drum rotational speed of Multi gravity separator were investigated using Response Surface Methodology of Box – Behnkem Model, for prediction of concentrate grade and recovery while beneficiation of Sub Grade Iron Ore. The mathematical model equations were derived for grade and recovery of sub grade iron ore using set of experimental data and a mathematical software package (Mini Tab 17).
the process parameters, maximum grade and recovery were found. The maximum grade that can be achieved was 64.00% Fe at 175RPM drum speed, 3 degrees drum inclination and 6 LPM wash water flow rate, whereas the maximum recovery of concentrate achieved was 67.87% by weight at 225 RPM drum speed, 5° drum inclination and 2 LPM wash water flow rate. The derived models were further used to explain, the effect of process parameters on performance of the MGS while treating SGIO. Predicted values of grade and recovery obtained using model equations were in good agreement with the experimental values of grade and recovery (R2 values for Recovery and Grade are 0.97 and 0.99 respectively).
This study proved that Box–Behnken design, response surface methodology could efficiently be applied for modeling of some sub grade iron ore from Bailadila and that it is economical way of obtaining the maximum amount of information in a short period of time and with the fewest number of experiments.
Acknowledgements
The authors wish to thank Shri N. K. Nanda, Director (Technical), NMDC Limited for his approval for conducting studies and permitting to publish this paper. The authors wish to acknowledge the following group of individuals for their assistance in executing the test work: Prof. G V S Nageswara Rao Department of Metallurgical & Materials Engineering, NIT Warangal, Shri Basant Rath AM (Geology), NMDC, Shri B. C. Hazela DGM (Chem) NMDC and his team for their valuable assistance and suggestions. The support and services provided by staff of R&D Centre are also duly acknowledged.
References
[1] Ajay B. Solanki, Jolly R. Parikh and Rajesh H. Parikh
“Formulation and Optimisation of Piroxicam Proniosomes by 3- Factor, 3- Level Box – Behnken Design”, AAPS PharmaSciTech 2007: 8(4) Article 86, pp E1 – E7.
[2] Aslan, N, H Kaya, 2009. “Beneficiation of chromite concentration waste by multi gravity separator and high intensity induced roll magnetic separator”, The Arabian journal for Science and Engineering, 34 (2B) pp 285-297. [3] Aslan, N, 2008a, “Multi-objective optimization of some
process parameters of a multi gravity separator for chromite concentration”, Separation and Purification Technology, 64, pp 237-241.
[4] Aslan,N., 2008 ”Application of response surface methodology and central composite rotatable design for modelling and optimisation of multi gravity separator for chromite concentration”, Powder Technology, 185, pp80-86.
[5] Bandopadyaya, A., 2000. “Multi gravity separator – An equipment for separation of fines”, Processing of Fines (2), NML Jamshedpur, pp 81-92.
[6] Bhaskar K U, B. Govindarajan, J P Barnwal, R Venugopal, M R Jakhu, T C Rao, “Performance and modeling studies of an MGS for graphite rejection in a lead concentrate”, International Journal of Mineral Processing., 67 (1-4) (2002),
59-70.
[7] Chan B S, Mozley R H and Childs G J C “Extended trails with the High Tonnage Multi Gravity Separator”, Minerals Engineering 4(1991), pp 489-496.
[8] Chan B S, Mozley R H and Childs G J C, “ The Multi Gravity separator (MGS): A Mine scale Machine”, Richard Mozley Limited, 1993
[9] Çiçek T, and I. Cöcen, “Applicability of Mozley Multi-Gravity Separator (MGS) to Fine chromite Tailings of Turkish Chromite Concentrating Plants”, Minerals Engineering,
15(2002), pp. 91–93.
[10] Gunaraj,V & Murugan, N, 1999, “Application of Response Surface Methodology for predicting weld base quality in submerged arc welding of pipes”, Journal of Materials Processing Technology, Vol. 88, pp 266-275.
[11] Nermin GENCE, “Beneficiation of Elazig- Kefdag Chromite by Multi gravity separator”, Transactions of Journal of Engineering and Environmental Science 23 (1999), pp 473-475.
[12] Ozdag H, “Enrichment of chromite from slimes and tailings of shaking tables by multi gravity separator”, Innovation of Mineral Processing, Sudbury, Canada, 1994, p. 267.
[13] Ozkan S G, Ipekoglu B, “Concentration Studies on Chromite Tailings by Multi Gravity Separator”, 17th International Mining Congress and Exhibition IMCET), Turkey 2001, 765-768.
[14] Patil, D. P., Govindarajan, B., Rao, T. C., Kohad, V. P., Gaur, R. K., Plant trials with the multi-gravity separator for reduction of graphite. Minerals Engineering, 2000, 12, 1127-1131.
[15] Rao, G. V. et al., 2012, “Process amenability studies of sub grade iron ore from Bacheli complex, Bailadila sector, India”, XXVI IMPC 2012 Proceedings, New Delhi, India. Paper No.793, pp 1842-1860.
[16] Rao, G. V et al, 2010, “Beneficiation of BHQ from Bacheli, Bailadila, Chattisgarh, India” XI International Seminar on Mineral Processing Technology (MPT-2010), NML Jamshedpur, December 2010.
[17] Raissi, S, 2009, “Developing New processes and optimizing performance using Response Surface Methodology”, World Academy of science, Engineering and Technology, Vol 49, pp1039-1042.
[18] Roy, S., 2009, “Recovery improvement of fine iron ore particles by multi gravity separation”, The Open Mineral Processing Journal, 2, pp 17-30.
[19] Singh R, Bhattacharyya P, Bhattacharyya KK, “ Studies on recovery of mineral values using an enhanced gravity separator”, Advanced Gravity Seoaration (AGS), NML Pub, pp 47-56.
[20] Sunil Kumar Tripathy, Yanamandra Rama Murthy, Vilas Tathavadkar and Mark Bernad Denys, “Efficacy of Multi Gravity Separator for concentrating Ferruginous chromite ore, Journal of Mining and Metallurgy, 48A (1) (2012) 39-49. [21] Yerriswamy P, J. P. Barnwal, B. Govindarajan, B K Gupta and T