Escaping Ion Measurement with High Time Resolution during
Bursting Modes Induced by Neutral Beam Injection on CHS
Kouji SHINOHARA, Mitsutaka ISOBE
1), Douglass S. DARROW
2), Akihiro SHIMIZU
1),
Kenichi NAGAOKA
1)and Shoichi OKAMURA
1)Japan Atomic Energy Agency Naka, Ibaraki 311-0193, Japan
1)National Institute for Fusion Science, Toki, Gifu 509-5292, Japan 2)Princeton Plasma Physics Laboratory, Princeton, New Jersey, 08543, USA
(Received 16 April 2007/Accepted 10 August 2007)
A bursting mode, whose time scale is a few milliseconds, is excited in low density neutral beam injected plasmas in the compact helical system. A scintillator-based probe equipped with a high speed video camera has been used to investigate the energetic ion losses induced by this fast evolving mode. This instrument reveals loss in a region of the gyroradius and the pitch angle space that occurs only during a burst. Namely, it was found that the bursting mode induces the transport of energetic ions to the region where the energetic ions cannot exist without such an enhanced transport. The dependence of the newly observed loss on the electron density and the neutral beam injected power was also investigated.
c
2007 The Japan Society of Plasma Science and Nuclear Fusion Research
Keywords: energetic ion, escaping ion measurement, beam driven mode, heliotron/torsatron device, magnetic confinement
DOI: 10.1585/pfr.2.042
1. Introduction
The enhanced transport of alpha particles by instabil-ities can cause the degradation of the performance of a fusion reactor and may also damage the first wall. Con-versely, some authors suggest application of these insta-bilities, sometimes called “α-channeling” [1]. Since in-stabilities induced by energetic ions can cause the en-hanced transport of energetic ions efficiently through wave-particle interaction, the understanding of the insta-bility induced by energetic ions is important.
Bursting modes were observed in the neutral beam (NB) injected plasmas and the enhanced transport of en-ergetic ions induced by the bursting modes was investi-gated [2–5]. It is considered that the bursting mode is a feature of the nonlinear wave-particle interaction between the damping of the background dissipation and the drive of energetic ions. Since it is expected that the nonlinear wave-particle interaction is a key mechanism to determine the saturation level of the mode induced by energetic ions, the understanding of the wave-particle interaction during bursting modes will help us to predict the behavior of mode induced by energetic ions in a fusion reactor.
Bursting modes during a NB injected plasma were observed in the compact helical system (CHS) as well as in tokamaks, and the enhanced energetic ion transport by these mode was also observed [6]. The mode-induced en-ergetic ion transport was investigated using a scintillator-based lost ion probe (LIP) [7, 8]. The LIP can measure the temporal evolution of both the gyroradius,ρ= √2mE/qB,
author’s e-mail: [email protected]
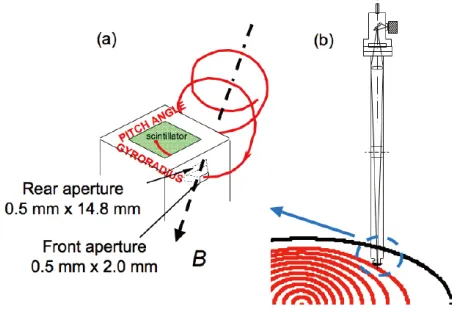
and the pitch angle, χ = arccos(v/v), of energetic ions, which enter from a set of apertures placed between a plasma and the first wall (Fig. 1), wherem, E, andqare the mass, energy, and charge of the ion, respectively,Bis the magnetic field strength at the position of the aperture, vis the velocity component parallel to the direction of the
Fig. 1 (a) Schematic view of an LIP. The ions that pass the two apertures, one behind the other, hit the scintillator screen and emit light. (b) Poloidal section view of the LIP and its optics as installed on CHS. A lens, mirror, and imag-ing fiber optic bundle carry the screen image to a video camera. The LIP is at a major radius of 1.2 m. At the toroidal position where the probe is inserted, the poloidal cross section of the plasma is an ellipse with its major axis horizontal.
c
magnetic field, andv = √2E/m. The parallel velocities of co-injected beam ions are opposite to the direction of the magnetic field. Thus, we define co-going ions as hav-ing a pitch angle larger than 90 degrees and counter-gohav-ing ions as having a pitch angle smaller than 90 degrees in this paper. The LIP is placed at the position comparable to the limiter position or the similar obstacle, e.g. the RF antenna. Only energetic ions on orbits that do not intersect the ob-stacles (the geometrically selected energetic ions) can en-ter into the aperture of the LIP. These lost energetic ions are designated the “primary loss ions.” However, in this work we have found a component of the fast ion loss that is present only during the MHD activity. This component occurs on orbits which would be blocked by the obstacles if it were not for the perturbing effect of the MHD on the fast ion orbits. By concentrating on this component, the LIP can be used as a diagnostic of energetic ion transport.
The time resolution of the detailed 2D measurement in the gyroradius and the pitch angle space is determined by a framing rate of the video camera that records the luminous images produced by the ions striking the ZnS (Ag) scintil-lator plate. The time duration of a bursting mode is about 1 ms. However, the framing rate for the original camera of an LIP on CHS was 30 Hz, namely the time resolution was about 33 ms [9–12]. Thus, the detailed response of escaping ions could not be investigated during the event by using the original camera. Recently, we have installed the fast camera system on LIP on CHS [13]. Using the new system, we have investigated the escaping ion behav-ior during such a short-time scale bursting event in order to enhance the understanding of the wave-particle interac-tion. Here, we will present the experimental results using this fast camera system. In the second section, we describe 1) the experimental setup briefly, 2) the newly observed fast evolving loss, and 3) the dependence of the newly ob-served loss on the electron density and the injected power. In the third section, the property of the loss mechanism is discussed. At last, we summarize this report.
2. Experimental Result
2.1
Experimental setup
The experiments are performed with the following magnetic configuration. The position of the vacuum mag-netic axis, Rax, is 97.4 cm (so called an outward shifted
plasma in CHS). The toroidal magnetic field strength at the magnetic axis,BT AX, is 0.95 T. For this configuration,
the magnetic field strength at the aperture of the LIP is 0.59 T. The NB is injected in the counter-clockwise di-rection (Fig. 2). Wave forms of the plasma current with the timing of the NB injection, and the magnetic fluctua-tion are shown for a discharge in Fig. 3, and the expanded view of the magnetic fluctuation is shown in Figs. 4 (a) and (b). The 39 keV H beam with the tangency radius,Rtan, of
87 cm (NB#1) starts to be injected at 40 ms. At about 50 ms after the beam injection, the bursting mode ofm/n =3/2
Fig. 2 Top view of CHS showing the positions of the LIP and the neutral beam injectors.
Fig. 3 Waveforms of (a) plasma current with the timing of the NB injection, and (b) magnetic fluctuations measured by the magnetic probe built into the LIP. The red frame in (b) indicates the time span that is shown in Fig. 4 (a).
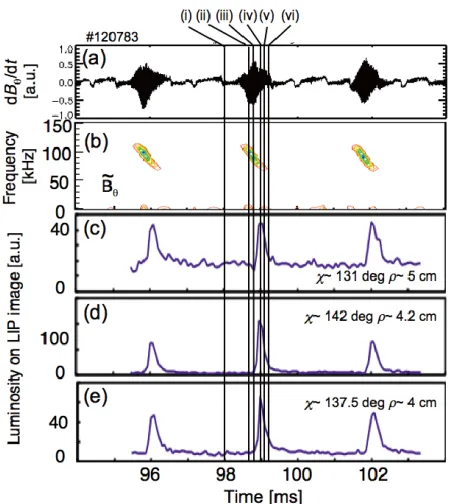
hav-Fig. 4 (a) Expanded view of magnetic fluctuations for hav-Fig. 3. (b) Temporal evolution of frequency spectrum of magnetic fluctuations. (c), (d), and (e) are temporal evolutions of the luminosity in the LIP image forχ∼131 degrees and ρ∼5 cm,χ∼142 degrees and ρ∼4.2 cm, andχ∼137.5 degrees andρ∼4 cm, respectively.
ing a duration of 0.04 ms, determined by a gating pulse on the camera’s image intensifier.
2.2
LIP signal with a new fast camera
sys-tem in bursting modes
Results using a new fast camera system are depicted in Figs. 4 (c)-(e) and 5. In Figs. 4 (c)-(e), the temporal evo-lution of the luminosity at a particular region in the gy-roradius and pitch angle space on a scintillator screen is shown. In Fig. 5, the grid of the gyroradius and pitch an-gle are overlaid on the measured 2D images. Here, the grid in gyroradius and pitch angle is determined by the fol-lowing way of the calculation; a number of test particles are launched with a single gyroradius and pitch angle from positions distributed across the front aperture, and the cen-troid of the strike points of the test particles on the scintil-lator screen is considered to be the grid point of the gyro-radius and pitch angle. Because of the finite aperture size, the distribution of strike points has a spread and the spread is larger as the energy of ions is larger in the direction of the gyroradius coordinate as shown in Fig. 6. The labels (i) – (vi) in Fig. 4 correspond to the labels in Fig. 5 as a time indicator.
At first, we mention the bright spot atχ∼131 degrees andρ∼5 cm. This region is bright when NB is injected even during a quiet phase between bursting modes. These detected ions reached the LIP without hitting the wall or
Fig. 5 The LIP images showing the pitch angle and gyroradius distribution of the lost beam ions over the course of one burst. The corresponding time of each image is indicated in Fig. 4, and the images are overlaid with the gyroradius and pitch angle interpretation grid.
other in-vessel structures. In other words, the ions with other pitch angle and gyroradius hit such structures before reaching the LIP. We call this loss as the primary loss and the spot of the loss the primary spot in this report. The loss at the primary spot was clearly detected even with the slower original camera system. The temporal evolution of the luminosity of the primary spot is shown in Fig. 4 (c), and it is similar to the previous observation by using a pho-tomultiplier tube. (In the previous study [8], the fast tem-poral evolution of escaping ions was measured by using a nine optic fibers connected to photomultiplier tubes with a time resolution of 0.1 ms. The resolution in gyroradius and pitch angle was limited because of the limited number of photomultiplier tubes.) The enhancement of the luminos-ity was by about 2 in 0.15 ms during the occurrence of a bursting mode.
With the installation of the faster video camera, several interesting new fast evolving features were ob-served. The first one is substantially enhanced luminos-ity at χ∼142 degree and ρ∼4.2 cm during the bursting mode. The luminosity in the same area is very small dur-ing the quiet phase between bursts. As shown in Fig. 4 (d), the luminosity of this region increases by a factor of 20 in 0.15 ms and the luminosity exceeds that of the primary spot for about 0.3 ms. The duration of the enhanced lumi-nosity of the area is less than 0.6 ms. Because this burst induced loss feature persists only very briefly, it was never seen clearly with the original (slower) camera system, even though the enhancement of the luminosity is very large.
Fig. 6 The calculated distributions of monoenergetic ions at the scintillator for the probe position and magnetic fields in the plasma analyzed.
the luminosity is around its maximum.
The third new observation is the gyroradius variation of the primary spot aroundχ ∼131 degrees. The time scale of this gyroradius fluctuation is less than 0.4 ms, but is still slow compared to the gate width of the image-intensifier of 0.04 ms. We observed a bright spot with ρ∼7 cm andχ∼132 degree, whose energy corresponds to 82 keV. Since this energy is far above the beam injection energy, it is unlikely that this feature actually results from 82 keV ions. Instead, we interpret it as an modulation of the higher gyroradius side of the 40 keV luminosity peak. This arises due to the finite aperture size (Fig. 6). Such a modulation could result from a localized movement of the magnetic field lines due to the instability. Motion on the order of the aperture size of 0.5 mm would be sufficient. The frequency spectrum of the fluctuation of the luminos-ity at the primary spot and that by the magnetic probe have humps at some frequencies, and the coherence between these fluctuations is high at these frequencies, adding cre-dence to this conjecture.
The fourth new result visible in the fast camera im-ages is the time of the enhancement of the luminosity dur-ing a burstdur-ing mode. The luminosity has a peak at the later phase of a bursting mode, namely when the mode fre-quency reaches its lower frefre-quency after its chirping down. Though this feature itself is reported in the previous study [14], we have observed this feature in the fast 2D image. Interestingly, the enhancement of the luminosity occurs at the same time for the primary spot atχ∼131 degrees and ρ∼5 cm, the newly observed spot atχ∼142 degree and ρ∼4.2 cm, and the newly observed belt of ρ∼4 cm and χ=132.5-142.5 degrees. This feature might relate to the
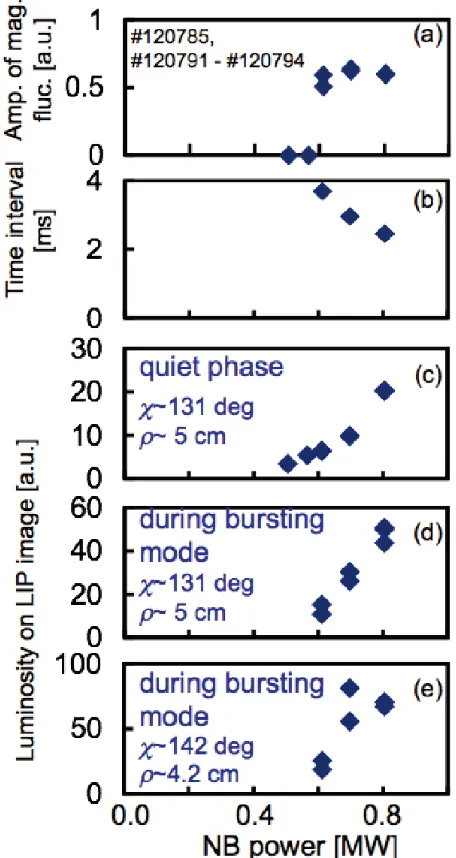
Fig. 7 Density dependence of (a) the amplitude of the magnetic fluctuations of the bursting mode, (b) the time interval of the bursting mode, (c) the luminosity of the LIP image atχ∼131 degrees andρ∼5 cm during a quiet phase, (d) the luminosity of the LIP image atχ∼131 degrees and ρ∼5 cm during a burst, (e) the luminosity of the LIP im-age atχ∼142 degree andρ∼4.2 cm during a burst.
mode structure in the later phase. The mode structure in the later phase could couple with the escaping ions effectively or resonantly. The dynamics of the change of the mode structure could be a nonlinear result of the “relay runner model” [15].
2.3
Dependence of observed loss on electron
density and injected power
Table 1 The parameters for NB in the NB power dependence.
Power [kW]
504 565 611 696 804
Energy [keV]
36.1 36.9 36.9 37.6 39.0
Shot number
#120793 #120794 #120792 #120791 #120785
that density, the amplitude is essentially constant over the whole range. The time interval of the bursting mode de-creases as the density inde-creases, though a small hump can be seen around 0.6×10¹⁹m−3 (Fig. 7 (b)). Figures 7 (c),
(d) and (e) show the luminosity dependence of the LIP im-age. The luminosity during a quiet phase increases as the density increases (Fig. 7 (c)). The luminosity of the LIP image at the occurrence of a burst is almost constant both for the primary spot atχ∼131 degrees andρ∼5 cm and the new spot ofχ∼142 degree andρ∼4.2 cm, except for a peak around 0.6×10¹⁹m−3. The decrease of the time
in-terval between bursts, Fig. 7 (b), suggests that the source of the mode is energetic ions, namely that this bursting behavior is the result of a wave-particle interaction of a “predator-prey” model type [16]. In the “predator-prey” model, the mode needs a source. The mode disappears when the source disappears, and the mode reappears when the source is refilled. Here, the source is expected to be energetic neutral beam ions. The mode appears when the amount of energetic ions reaches some level. The rate of the increase of the energetic ion population increases as the electron density increases because a greater fraction of the beam is ionized in the plasma. In these low density plasmas, the shine-through is normally dominant (>50 %: the estimation using the database by the calorimeter mea-surement [17] and using the FREYA code [18]) and that is consistent with this explanation of the mode intensity vs. plasma density. This would explain the variation of lumi-nosity with density in Fig. 7 (c). Thus, the interval of the bursting mode decreases as the electron density increase, when the loss amount is independent of the increase of the density. Actually, the dependence of the loss amount on the density is small in this measurement as can be seen in Figs. 7 (d) and (e) except for around 0.6×10¹⁹m−3.
Figure 8 shows the results of the NB-power depen-dence using the NBI#1 system. (The NB power was changed so as to keep the beam divergence constant, thus, the beam energy was also varied somewhat. The details are shown in Table 1.) At the time of interest, the density is almost same in these discharges (Fig. 9). This NB power scan also serves as a scan of the energetic ion density even though the range of the scan is relatively narrow. In this series, we cannot detect the bursting mode in the magnetic probes when the NB power is smaller than 0.6 MW. The amplitude of the magnetic fluctuations is almost constant
Fig. 9 (a) and (b) waveforms of electron density for the dis-charges of Fig. 8. (a) is for a whole discharge and (b) is a expanded view around the time of the analysis which is the time when a bursting mode appeared around 100 ms. The difference in the density of these discharges is about 10 % and thus the beam deposition profiles are virtually the same for all of them.
in the range of this NB power scan. The time interval be-tween the bursting modes decreases as the power increases as observed in the density scan. The increase of the lumi-nosity during a quiet phase of the primary spot atχ∼131 degrees andρ∼5 cm (Fig. 8 (c)) is observed. Thus, we in-fer that the density of energetic ions increases as the power increases. The luminosity of the LIP image during the bursts increases both for the primary spot atχ∼131 de-grees andρ∼5 cm and the new spot ofχ∼142 degree and ρ∼4.2 cm as the NB power is increased above 0.6 MW.
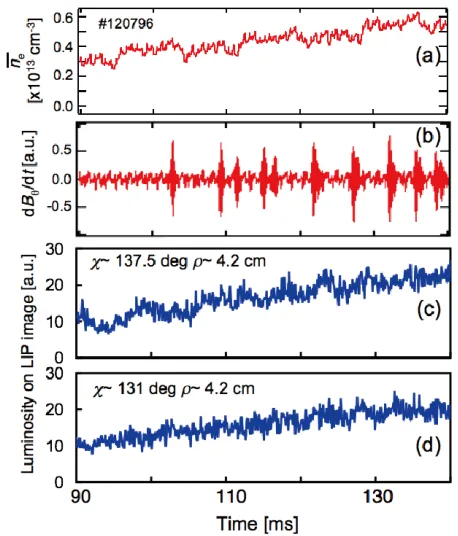
We also carried out the experiment by using another NB system (NBI#2) which has an injection energy of ∼31 keV andRtan = 0.88 m. Figures 10 (a)-(d) show the
temporal evolution of the line averaged electron density, the magnetic fluctuations, the luminosity of two points on the LIP images, respectively. In Fig. 11, the LIP image at 102.7 ms is shown as a typical result of the LIP image dur-ing a burstdur-ing mode. Stationary loss ions distribute around ρ∼4.1 cm (∼28 keV) and χ = 130-140 degree. Though the bursting modes appear, enhanced loss is not observed
Fig. 10 Waveforms for a discharge using NBI#2 system of the in-jection energy of∼31 keV andRtan=0.88 m. (a) the tem-poral evolution of the line averaged electron density, (b) the magnetic fluctuations, (c) the luminosity of the LIP image at χ∼137.5 degree andρ∼4.2 cm, (d) the lumi-nosity of the LIP image atχ∼131 degree andρ∼4.2 cm
Fig. 11 LIP image at 102.7 ms for a discharge using NBI#2 sys-tem.
in the whole region on the LIP image.
3. Discussion
angles as mentioned above. This phenomena might sug-gest the ions with the energy of∼27 keV have been res-onantly transported to the area ofR ∼ 0.9 m where these
escaping ions originate. On the other hand, we could not observe the enhanced loss when we used NBI#2 with the injection energy of∼31 keV. The mode structure might be different between the injection energy of∼38 keV and ∼31 keV. Bursting modes during the NB injection in CHS are regarded to be a kind of the so-called “energetic parti-cle modes (EPMs),” which are induced resonantly by ener-getic ions. Generally, it is considered that the mode struc-ture of the EPM is sensitive to the energy of the resonat-ing energetic ions, which drive the mode. In the previous study, the mode structure measurement for similar burst-ing modes was carried out by measurburst-ing a profile of a soft X ray emission [6], and the mode structures were consid-ered to be a localized one. The energetic ions might be transported to the region, where escaping ions originate, by the localized mode. The slight difference, which could be induced by the difference of the energy of NB ions, of the mode structure of the localized mode might prevent the mode from transporting energetic ions to the area where escaping ions originate for the case of the injection energy of∼31 keV. Or the condition for the transported ion might be different because of the different EPM due to the diff er-ent injection energy.
Thus, the investigation of the mode structure is an im-portant issue. Unfortunately, it is difficult to measure the mode structure for the modes, which we are reporting in this paper, by using a soft X ray emission because of the low density.
The observed enhancement of the luminosity on the occurrence of a burst mode has a time scale of∼0.1 ms at the rising phase and that of∼0.2 ms at the decay phase for all combination of the pitch angle and gyroradius. The temporal evolutions for all of these behaviors were just the enhancement of the luminosity on the occurrence of a burst mode. On the other hand, as reported in Ref. [4], the tem-poral evolution in the observation on JFT-2M, a medium sized tokamak, had the three characteristic phases of 1) the enhancement of the luminosity, 2) the reduced luminosity less than the level just before the enhancement, 3) the slow recovery phase of the luminosity. It is inferred that the en-hanced escaping ions were transported from a region far from the region where the escaping ions originate in the case of CHS, while the enhanced escaping ions were the transported ions from a region near the region where the escaping ions originate in the case of JFT-2M.
Several above aspects of the observed features of en-hanced escaping ions during bursting modes can be ex-plained when we regard that energetic ions are redis-tributed to the outer region which the observed escaping ions go through.
4. Summary
Enhanced loss of neutral beam ions during bursting MHD modes was studied in CHS., The bursts typically lasted∼1 ms, and the pitch angle and gyroradius distribu-tions of the lost energetic ions were captured with a high speed video camera mounted on a scintillator type lost ion probe. The camera provided images every 70µs during the bursts, allowing the changes in the lost ion distribution to be tracked in detail.
With this new high speed video capability, several new features of the loss were observed.
First, there is enhanced luminosity atχ∼142 degree andρ∼4.2 cm during the bursts. Second, a “belt” of loss atρ∼4 cm and χ = 132.5-142.5 degrees is seen during bursts. Third, the primary (prompt loss) spot atχ∼131 de-grees is transiently enhanced during the bursts at gyroradii (energies) larger than those injected. Fourth, the total lost ion luminosity peaks at the later phase of the bursts. To investigate the characteristics of the rapidly evolving fea-tures, we carried out scans of the electron density scan and NB power.
Using the new fast camera system, we have found a component of the energetic ion loss that is present only during the bursting activity and which occurs on orbits which would be blocked by the obstacles were it not for the perturbing effect of the bursting mode on the energetic ion orbits. The enhanced loss at the primary spot can be explained only by the small scale redistribution, however the new loss indicate the transport of energetic ions to the region where the energetic ions cannot exist without such an enhanced transport. The dependence of the newly ob-served enhanced loss on the electron density, the injected NB power is similar to that of the primary loss from the pa-rameter scan experiments. It is considered that the trans-port of the newly observed energetic ions and that of the primary loss are both determined by the common mode activity.
Acknowledgments
The authors would like to thank the CHS group for the support on experiments. This work was supported by JSPS, Grant-in-Aid for Scientific Research (Encourage-ment of Young Scientists (B) No 16760681).
[1] K.L. Wonget al., in8th IAEA Technical Meeting on Ener-getic Particles in Magnetic Confinement Systems(2003). [2] K.L. Wonget al., Phys. Rev. Lett.66, 1874 (1991). [3] W.W. Heidbrinket al., Nucl. Fusion31, 1635 (1991). [4] K. Shinoharaet al., Plasma Phys. Control. Fusion,46, S31
(2004).
[5] M. Ishikawaet al. Nucl. Fusion45, 1474 (2005). [6] K. Toiet al., Nucl. Fusion40, 1349 (2000). [7] M. Isobeet al., Rev. Sci. Instrum.70, 827 (1999). [8] T. Kondoet al., Nucl. Fusion40, 1575 (2000).
[9] D.S. Darrowet al., J. Plasma Fusion Res. SERIES1, 362 (1998).
Controlled Fusion and Plasma Physics (Prague, 1998), Vol.22C, 1462 (1998).
[11] M. Isobeet al., inProc. of 26th EPS Conference on
Con-trolled Fusion and Plasma Physics (Maastricht, 1999),
Vol.23J, 21 (1999).
[12] D.S. Darrowet al., Rev. Sci. Instrum.70, 838 (1999). [13] K. Shinoharaet al., Rev. Sci. Instrum.77, 10E521 (2006).
[14] K. Toiet al., Nucl. Fusion39, 1929 (1999).
[15] F. Zoncaet al., Fusion Energy 2002 (Proc. 19th Int. Conf. Lyon, 2002), IAEA-CN-94/TH/4-4, IAEA.