© Universiti Tun Hussein Onn Malaysia Publisher’s Office
IJIE
Journal homepage: http://penerbit.uthm.edu.my/ojs/index.php/ijie
The International
Journal of
Integrated
Engineering
Comparison Study between FEM Simulation and
Experimental of Heat and Mass Transfer in Kek Lapis
Sarawak Baking
A. S. Z. Abidin
1*, M. S. Hamsawi
1, N. Junaidi
2, A.R.H. Rigit
1, M. S. Zafwan
1, S.
Mohamaddan
1, R. Muslimen
1, J. Annisa
11 Department of Mechanical and Manufacturing Engineering,
Faculty of Engineering, Universiti Malaysia Sarawak, 94300 Kota Samarahan, Sarawak, MALAYSIA
2 Department of Electrical and Electronic Engineering,
Faculty of Engineering, Universiti Malaysia Sarawak, 94300 Kota Samarahan, Sarawak, MALAYSIA
*Corresponding Author
DOI: https://doi.org/10.30880/ijie.2018.10.07.019
Received 7 August 2018; Accepted 22 November 2018; Available online 30 November 2018
1. Introduction
Kek Lapis Sarawak is a special cake from Sarawak with unique texture and flavor that capture the tourists’ attention [1]. Conventional process of making Kek Lapis Sarawak is very tedious and repetitive. Basically, the process consists of five main sequential methods namely depositing, baking, cooling and pressing [1-2]. Fig. 1 shows process flow of making Kek Lapis Sarawak. Most of the conventional baking process used liquified petroleum gas (LPG) oven. As the industry started to move towards automation there is a need to replace the conventional oven with electrical oven for more accurate control of the process.
Energy cost is quite substantial and there is a demand to minimize energy consumption. In the cake industry, the use of oven for baking process contributes to the biggest energy consumption. The effectiveness of oven operation relies on oven design and the baking process itself [3]. Optimization of the oven operating condition enable significant reduction in energy consumption that consequently reduce the production cost.
Hamsawi et al. (2017) summarized number of related patents for the baking process. Convection oven and bi-directional heating cooker are potentially able to improve the baking process due to controllable heat transfer [4-9]. On
Abstract: Kek Lapis Sarawak is specialty dish from Sarawak. Kek Lapis Sarawak industry contributes a lot to the state’s economy. In cake industry, the use of oven in the baking process contributes to high energy consumption. Nowadays, energy has become an operational issue and there is a need to minimize energy consumption to reduce production cost. This research aims to optimize the baking process for an efficient energy consumption. Therefore, it is important to investigate the relationship between baking temperature, time and cake quality. Accurate temperature and time will define an efficient baking process. Kek Lapis Sarawak baking process has been modelled and simulated using finite element method (FEM). Results from the model was validated with an experiment. There is specific oven temperature needed to enable perfect gelatinization and coagulation to happen which is 190 °C. While baking time are varied by layers. The baking time is reducing as more layers added. The finding shows interdependent relationship between porosity, thermal conductivity and moisture content where higher porosity can lead to poor thermal conductivity.
the other hand, conveyor oven is practical and easy to maintain as the parts are accessible to change [10-15]. Conveyor oven is able to improve production rate due to optimum baking capacity. Furthermore, forced convection oven can optimize the baking temperature as the oven applied closed design concept [16-19]. Theoretically, microwave oven offers more efficient heating process due to multi access wave radiation [20-25]. Therefore, less power and faster heating process is expected. However, cooking and baking are two different processes. Further study has to be conducted before considering microwave oven as quality and taste of the cake are the main concern in the research apart from energy consumption.
Fig. 1. Flow process of cycle of a Kek Lapis Sarawak production [1].
Baking is a complicated process that involves changing of physical, biochemical and chemical properties of a product, throughout the process [3]. Thermal energy during baking is transmitted to the surface of the product through radiation from the oven heating coil and convection from the hot air inside the baking chamber [26-27]. Furthermore, heat transfer from conduction occurred through internal flux within the product from surface to the center [28]. Defining the baking process in mathematics and phenomenological aspects is crucial as both are correlated with the uniform heating process and non-uniform heating process, chemical, physical properties and structural changes of the thermo-physical properties of the system [29].
Transformation take place during baking when water particles from batter evaporate to the baking chamber that occurred with the increased of batter’s volume due to expansion of gas during leavening process while pressure of the stream is produced as chain reaction of the heat transfer. Thermo-setting of the gluten products leads to the gas expansion, depending on the rheological properties of the batter, fat melting and the amount of starch gelatinization. At the same time, crust formation slows down the mass transfer due to browning development [26-41].
Porosity is related to the moisture content of the bread during baking. Thus, when porosity increase the moisture content of the bread will simultaneously decrease [42]. This is due to thermal conductivity and moisture content which is directly proportionate to each other [43]. As based on the previous research, it is stated that the value of thermal conductivity for ground chuck is higher than value for ground beef because ground chuck had a slightly higher moisture content [44]. Moreover, the water content of the meat affects the thermal conductivity because it was the main constituent with higher values than the solid components.
Computer simulation plays important role in modelling the baking process and also proven to be one of the most beneficial tools to assist individuals to understand a process and forecast phenomenon [45]. Simulation is very useful in the beginning of research as the process designates the real phenomenon without carrying out the experiments. Simulation intent to recognize, control and forecast specific real process [32]. Nowadays, computer simulation performance is improved with high processor speeds and RAM which enable integration of thermo-physical properties with baking time and product temperature, that consequently improve accuracy of a simulation model [46].
The aim of this study is to optimize the baking process. In order to achieve that, this study was conducted to find relationship between baking temperature and time to meet the desired cake texture [47]. Finite element method (FEM) has been applied to model the baking process and the results are validated through experiment. The finding is expected to determine accurate parameters for efficient baking process. Furthermore, it can be used to advance the current model which intent to improve the complex phenomena that occurred during baking process.
2.
Methodology
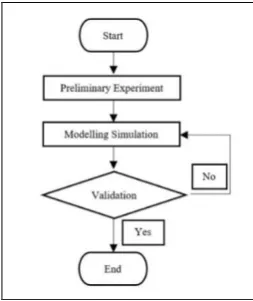
Fig. 2 – Process flow process of the research
2.1 Preliminary experiment
The main objective of preliminary experiment is to determine preliminary parameter namely power (W), initial temperature (Ti) and baking time for simulation exercise. Cake batter was prepared with the following ingredients:
30.43% (of total weight) dry ingredients (containing wheat flour, sugar and ground malt powder), 28.99% pasteurized whole liquid egg, 21.74% butter and 18.84% condensed milk. Four stages mixing method was used to prepare the batter using hand mixer. Baking tray size of 0.20 m x 0.20 m x 0.08 m (L x W x H) Aluminium’s tray [3]. Aluminium has high thermal conductivity which is 206 W/m K, [25]. 150 gm of batter was deposited and layered in the baking tray. The volume is equivalent to 3 mm layer thickness. The thickness will ensure consistent temperature dispersal within the product during baking and also to eliminate the effect of temperature gradient. The experiments were carried out in an electrical baking oven with the size of 0.43 m x 0.25 m x 0.30 m (L x W x H). Power for heating element and thermal conductivity of the cake’s batter is determined by Fourier’s Law of Conduction [48-49].
2.1.1 Determination of baking temperature
The preliminary experimental procedures to determine suitable baking temperature can be summarized as follows: i. Oven pre heat to 190 °C oven baking temperature for 8 minutes.
ii. Weigh the empty aluminium tray using kitchen scale.
iii. Pour 150 g of the cake’s batter into the tray and spread evenly equivalent to 3mm layer thickness. iv. Measure the cake’s batter temperature using thermocouple before baking.
v. Record weight of the tray and cake batter (layer-1) before baking.
vi. Place the tray into the oven. During baking, observe and record the cake’s browning development using video camera.
vii. Observe the cake texture until it reached golden brown.
viii.Once the cake reached golden brown, take out the tray and weigh the tray for after baked weight.
Step (i) until (viii) of the experiment is repeated for 220 °C gas oven baking temperature.
In this preliminary experiment, 190 °C oven baking temperature has been chosen. Justification of the baking temperature selection will be discussed in Section 3.4.
2.1.2 Determination of baking time for 190 °C oven baking temperature
The preliminary experimental procedures for determining of baking time 190 °C can be summarized as follows: i. Oven pre heat to 190 °C for 8 minutes.
ii. Weigh the empty Aluminium tray using kitchen scale.
iii. Pour 150 gm of the cake’s batter into the tray and spread evenly in the baking tray. iv. Measure the cake’s batter temperature using thermocouple before baking.
v. Record weight of the tray and cake batter (layer-1) before baking.
vi. Place the tray into the oven. During baking, observe and record the cake’s browning development using video camera.
vii. Record the time taken for the cake to reached golden brown.
2.2 FEM Simulation
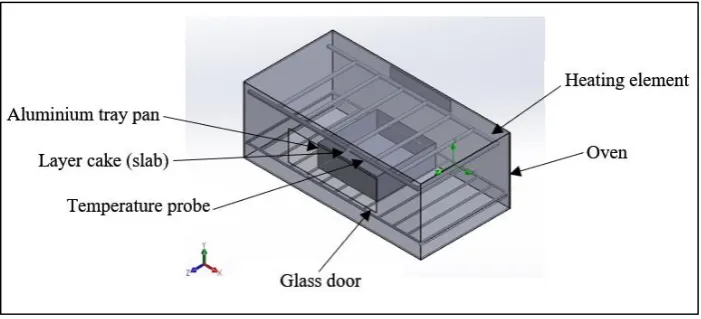
Simulation is conducted using Computer Aided Design software, SolidWorks 2016. The software provides Flow Simulation’s features to model the Kek Lapis Sarawak baking process. Modelling of the simulation consists model of oven and aluminium tray. Material for the simulation is chosen from the software’s library based on standard material for oven and aluminium tray. The modelling of the oven and aluminium tray is shown in Fig. 3. Top heating element of the oven is applied in this research. Data from the preliminary experiment was used to set the power for the heating element. The dummy probe in FEM simulation is shown in Fig. 4. The arrangement has been set up to be similar to experimental method. Position of k-type thermocouple in the experiment is positioned at the centre of the tray, similar to FEM simulation. The simulation setting for meshing used the global meshing (one of the features in the Flow Simulation’s features). The formula being used in this FEM simulation is based on Newton’s Law of Cooling (1) and Fourier’s Law of Heat Conduction (2). These formulas are very significant to the research as baking process involved thermal conductivity and different materials’ temperature. Equation (1) and (2) were applied in order to find rate of heat transfer for convection and conduction that to be used in the FEM simulation. Thermal conductivity of the Aluminum tray and the power heating element for FEM Simulation have been determined from preliminary experiment.
𝑄𝑐𝑜𝑛𝑣𝑒𝑐𝑡𝑖𝑜𝑛 = ℎ𝐴(𝑇𝑠− 𝑇𝑓) (1)
𝑄𝑐𝑜𝑛𝑑𝑢𝑐𝑡𝑖𝑜𝑛 = −𝑘𝐴𝑑𝑦𝑑𝑥 (2)
𝑄̇convection ; Rate of heat transfer (W)
h ; Convective heat transfer coefficient (W / (m^2.℃)) A ; Surface area for heat transfer (m^2)
∆𝑇 ; Temperature difference (℃) 𝑄̇ conduction ; Rate of heat transfer (W) k ; Thermal conductivity (W/m°C) 𝑑 ; Thickness (m)
First, model of oven and aluminium baking tray has been developed in the simulation software. The arrangement of the oven and aluminium baking tray is shown in Fig. 3 and Fig. 4. Results from preliminary experiment were applied as initial baking temperature and baking time for the cake (slab) in the computer simulation. Simulate the model of baking process in the computer. The process has been repeated for sixth time which is six layered of thickness. The different between layers was the arrangement of the cake’s layers (slab). First layer of the cake consists of one layer of slab. Followed by layer-2 until layer-6, the slab was added up one by one until it reached layer-6 as shown in Fig. 4. Result from layer-1 was used as initial condition for the next following layer (layer-2) baking process. The process was repeated until it reached the layer-6. Data used for the initial condition of the simulation is shown in Table 1. The data is applied in the FEM simulation with intention to imitate similar condition as of the experimental method. Phase changes in the baking simulation has been neglected due to the software limitation. Consequently, porosity of the cake is also neglected.
Fig. 4 – Section view of the layer cake’s (slab) in the Aluminium baking tray
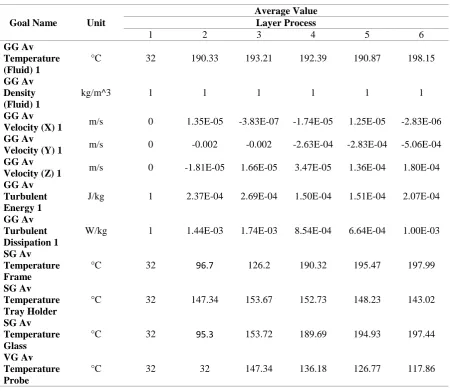
Table 1 - Initial condition and assumptions of the model simulation
Goal Name Unit
Average Value Layer Process
1 2 3 4 5 6
GG Av Temperature (Fluid) 1
°C 32 190.33 193.21 192.39 190.87 198.15
GG Av Density (Fluid) 1
kg/m^3 1 1 1 1 1 1
GG Av
Velocity (X) 1 m/s 0 1.35E-05 -3.83E-07 -1.74E-05 1.25E-05 -2.83E-06
GG Av
Velocity (Y) 1 m/s 0 -0.002 -0.002 -2.63E-04 -2.83E-04 -5.06E-04
GG Av
Velocity (Z) 1 m/s 0 -1.81E-05 1.66E-05 3.47E-05 1.36E-04 1.80E-04
GG Av Turbulent Energy 1
J/kg 1 2.37E-04 2.69E-04 1.50E-04 1.51E-04 2.07E-04
GG Av Turbulent Dissipation 1
W/kg 1 1.44E-03 1.74E-03 8.54E-04 6.64E-04 1.00E-03
SG Av Temperature Frame
°C 32 96.7 126.2 190.32 195.47 197.99
SG Av Temperature Tray Holder
°C 32 147.34 153.67 152.73 148.23 143.02
SG Av Temperature Glass
°C 32 95.3 153.72 189.69 194.93 197.44
VG Av Temperature Probe
°C 32 32 147.34 136.18 126.77 117.86
2.3 Baking Experiment
Experimental method was conducted in order to validate the computer simulation results. The apparatus and procedures for the experiment is similar to the preliminary experiment. The same batter recipe as used in the preliminary experiment was used in the experiment. In addition to the preliminary experiment (after step vii in Section 2.1), same amount of fresh batter (second layer) was added on top of the first layer (baked). The whole processes were repeated until sixth layer.
During experiment, there is slight different from the preliminary experiment due to the immersion of the thermocouple into the cake’s batter. The purpose is to measure the cake temperature during baking. The cake temperature was measured using k-type thermocouple (probe size, d: 5 mm) attached onto the baking tray at 1.5 mm height, at the central position of baking tray and recorded by temperature data-logger (Arduino UNO and MAX 6675). The thermocouple probe has to be properly immersed in the cake batter during the measurement, but not to contact the lower tray surface or to slip out of the batter. The temperature data of the cake was recorded with the data logger.
Each layer has different baking time. The baking time is defined through observation of browning formation on top of the cake’s surface. The cake immediately taken out once the cake surface reached fully browning. The duration is recorded as cake’s baking time. The margin of error for the data is by comparing between FEM Simulation and Baking Experiment.
3.
Results and Discussion
The section begins with reporting of results from the preliminary experiment, computer simulation and experimental method, followed by discussion of the whole findings.
3.1 Preliminary Experiment
This section shows results of preliminary experiment for 190 °C and 220 °C baking temperature. Baking time and cake temperature for both baking temperatures for each layer was recorded. Due to page limitation only selected part of data from the preliminary experiment were shown in Appendix A.
3.2 FEM Simulation
This section shows results of FEM Simulation at 190 °C oven temperature. Due to page limitation only selected part of data from the computer simulation were shown in Appendix B.
3.3 Experimental
From the preliminary experiment, the ideal temperature for baking Kek Lapis Sarawak is 190°C. Therefore, this section shows results of experiment for 190 °C oven temperature. Due to page limitation only selected part of data from the computer simulation were shown in Appendix C.
3.4 Discussion
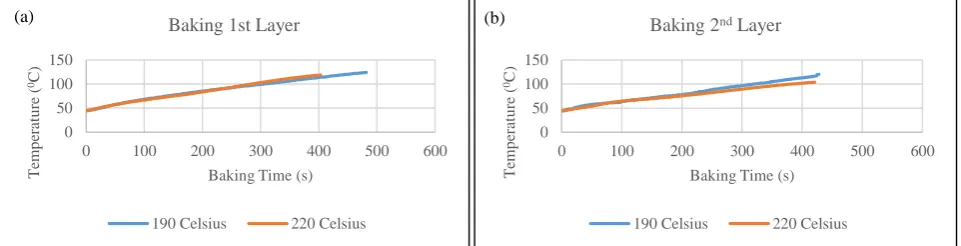
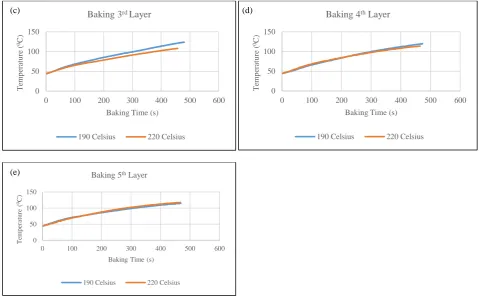
The aim of preliminary experiment is to define the best oven temperature setting which is economical and able to produce the desired cake’s texture. The results of baking process at two different oven temperature, 1900C and 2200C for
first layer until fifth layer cake were shown in Fig.5 (a) until (e). Each figure shows two plot of graphs that represent the cake baking process from two different oven temperature. The graph shows cake baking time in seconds (s) versus cake’s temperature in 0C. The time indicates duration for the cakes to reach browning before taken out from the oven. While,
temperature (Y-axis) represents the cake’s temperature during baking. All data were recorded for every seconds. Discussion focuses on effect of the oven temperature towards (1) cake’s baking time to reach browning, (2) cake temperature especially at 800C as starch gelatinization and coagulation take place, (3) trend between cake’s layer and
finally (4) cake’s texture.
Fig. 5 (a) shows comparison between 190 °C and 220 °C oven temperature for the first layer cake. The baking time for the cake to reach fully brownness is different between oven temperature setting, which is 482 seconds for 190 °C and 403 seconds for 220 °C oven temperature. Overall cake’s temperature for 2200C oven temperature setting is slightly
higher than the cake baked in the 1900C oven. In term of baking time, there is huge different between these two setting,
which is at 2200C oven temperature had shorter baking time (403s) as compared to 1900C oven temperature that took
482s to achieve fully browning. The result shows increase of baking temperature contributes to positive drying rate. The finding is similar to Sakin et. al (2007) who applied the same experiment method except for the oven temperature which is 160 °C instead of using 190 °C and 220°C.
temperature shows higher cake’s temperature compared to 220°C oven temperature. Theoretically, higher oven temperature should contribute to higher cake’s temperature. However, the theory does not apply here since there are other factors that contribute to higher cake’s temperature.
Fig. 5 (c) shows comparisons of results for the third layer cakes. The first 14s of baking time, cake from 2200C oven
temperature shows higher cake’s temperature. After 14s, the trend started to change as the cake’s temperature from 1900C
oven temperature has surpassed the 2200C cake’s temperature. The gap becomes wider when the cake temperature
approaching 800C. Starch gelatinization and coagulation of protein in baking process occurs at the product temperatures
of 80°C and above (Mizukoshi et. al, 1980). Bubble is the effect of gelatinization and coagulation that can be seen on the cake’s surface when the temperature reached 80 °C. During gelatinization and coagulation of protein in baking process, the cake structure is changed from highly vicious fluid to an open pore dry solid. Thus, moisture content of the cake is decreased due to vaporization of water content of the cake’s batter. Moreover, the bubbles existed at the surface of the cake’s surface due to production of CO2 and leavening from the cake’s batter when the cake’s temperature reaching 80°C.
The different in slope of the graph as shown in Fig.5 (c) is due to the moisture content of the slabs were different between cake’s surface of different oven temperature (190 °C and 220 °C). According to (Sakin et al, 2007), the thermal conductivity is a crucial part as cake’s surface of 190°C is less moist compared to cake’s surface of 220 °C. Thus, the slope gradient of the graph of cake’s surface 190 °C is higher in temperature than 220 °C. Probably the 190°C cake has perfectly achieved the gelatinization and coagulation stage earlier that contributes to the rapid increase of the cake’s temperature until it reached fully browning. Even though 1900C cake shows higher cake’s temperature, the baking time
is also longer compared to cake from 2200C oven temperature.
Results for fourth and fifth layer were shown in Fig. 5 (d) and (e). Both layers have similar cake’s temperature pattern for both oven temperatures. The graphs were overlapping at most of the points. Surprisingly, all cakes’ baking time were ended about the same time. Thus, higher oven temperature has no direct effect towards shorter baking time. Total baking time to complete all five layered cakes for 1900C is 2,332s. Meanwhile, 2200C oven temperature took 2,213s which is
119s less. Since baking time was determined by browning development and observed by naked eyes, there is tendency of in-consistent monochromatic colour scheme. Thus, may contribute to varies of baking time from different layers and different cakes of different oven temperature too.
After the last layer of the experiment 2.1.1 (determination of baking temperature), the cakes were leave on the table for natural cooling for certain period of time after the fifth layer baking completed. Physically, both cakes show similar brown colour on the top surface. The final cake’s temperature for both cakes happened to be above 800C, which is the
cake temperature for gelatinization and coagulation process took place. However, when the cakes were cut into slices, the inner part of the cakes were different. Likely, cake from 1900C oven temperature was perfectly bake, uniform layers
and fluffy texture. However, the cake from 2200C oven temperature showed non-uniform layers texture. The cake has
raw looked in the middle, sign of undercooked. Likely, gelatinization and coagulation process require for specific baking temperature so that the process can perfectly occurred which is 1900C. Besides baking time, 1900C oven temperature
offers more advantages. It is more economical as higher oven temperature consume more energy. The most important is 1900C cake’s has better cake texture as one of the main indicator for cake’s quality. Therefore, 1900C temperature for
electric oven setting is more suitable for Kek Lapis Sarawak baking.
0 50 100 150
0 100 200 300 400 500 600
T em p er at u re ( 0C)
Baking Time (s) Baking 1st Layer
190 Celsius 220 Celsius
0 50 100 150
0 100 200 300 400 500 600
T emp er at u re ( 0C )
Baking Time (s)
Baking 2ndLayer
190 Celsius 220 Celsius
Fig.5 (a)- (e) –Comparison between 190 °C and 220 °C of oven temperature for (a) first layer cake (b) second layer cake (c) third layer cake (d) fourth layer cake and (e) fifth layer cake
Table 2 shows results of the conducted experiment. The results were used to compare with simulation results. Standard Deviation between experimental and simulation for the first layer is 1.091. Moreover, the margin of error is 9.26 %. Results of layer-1 from experimental and simulation are shown in Fig. 6. Basically, both methods show about similar trend. The initial temperature for the computer modelling applied the same cake’s temperature as preliminary experimental result (similar to experimental result). The same baking time from preliminary experiment was applied as baking time for simulation. Therefore, both graphs were ended at the same baking time, 535 seconds. At 535 seconds, the highest temperature of the cake being recorded which is 124.25 °C from experiment while the simulation showed 126.89 °C. The findings show the increased of baking time is proportionate to the increase of the cake’s temperature, thus contributes to positive drying rate. The finding is similar to Sakin et. al (2007) who applied the same experimental method except for the baking temperature is 160 °C which is lower than this experimental baking time 190 °C.
Table 2 - Experimental results
Unit Layer Process
1 2 3 4 5 6
Power W 9166 9166 9166 9166 9166 9166
Thermal
Conductivity W/m*K 8.84 8.84 8.84 8.84 8.84 8.84
Initial
Temperature °C 32 32 32 32 32 32
Baking Time s 535 487 533 516 503 508
0 50 100 150
0 100 200 300 400 500 600
T em p er at u re ( 0C )
Baking Time (s) Baking 3rd Layer
190 Celsius 220 Celsius
0 50 100 150
0 100 200 300 400 500 600
T emp er at u re ( 0C )
Baking Time (s)
Baking 4thLayer
190 Celsius 220 Celsius
0 50 100 150
0 100 200 300 400 500 600
T em pe ra tu re ( 0C )
Baking Time (s)
Baking 5thLayer
190 Celsius 220 Celsius (e)
Fig. 6 - Graph of Experimental and Simulation for the baking first layer process
The result for the second layer of experimental and simulation is shown in Fig. 7. Based on observation, formation of the golden browning on the cake surface occurred earlier than the first layer which is 487 seconds. At 487 seconds baking time, the highest temperature of the cake batter being recorded is 120.5 °C for experiment while simulation temperature is 140.87 °C respectively.
The results of the second layer show huge gap in temperature gradient between experimental and simulation. Standard Deviation between Experimental and Simulation for the second layer is 6.10. Moreover, the margin of error is 54.31%. The different is due to thermal equilibrium factor. During experiment, the same amount of batter at room temperature (second layer) was spread on top of hot cake (first layer). Fresh batter of the second layer absorbed heat from oven and heat from the baked cake (first layer) in order achieve the thermal equilibrium. Moreover, the temperature gradient different is also because of conduction effect of the hot Aluminium tray. Thus, second layer took shortest time to reach browning surface as the layer received heat from two sources of heat. However, due to software limitation the scenario was not able to be applied in the model simulation. Consequently, simulation was not able to simulate the factor (as shown by a straight line).
Fig. 7 - Graph of Experimental and Simulation for the baking second layer process
Fig. 8 - Graph of Experimental and Simulation for the baking third layer process
Fig. 9 - Graph of Experimental and Simulation for the baking fourth layer process
The fifth layer took 503 seconds to reach browning effect. The highest cake temperature for experiment is 115 °C while the simulation is 118.61 °C respectively. Standard Deviation between Experimental and Simulation for the third layer, fourth layer and fifth layer are 2.80, 0.636 and 0 respectively. Moreover, the margin of error for the third layer, fourth layer and fifth layer are 23.82%, 5.51% and 0% respectively. On the fifth layer, both of the experiment and simulation show similar results (nearly overlapping) except for certain points that intersect between these two graphs. Initially, the first until the fourth layer results show simulation have higher cake temperature as compared to experiment. However, in the fifth layer the trend has started to change.
Fig. 10 - Graph of Experimental and Simulation for the baking fifth layer process
experiment has surpass the simulation. It shows that interdependent relationship between porosity, moisture content and thermal conductivity factors for the actual environment (experimental) have affected the baking process. These factors were not considered in the simulation due to the software limitation that has neglected the porosity factor. The temperature is higher in the experimental method due to higher porosity of the baked layer cake (slab) and poor in thermal conductivity compared to simulation. The finding is aligned with the previous researches. According to Sweat et al. (1973) and Qashou et al. (1970) the moisture content affects the thermal conductivity where higher moisture content will lead to higher thermal conductivity. Moreover, the moisture content affects the porosity where higher moisture content will lead to lower porosity [42]. From the Fourier’s Law, relationship between the temperature and the thermal conductivity is inversely proportional to each other [48].
Fig. 11 - Graph of Experimental and Simulation for the baking sixth layer process
Weight reduction for all the layer process is shown in Table 3. Weight reduction is occurred due to moisture removal from the cake [27]. As shown in Table 3, the weight of baked cake (final weight) has been decreased as compared to the initial weight due to moisture content removal. However, percentages of weight reduction between layers were not consistent. This could be due to inconsistent baking time as the baking time was defined through manual observation. Theoretically, baking time should be shorter when more layers baked as distance between cake to heating element (top heating) become closer. At the same time, interdependent effect of moisture content, thermal conductivity as well as porosity become severe. Moreover, these factors are also related to energy saving. Accurate baking temperature and baking time can precisely control via modern electronics devices for optimizing the baking process. Consequently, more energy saving that able to reduce production cost.
As stated by Mizukoshi, Maeda, and Amano (1980), the starch gelatinization and the protein coagulation reactions happen during the baking process which is at baking temperatures of 80 °C and above. The structure of the cake batter change from highly viscous fluid to more open pore and dry solid cake, leading to higher moisture removal rate. Therefore, this research founds that the cake started to create bubbles on the surface of the cake where the production of the CO2 and leavening as the cake temperature reached 80 °C.
Table 3 - Comparison of weight reduction between layers.
Unit Layer-nth
1 2 3 4 5 6
Initial
Weight g 150 150 150 150 150 150
Final
Weight g 137 137 140 133 141 137
Weight
Reduction % 8.67 8.67 6.67 11.33 6 8.67
4.
Conclusion
As a conclusion, significant relationship between cake temperature and baking time have successfully studied. There is correlation between specific baking temperature and baking time towards efficient baking process. Thus allow for optimum baking process and the result will be energy saving. There is specific baking temperature needed to enable perfect gelatinization and coagulation to happen. Recommended electric oven temperature for Kek Lapis Sarawak is 1900C. The correct temperature has direct effect to the cakes texture. The average baking temperature is about 120 °C.
increase. The results will be used to advance the current model with intention to ousting the simplified description of the complex phenomena during baking process by applying finite element method. Therefore, the findings are expected to enable precise control of oven temperature and baking time setting towards optimization of energy consumption for baking process of Kek Lapis Sarawak.
Acknowledgement
This research is funded by the Ministry of Education Malaysia under the Research Acculturation Grant Scheme (RAGS), 2015. Grant no: RAGS/TK01(2)/1316/2015(10). The authors would like to thank Universiti Malaysia Sarawak (UNIMAS) for providing facilities for the research.
Appendix A: Selected results of comparison between 190
0C and 220
0C oven temperature
showing baking time and cake temperature
Baking time (s) Layer 1 Layer 2 Layer 3 Layer 4 Layer 5
190(°C) 220(°C) 190(°C) 220(°C) 190(°C) 220(°C) 190(°C) 220(°C) 190(°C) 220(°C) 1 44.25 44.5 44.25 44.5 44.25 44.25 44.5 44.5 44.25 44.5 2 44.25 44.5 45 44.5 44.25 44.75 44.75 44.5 44.25 44.5 3 44.25 45.25 45.25 45 44.25 44.75 44.25 44.5 44.75 45.25
4 44.75 45.25 44.25 45.25 44.75 45 45 45 45 45.25
5 44.75 45.25 46 45.25 44.75 45 45.5 45 45.5 45.25
6 45 45.75 45.5 45.5 45 45.5 45 46 46 45.75
401 113.75 118.5 113.25 101.75 113.75 102.25 112.25 108.25 109.5 112.5 402 114.25 119 113 101.75 114.25 102.25 112.5 108.25 109.5 112.5 403 114.25 119 113.75 101.75 114.25 103 112.5 108.25 109.25 112.5 404 114.5 113.5 102.25 114.5 103 113 109.25 109.75 112.5 421 116.75 116.5 104 116.75 104.75 114 110.75 110.75 114.5 422 117 116.75 117 104.75 114.75 110.75 110.75 114.5
423 117 117 117 104.5 114.5 110.75 111 114.5
424 116.75 116.75 116.75 105 114.75 110.75 110.75 114.5 425 117.25 119.75 117.25 105 115.25 110.75 111 114.5 426 117.5 119.75 117.5 105 115.25 110.75 111.25 114.5 427 117.25 119.75 117.25 105.25 115.25 110.75 111.5 114.5
428 118 120.5 118 105.25 115.5 111.25 112 114.5
429 117.5 117.5 105.25 115 111.25 111.75 114.5
430 118 118 105.25 115.75 111.25 111.5 114.5
431 117.5 117.5 105.5 115.5 111.25 111.75 114.5 457 121.25 121.25 108 118.5 113.75 113.75 116.75
458 121.25 121.25 118.5 113.75 114.25 116.75
465 121.75 121.75 119.25 113.75 114.25 117
466 122.25 122.25 119 114.25 117
467 122.25 122.25 119.5 114.5 118
468 122.75 122.75 119.75 114.75
469 123 123 119 115
470 123 123 119.75
471 123 123 119
472 123 123 119.75
473 123.25 123.25 120
474 123.5 123.5
479 123.75 123.75
480 123.75 123.75
Appendix B: Selected results of FEM simulation for 190
0C oven temperature
Baking time (s)
Cake temperature (0C)
Layer 1 Layer 2 Layer 3 Layer 4 Layer 5 Layer 6
1.00 35.40 29.81 36.28 42.54 39.01 41.16
2.00 35.54 30.78 36.94 43.07 39.30 41.42
3.00 35.67 31.21 37.37 43.46 39.61 41.63
4.00 35.78 31.47 37.66 43.85 39.90 41.79
5.00 35.89 31.66 37.87 44.04 40.13 41.94
6.00 35.98 31.80 38.04 44.36 40.32 42.14
7.00 36.08 32.01 38.20 44.55 40.53 42.27
8.00 36.18 32.22 38.35 44.65 40.77 42.45
9.00 36.29 32.35 38.49 44.94 40.91 42.57
10.00 36.43 32.52 38.71 45.06 41.31 42.80
Appendix C: Selected results of experiment for 190
0C oven temperature
Baking Time (s) Cake temperature (0C)
Layer 1 Layer 2 Layer 3 Layer 4 Layer 5 Layer 6
1 35.25 27.75 35.25 42 38.75 41
2 35.75 28.5 35.75 42.25 38 41.25
3 36 28.25 36 42.5 38.25 42.25
4 35.5 29.25 35.5 42.25 38 42.5
479 117.5 116.25 117.5 116.25 113 122.25
480 117.25 116.5 117.25 116.5 112.25 122.25
481 118 116.75 118 116.5 113
486 118 119.75 118 117 113.5
487 118.75 120.5 118.75 117.5 113.5
488 118.5 118.5 117.5 113.5
489 119 119 117.5 113.75
502 120.5 120.5 118.25 114.75
503 120.5 120.5 119 115
504 120 120 118.75
505 120.75 120.75 119
514 122 122 120
515 121.75 121.75
533 123.75 123.75
534 124
535 124.25
References
[1] Abidin, A. S. Z., Annisa, J., Tan, W. K., Rigit, A. R. H., Chong, J. S., Kiprawi, M. A., & Johnapi, P. R. (2014, November). Development of a prototype model for fully automated Sarawak layered cake machine. In Engineering and Technology (BICET 2014), 5th Brunei International Conference on (pp. 1-5). IET.
[2] Hamsawi, M. S., Abidin, A. S. Z., Mohamaddan, S., Muslimen, R., Jamaludin, M. S., Hashim, N. I., & Junaidi, N. (2017). A Review on Development of Kek Lapis Sarawak’s Machine. In MATEC Web of Conferences (Vol. 87, p. 02017). EDP Sciences.
[4] Greenwood, J., & Reese, R. J, "Convection oven." U.S. Patent No. 8,378,265, Feb 19 2013. [5] Knost, D, "Baking oven." U.S. Patent No. 5,875,705, Mar 2 1999.
[6] Karabin, T., & Johnson, L. B, "Chambered flame oven." U.S. Patent No. 8,464,701, Jun 18 2013.
[7] Klobucar, J. M., Pakkala, J. L., & Yu, G, "Convection combustion oven." U.S. Patent No. 7,905,723, Mar 15 2011.
[8] Baik, O. D., Marcotte, M., & Castaigne, F, "Cake baking in tunnel type multi-zone industrial ovens Part I. Characterization of baking conditions." Food Research International, vol. 33, no. 7, pp. 587-598, Aug 2000. [9] Baik, O. D., Marcotte, M., & Castaigne, F, "Cake baking in tunnel type multi-zone industrial ovens Part II.
Evaluation of quality parameters." Food Research International, vol. 33, no. 7, pp. 599-607, Aug 2000. [10] Hardenburger, P. A, "Conveyor oven." U.S. Patent No. 6,526,961, Mar 4 2003.
[11] Shukla, K. C., Hurley, J. R., Orcheski, C. J., & Grimanis, M. P, "Conveyor oven." U.S. Patent No. 4,951,648, Aug 28 1990.
[12] Smith, S. R, "Conveyorized baking oven with steam tunnel." U.S. Patent No. 8,881,646, Nov 11 2014. [13] Alden, L. B, "Infra-red baking oven." U.S. Patent No. 4,960,977, Oct 2 1990.
[14] Lee, J. H, "Infrared radiation cooker." U.S. Patent No. 8,948,579, Feb 3 2015.
[15] Westerberg, E. R., & Robert, I. B. I, "Visible light and infra-red cooking apparatus." U.S. Patent No. 5,517,005, May 14 1996.
[16] Violi, R, "Forced convection gas oven." U.S. Patent No. 7,100,596, Sep 5 2006.
[17] Onuschak, A. D, "Dual mode convection oven." U.S. Patent No. 6,116,895, Sep 12 2000. [18] Hwang, Y. I, "Overheated steam oven." U.S. Patent No. 7,143,761, Dec 5 2006.
[19] Bonuso, J. L., & Swayne, S. M, "Priority controlled multi-fan convection oven." U.S. Patent No. 8,304,695, Nov 6 2012.
[20] Blazevich, J. Z." U.S. Patent Application No. 12/365,137, Aug 5 2010.
[21] Dobie, M. J., Norris, J. R., Cooper, N. S., Bacigalupe, C., & Foreman, R. W, "Multi-shelved convection microwave oven." U.S. Patent No. 7,087,872. Aug 8 2006.
[22] Fang, L, "Microwave oven with rotary cooking apparatus." U.S. Patent No. 8,847,131, Sep 30 2014. [23] Lee, S. G, "Built-in microwave oven." U.S. Patent No. 6,528,774, Mar 4 2003.
[24] Keskin, S. O., Sumnu, G., & Sahin, S, "Bread baking in halogen lamp–microwave combination oven." Food Research International, vol. 37, no. 5, pp. 489-495, Jun 2004.
[25] Megahey, E. K., McMinn, W. A. M., & Magee, T. R. A, "Experimental study of microwave baking of Madeira cake batter." Food and Bioproducts Processing, vol. 83, no. 4, pp. 277-287, Dec 2005.
[26] Baik, O.D., Grabowski, S., Trigui, M., Marcotte, M. Castaigne, F., 1999. Heat transfer coefficient on cakes baked in a tunnel type industrial oven. Journal of Food Science, 64, No. 4 688-694.
[27] Schibukawa, S., Sugiyama, K., Yano, T. 1989 Effects of heat transfer by radiation and convention on browning of cookies at baking. Journal of Food Science, 54, No. 3, 621-624, 699.
[28] Mirade, P. S., Daudin, J., D., Ducept, F., Trystram, G., Clement, J., 2004. Characterization and CFD modelling of air temperature and velocity profiles in an industrial biscuit baking tunnel oven. Food research international, 37, 1031-1039.
[29] Ozilgen, M., Heil, J.R. 1994 Mathematical modeling of transient heat and mass transport in a baking biscuit. Journal of food processing and preservation 18, 133-148.
[30] Ameur, A. L., Mathieu, O., Lalanne, V., Trystram, G., Birlouezaragon, I., 2007. Comparison of the effects of sucrose and hexose on furfural formation and browning in cookies baked at different temperature. Food chemistry 101, 1424-1433.
[31] Chevallier, S., Della Valle, G., Colonna, P., Broyart, B., Trystram, G., 2002. Structural and chemical modifications of short dough during baking. Journal of cereal science 35, 1-10.
[32] Purlis, E., Salvadori, V.O., 2009. Modelling the browning of bread during baking. Food research international, 42, 865-870.
[33] Sakin, M., Kaymak-Ertekin, F., Ilicali, C., 2007 (b). Simultaneous heat and mass transfer simulation applied to convective oven cupcake baking. Journal of food engineering, 83, 463-474.
[34] Savoye, I., Trystram, G., Duquenoy, A., Brunet, P., Marchin, F. 1992. Heat and mass transfer dynamic modelling of an indirect biscuit baking tunnel-oven. Part I: modelling principles. Journal of food engineering, 16, 173-196. [35] Thorvaldsson, K., Skjoldebrand, C., 1998. Water diffusion in bread during baking. Lebensmittel-Wissenschaft
und-Technologie, 31, 658-663.
[36] Thorvaldsson, K., Janestad, H., 1999. A model of simultaneous heat, water and vapour diffusion. Journal of food engineering, 40, 167-172.
[37] Zhou, W., Therdthai, N., 2007. Three dimensional CFD modelling of a continuous industrial baking process. In Computation fluid dynamics in food processing, (Da-Wen Sun eds.) pp 287-312, CRC Press, Taylor and Francis Group, Boca Raton.
[39] Lostie, M., Peczalski, R., Andrieu, J., & Laurent, M. (2002b). Study of sponge cake batter baking process. II. Modeling and parameter estimation. Journal of Food Engineering, 55(4), 349–357.
[40] Lostie, M., Peczalski, R., & Andrieu, J. (2004). Lumped model for sponge cake baking during the ‘‘crust and crumb”period. Journal of Food Engineering, 65(2), 281–286.
[41] Gupta, T. R. (2001). Individual heat transfer modes during contact baking of Indian unleavened flat bread (chapati) in a continuous oven. Journal of Food Engineering, 47, 313–319.
[42] D. W. Sun., (2007). Thermal Food Processing: New Technologies and Quality Issues. 2nd Edition, Florida, Fla: CRC Press.
[43] Qashou, M., Nix, G. H., Vachon, R. I. & Lowery, G. W. (1970). Thermal conductivity values for ground beef and chuck. Food Technology, 24, 189-192.
[44] Sweat, V. E., Haugh, C. G. & Stadelman, W. J. (1973). Thermal conductivity of chicken meat at temperatures between -75 and 20°C. J. Food Sci. 33, 158-160.
[45] Ferrari, E., Marai, S. V., Guidetti, R., & Piazza, L. (2012). Modelling of Heat and Moisture Transfer Phenomena During Dry Biscuit Baking by Using Finite Element Method. International Journal of Food Engineering, 8(3). doi:10.1515/1556-3758.2326 .19
[46] Norton, T., D. W. Sun., (2007). An overview of CFD application in the food industry. In Computation fluid dynamics in food processing, (Da-Wen Sun eds.) pp 1-41, CRC Press, Taylor and Francis Group, Boca Raton. [47] A. S. Z. Abidin, M. S. Hamsawi, N. Junaidi, A.R.H. Rigit, M. S. Zafwan, S. Mohamaddan, R. Muslimen, & J.
Annisa (2018, July). Comparison Study between FEM Simulation and Experimental of Heat and Mass Transfer in Kek Lapis Sarawak Baking. In 2nd International Conference on Smart Sensors and Applications (ICSSA 2018). [48] Geankoplis, C. J. (2003). Transport processes and separation process principles (4th ed.). USA: Prentice Hall. [49] Çengel, Y. A., & Boles, M. A. (2001). Thermodynamics: An engineering approach. Boston: McGraw-Hill. [50] Mizukoshi, M., Maeda, H., & Amano, H. (1980). Model studies of cake baking. II. Expansion and heat set of cake
![Fig. 1. Flow process of cycle of a Kek Lapis Sarawak production [1].](https://thumb-us.123doks.com/thumbv2/123dok_us/8437716.1700127/2.595.193.421.165.303/fig-flow-process-cycle-kek-lapis-sarawak-production.webp)