Vision based Object Recognition of E-Puck Mobile Robot for
Warehouse Application
Mehmet S. Guzel
1, John Erwin
2,*, Wan Nurshazwani Wan Zakaria
2,31Department of Computer Engineering, Faculty of Engineering, Ankara University, 06100 Tandogan, Ankara, Turkey. 2Faculty of Electrical and Electronic Engineering,Universiti Tun Hussein Onn Malaysia, 86400 Johor, Malaysia. 3ADvanced Mechatronics Research Group (ADMIRE), Faculty of Electrical and Electronic Engineering, Universiti Tun Hussein Onn Malaysia, 86400 Parit Raja, Batu Pahat, Malaysia.
1.
Introduction
In recent years, there has been growing interest in mobile robots motion controls. Mobile robots have the ability to travel around in their environment and are freely manoeuvre in desired location. Mobile robots have been extensively used in numerous applications area such as space missions, military missions, private assistants to humans, toxic cleansing, entertainment and tour guiding [1]. Most of the developed mobile robots are relied on guided navigation either embedded in or painted on the floor to traverse the robot around the desired workstation. These types of mobile robots are tolerable for point-to-point tasks where the guide paths do not change over time [2].
Hence, the development of mobile robot to navigate and recognise an object of interest around their environment without the use of guide paths is needed to resolve the problems. The quality of a mobile robot is determined by the robot’s ability to navigate successfully in unstructured environments which in turn depends on the productivity and reliability of it sensors [3]. To provide fruitful and high dimensional information about the environment, the visual sensor is the most suitable. To improve an image processing pictorial information for human interpretation, it involves the changing of character of an image [4].
In this work, an active camera is used to recognize and object of interest. A novel object detection algorithm based on colour histogram is proposed in this paper to
reach optimum effectiveness and to detect the orientation of the object [5].
Currently, most warehouses still require human services for unloading of goods. Unloading of goods requires a continuous system to ensure the quality of work productivity. By reducing the human labour and utilizing of automated robot system, it can increase the number of working hours to unload the goods. This will improve the quality of provided services and offer higher profit improvement. This is beneficial to companies that undertake logistics services.
With the development of an autonomous mobile robot that incorporating with vision system to track a desired object, it is hope that it will enhance the effectiveness of the system compared to the current approach used in the industry.
2.
Literature Review
In most of the mobile robot application, the robot manoeuvres in an unfamiliar surroundings and relying merely on range sensor information. An environment map was used for collision free navigation and localization. It was build up based on the sensor information. To be able to get accurate information, a multiple rotating IR range sensor was used. Multiple rotating IR range sensor was used in order to scan 360o [6]. The main limitation of this approach is that the mobile robots can only navigate through the environment and cannot perform a task such as relocate or tracking an object of interest.
Abstract: At present, most warehouses still require human services for unloading of goods. Unloading of goods requires a continuous system to ensure the quality of work productivity. Therefore the need of autonomous robot system in warehouse is needed to improve the quality of work. Thus, a localization and recognition algorithm is developed and implemented on the E-puck robot. The task involves the recognition of desired object based on their colour (red and blue) and locating the desired object to the target location (marked by green marker). In addition, the collision avoidance algorithm is also developed and integrated to allow the robot manoeuvre safely in its working environment. The colour histogram technique is used to recognize the desired object and the target location. Based on the experimental results, the developed algorithm is successfully fulfilling the pick and place requirement with success rate of approximately 70% in simulation study and 50% in real implementation.
Keywords: Autonomous robot system, E-puck mobile robot, Colour histogram, Object recognition and localization.
*Corresponding author: [email protected]
2014 UTHM Publisher. All right reserved. penerbit.uthm.edu.my/ojs/index.php/ijie
Mobile robot navigation which is based on line, landmarks and sign have been widely implemented around the world. The system employed a common webcam. The vision system is considered to be very promising to navigate based on line detection. With certain improvements it has potential to produce even better line following performance [7]. The system has several advantages compared to the conventional means of line following which uses sensors and transducers. The drawback of this system is that the mobile robot is only depended on the line in order to navigate or to detect the object of interest.
One of the most relevant external sensors used in autonomous mobile robot to navigate and track an object of interest is Global Positioning System (GPS) [8]. Three satellite signals are needed to be able to determine the position of GPS receiver. The satellites synchronize their transmission and send their location at the same time. Then, the receiver measures the time of the transmitted signals to arrive and also the time differences of the received signals. The major constraint of this system is that GPS navigation cannot be used in indoor environment or in built-in area where the area is not covered [9].
In this project, the vision system approach is used to incorporate with the object detection robot. By adapting an active vision system, the inertial information provides a second modality of sensing that offers useful information for image stabilisation, control of pursuit movements or ego-motion determination. Robotics vehicles have been developed which rely on a visual sensor to observe the surrounding environment [2]. The study made a major contribution to an autonomous mobile robot that navigates through the environment with the help of vision system.
A vision system can also be further developed to assist a mobile robot to track desired objects. There are many techniques in image processing in order to pursue this system. One of the techniques is by using colour histogram. Colour histogram is used as reliable feature to model object appearance and its adaptation handles with illumination changes. Colour is a good feature in order to reduce the amount of data to process without losing the robustness of matching. The colour histogram approach is an attractive method for object recognition because of its simplicity, speed and robustness [10]. Therefore, colour histogram approach has been adapted into this project for the robot to detect the desired object.
3.
Methodology
In this project, there are several algorithm need to be considered in order to develop a recognition system of a mobile robot. In completing this project, the time factor is also taken into account. Method chosen for completing this project is crucial to ensure that the project is completed within the specified time.
The developed object detection algorithm is tested on puck robot which has built in colour CMOS camera. E-puck robot is a small mobile robot originally developed at Swiss Federal Institute of Technology in Lausanne
(EPFL) for teaching purpose. The features that make the E-puck robot as a smart choice are [11]:
• User friendly: E-puck is small and easy to setup on a table next to a computer. It does not need any cables, providing optimal working comfort.
• Elegant design: It has a simple mechanical structure, electronics design and software.
• Robustness and maintenance: E-puck is resilient under student use and easy to repair.
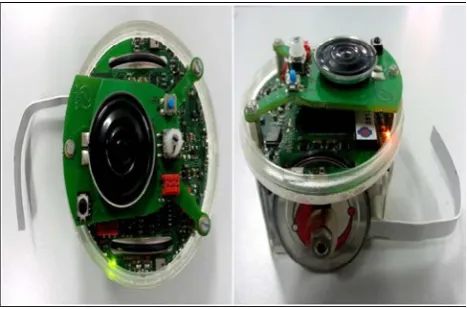
E-puck was equipped with several of devices and features as shown in Figure 3.2. The idea of this study is to navigate the robot using IR sensors and incorporating vision system by using E-puck’s camera.
Fig. 3.1 Features of an E-puck robot.
3.1 Robot Extension for Object Gripper
A gripper is mounted on the E-puck robot so that the robot can pick up the desired object and drops it at the endpoint. The object gripper is made of aluminium sheets materials. Figure 3.3 shows the L-shape object gripper with a dimension of 4cm × 4cm.
Fig. 3.2 The top view and the side view of the L-shape object gripper with a dimension of 4cm × 4cm attached at
the back of the E-puck robot.
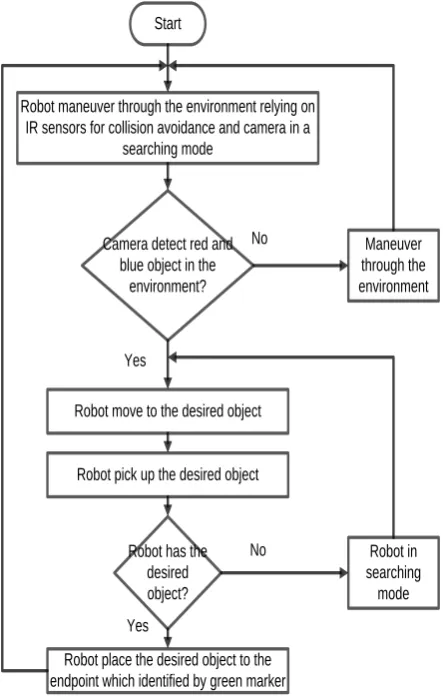
Start
Robot maneuver through the environment relying on IR sensors for collision avoidance and camera in a
searching mode
Robot move to the desired object Camera detect red and
blue object in the environment?
Robot pick up the desired object
Robot has the desired object?
Robot place the desired object to the endpoint which identified by green marker
Maneuver through the environment
Robot in searching
mode Yes
Yes
No No
Start
Initializing
Camera activation
Image acquisition
Capture image
Save image to file
End
The object gripper was attached on the left side of the back of the E-puck robot to ensure that the gripper will not interfere with the infrared proximity sensor reading and the image captured by the camera.
3.2 Development of Object Recognition and
Localization Algorithm
Webots 6.4.4 software is used to develop the algorithm and the project simulation. A C programming language is used to develop the object detection algorithm. This algorithm is capable to detect a desired object based on their colour, pick the object and place it to the desired endpoint. In this project, a colour histogram technique is proposed instead of any other technique due to its simplicity, versatility and velocity needed in tracking applications. Colour object recognition by colour indexing has been vastly proven [10]. Figure 3.3 shows flowchart of the robot behaviour for object recognition and localization task.
3.3 Object Recognition and Localization
Algorithm
Fig. 3.3 Flowchart of the robot's behaviour.
Figure 3.3 shows the whole process of the robot’s behavior for pick and place task. Through the collision avoidance algorithm, the robot is maintained to maneuver safely through the environment. The collision avoidance algorithm depends on the information of IR sensors on the robot. There are eight IR sensors on the robot but only six is used. At the same time, the camera is activated and the searching mode is activated to recognise a desired object based on their colour, which is red and blue. Once the robot recognized the desired object, the robot approached the object and places it to the endpoint which is identified by green marker.
3.4 Main Elements of Object Recognition
and Localization Algorithm
This section, explains the main elements of the object recognition and localization algorithm. The four main elements was developed which are capture image algorithm, collision avoidance algorithm, motor behavior algorithm and colour histogram algorithm.
a) Capture Image Algorithm
Fig. 3.4 Flowchart of capture image algorithm.
Figure 3.4 shows the process of capturing image using the E-puck robot. Once the robot was initialized, it activated the camera and performs image acquisition. The
wb_camera_save_image() function is used to save the image which was previously obtained with the
wb_camera_get_image() function. The image format is saved in JPEG in the best quality.
b) Collision Avoidance Algorithm
Figure 3.5 shows the process of the collision avoidance algorithm. The Webots API and the devices need to be initialised to enable the sensors and robot to function properly. There are eight IR sensors on the E-puck robot but only six were used for this algorithm. IR3
Start
Initializing
Activate IR sensor
E-puck maneuver through the environment
Read IR sensor output
Right obstacle
Left Obstacle No
obstacle
E-puck robot move
forward
E-puck robot turn left
E-puck robot turn
right
End
and IR4 were not used since it does not affect the forward motion of the E-puck robot. Figure 3.6 shows the position of the IR sensors on the E-puck robot [11].
Fig. 3.5. Flowchart of collision avoidance algorithm.
Fig. 3.6: The position of IR sensors on the E-Puck robot.
The threshold value of the infrared sensors was set to 200 respectively. E-puck robot manoeuvres through the environment and at the same time read the IR sensors output. If all the infrared sensors are less than threshold value, then the E-puck robot is continuously moving forward. When either one of the IR0, IR1 or IR2 IR sensors output reading exceeds the threshold value, the E-puck robot will turn to the left. On the other hand, when the reading of IR sensors of IR5, IR6 or IR7 exceeds the threshold value, the E-puck robot will turn to the right. In order to move forward, the same speed of both wheels was used. To turn right, left wheels speed was lower than the speed of the right wheels and vice versa for the E-puck to turn left.
c) Motor Behavior
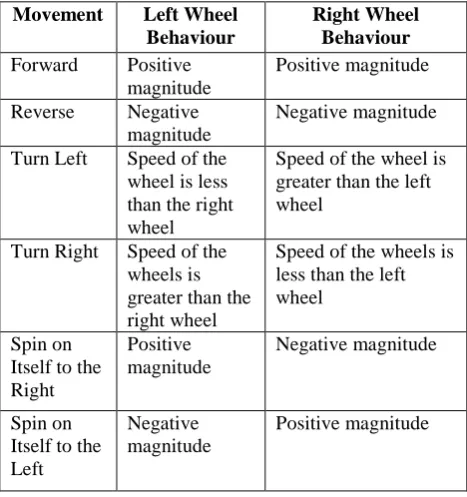
The E-puck robot can move forward, backward, turn to the right or left and even spin on itself. The maximum speed of the wheels is 1000 steps/s, which corresponds to one wheel revolution per second [11]. Differential Wheels
directives must be included in the algorithm in order to be able to use the API. A positive value of the wheel should turn the wheel forward and a negative value turn the wheel backwards.
By setting the speed of both the right and left wheels value to positive, the robot will move forward. Consequently, to make it go backwards, both speed of the right and left wheels need to be set in negative values. A straight forward or backward motion can be attained when both wheels are in the same values.
To make it turn, set one of the wheel speed value to be less than the other one. Thereupon, to make the E-puck robot turn to the left, the speed of the left wheel value need to be set less than the speed of right wheel and vice versa to make the robot turn right. This behaviour can be obtained only if the speed values of wheels are either both positive and negative. Different magnitude of speed values result in the E-puck robot spin on itself. Table 3.1 shows the summary of the motor behaviour to accomplish the specific movement of the robot.
Table 3.1. Motor behaviour to accomplish specific movement.
Movement Left Wheel Behaviour
Right Wheel Behaviour
Forward Positive
magnitude
Positive magnitude
Reverse Negative
magnitude
Negative magnitude
Turn Left Speed of the wheel is less than the right wheel
Speed of the wheel is greater than the left wheel
Turn Right Speed of the wheels is greater than the right wheel
Speed of the wheels is less than the left wheel
Spin on Itself to the Right
Positive magnitude
Negative magnitude
Spin on Itself to the Left
Negative magnitude
Positive magnitude
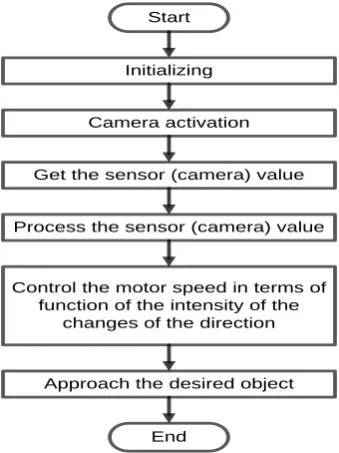
d) Colour Recognition Algorithm
Figure 3.7 shows the process of the E-puck robot to search the desired object which is red, blue and green in colour. A built in colour CMOS camera on E-puck robot was used to carry out image processing process. The colour camera permits to get the colour information from the Open Graphic Library (OpenGL) context of the camera.
Start
Initializing
Camera activation
Get the sensor (camera) value
Process the sensor (camera) value
Control the motor speed in terms of function of the intensity of the
changes of the direction
End
Approach the desired object
Fig. 3.7 Flowchart of colour recognition algorithm.
A function wb_camera_get_image is used in order to get the information from the camera and the extraction of red, green and blue channels (RGB) from the resulted image can be done by the functions
wb_camera_image_get_blue, wb_camera_image_get_red
and wb_camera_image_get_green. The width and the height of the image were obtained using the
wb_camera_get_height and wb_camera_get_width
functions.
All the information obtained from the captured image was then used to obtain the intensity of the desired colour object. The intensity information enables the E-puck robot to adapt the motor speed with respect to the changes of the direction since the robot was moving during the whole process.
Hence, the E-puck robot can approach the desired colour object. This process was also used to find the endpoint mark with green marker on one of the wall.
3.6 Simulated Environment and Real
Environment
The simulation environment was built in Webots 6.4.4. The environment is crucial for the simulation testing for the robot behaviour algorithm before it can be tested in the real environment. With Webots, a complex robotic setup can be designed and the user can design the environment as desired. The properties of each object, such as shape, colour, texture, mass and coordinates were chosen by the user. In this project, the desired environment was shown in Figure 3.8.
Fig. 3.8 The developed simulation environment.
Since the aim of this project is to develop a robot that capable to recognise red and blue object as a desired object, therefore the red and blue boxes were created in the environment. In addition, objects of different colours other than red and blue were also placed in a simulated environment intended to test the effectiveness of the algorithm that has been developed. One of the walls was painted in green to serve as the endpoint marker for the localization of the desired object.
Once the robot behaviour algorithm was successfully tested in the simulated environment, then it can be tested in the real environment. The real environment as shown in Figure 3.9 is designed with a dimension of 90cm × 60cm. The setting of the environment is almost the same as the simulated environment with red, blue and others colour boxes. The background of the environment was set to black colour and an endpoint was marked by using green paper colour at one of the wall.
Fig. 3.9 The real environment.
4.
Result and Analysis
In order to evaluate the performance of the developed object recognition and localization algorithm for E-puck mobile robot, a series of experiments is designed. This chapter discusses results and in-depth analysis of the experimental studies.
4.1 Colour Detection Algorithm
The target object in this project is identified based on their colour. In this project, RGB colour space was used. Red and blue colour was used as the target object and green colour was used to locate the target object at desired location. In this experiment, all of the four main algorithms was combined and used to obtain a complete robot’s behaviour for pick and place task.
Initially, the E-puck robot will search for the desired object which is red and blue coloured object. In the environment setting as shown in Figure 3.8 as in simulation study and Figure 3.10 as in real environment, object with different colour other than red and blue was included to test the effectiveness of the algorithm.
The E-puck robot picks up the desired with L-shape object gripper placed on the left side of the robot’s back by rotating 180° to the left as shown in Figure 4.1. Infrared sensor IR4 was used to ensure the desired object was picked by the robot and thus allowing the robot to find the endpoint which marked in green colour to place the desired object.
Fig. 4.1. The L-shape picks the desired object.
To place the desired object, the E-puck robot rotates 180° to the right to release the desired object from the hook-like-gripper. The process is continuously running. The experiment was conducted in simulation and in real environment. Figure The size of each desired object has a dimension of 3cm×3cm by width and 3cm by height.
4.2 Evaluation of a Colour CMOS Camera
A colour CMOS camera with a resolution of 640×480 pixels is mounted in front of the E-puck robot. The camera can capture a colour image of 40×40 pixels. The camera was tested in a different environment
condition to test the robustness of captured images. The setup environments are:
i. Indoor (light on) ii. Indoor (light off) iii. Outdoor
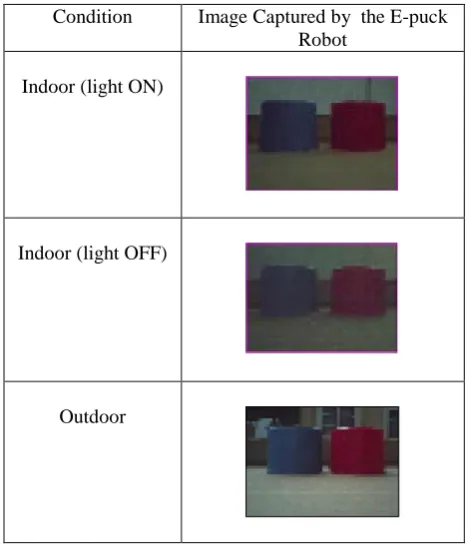
Table 4.1. The comparison of image captured on different environment condition.
Condition Image Captured by the E-puck Robot
Indoor (light ON)
Indoor (light OFF)
Outdoor
From the observation, the image captured when the light is on condition is the most clear and vivid compared to the image when the light was turn off in indoor condition. However, the image captured in the outdoor condition during the sunny day shows the best quality of image compared to the images captured in indoor environment. It can be concluded that, the camera works best only when the environment has a sufficient light source and the light intensity is scattered evenly through the environment. Therefore, an indoor environment with light on is preferable since the light source can be controlled during the day and night.
4.3 Robustness of the Captured Image against
Various Condition of Environment
Further test were conducted to get the ideal condition of environment for the E-puck robot to work effectively. The experiments were conducted at outdoor with sunlight, indoor (fluorescent light), indoor (controlled source of light) and in simulation. The objective of this test was to measure the pixel tonality of RGB colour and thus finding the colour histogram of the desired object. The pixel tonality expressed as number between 0 to 255 pixels. R0+G0+B0 equal to pure black and R255+G255+B255 equals to pure white.
All of different colour and shades of colour in RGB colour are derived from different combinations of red, green and blue. The colour of each pixel in RGB digital image is determined by the tonal value (0-255) which is assigned to each colour channel RGB for each pixel. For example, a yellow could be R255+G255+B0 which is a combination of red and green colours.
Therefore, in this test, the background of the working environment was set in black so that it will not affect the reading of the RGB tonal image. In addition, the test was carried out at various distance ranging from 10cm to 50cm to identify the effective distance to capture the object’s image as shown in Figure 4.3.
Fig. 4.3 Test being carried out at various distances.
a) Condition 1: Simulated Environment
Fig. 4.4 RGB tonal range of desired object obtained at different distances taken in simulated environment.
In Figure 4.4, the value of RGB tonal range measured in simulated environment is all same at different distances (10cm~50cm). It shows that the robot do not have any difficulties in recognising the desired object as long as the desired object was within the range of the camera vision.
b) Condition 2: Outdoor (Sunlight)
Figure 4.5 shows the RGB tonal range value of the desired object obtained at different distances measured in sunny outdoor environment condition. The result shows that the measurement obtained was not consistent and
fluctuate for red and blue colours. From this test, the best detection distance for all colours is at 10cm which the tonal range value is ranging from 130 to 150 pixels. Nonetheless, the measurement of tonal range for red, green and blue does not consistent with each other. Thus, the E-puck robot does not work best at the outdoor condition to carry out the task of this project since it gave an unstable tonal range value of RGB colours.
Fig. 4.5 Outdoor RGB tonal range of desired object obtained at different distances.
c) Condition 3: Indoor (Fluorescent Light)
Fig. 4.6 Indoor (fluorescent light) RGB tonal range of desired object obtained at different distances.
Figure 4.6 shows the RGB tonal range test in indoor (fluorescent light) environment condition. The measurement of green tonal range shows the inconsistency of reading. The measurement of blue and red tonal range is decreased as the measured distance increase. There is a huge different measurement between the three of the colour. Thus, the indoor environment condition with fluorescent light is not suitable for the E-puck robot to carry out the task of the project.
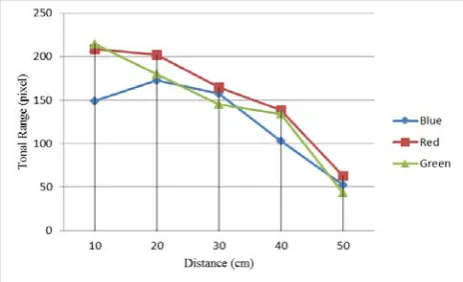
d) Condition 4: Indoor (Controlled Source of Light) Figure 4.7 shows the RGB tonal range of desired object obtained at different distances from the robot in indoor (controlled light source) environment condition. The measurement of red, green and blue tonal range shows a better consistency compared to the measurement taken in outdoor and indoor (fluorescent light)
environment condition. The measurements of all three colours are consistent in which the values of tonal range are decreased as the distance increased.
Fig. 4.7 Indoor (controlled source of light) RGB tonal range of desired object obtained at different distances.
The tonal range value of red and green at 10cm distance exceeds 200 pixels while the blue colours only manage to exceed more than 150 pixels. There is still a slight inconsistency in the tonal range measurement for blue colour. Nevertheless, the recognition rate of the desired object over different distance from the robot is higher compared to other environment conditions.
From all of the experiment data, the real environment with a controlled source of light condition was preferable to conduct the project since the rate of colour recognition is greater.
4.4 Accuracy of RGB Colour Value
In this experiment five different tones of red, green and blue colour are tested to identify the colour detection threshold value. The objective of this test is to obtain the best colour tone to be used in this project. The test is done in indoor environment with controlled light source at the distance of 20cm from the object.
Fig. 4.8 Shades of RGB colour with a range from A to E.
Figure 4.8 shows the shades of RGB colour that have been tested. There are five types of shades ranging from darkest to lightest from left to right. Figure 4.9 shows the value of tonal range of different shades of red, green and
blue colour. In Figure 4.8, the shades of RGB colour was marked from A to E which A as the darkest and E as the lightest for each of red, green and blue colours. From all three of the data, the lightest colour was selected to be used in this project since it gave the highest tonal range. Lightest shades of each colour gave the highest tonal range value due to its brightness characteristic. A highest tonal range was selected so that the probability of the camera to recognise the colour is at the highest rate.
Fig. 4.9 Tonal range of different shades of RGB colour.
4.5 Collision Avoidance Algorithm
Obstacle Avoidance function is integrated with the object recognition and localization algorithm as it is one of the crucial behaviour for the mobile robot in order to have the capability to manoeuvre safely in the unknown environment. The ability to avoid obstacles is significant for a robot to accomplish the task successfully. The IR proximity sensors are used to sense any nearby object in order to avoid the robot from collide with the object. A simple test is conducted to test the IR proximity sensors.
a) IR sensor Intensity versus Distance Test
E-puck robot was equipped with 8 infrared proximity sensors around itself. The sensor can be used to measure the distance between the robot and an object. The IR emitter emits infrared light which bounce on a potential obstacle. The received light is measured by the photo-sensor. The intensity of this light directly provides the distance of the object. The location of each sensor was shown in Figure 3.7. In this project, only 6 infrared proximity sensors were used to sense object around itself. Two of the sensors which are IR3 and IR4 (refer Figure 3.7) was not used as it is located at the back of the robot and it will not affect the collision avoidance process as the robot will consider to move forward only.
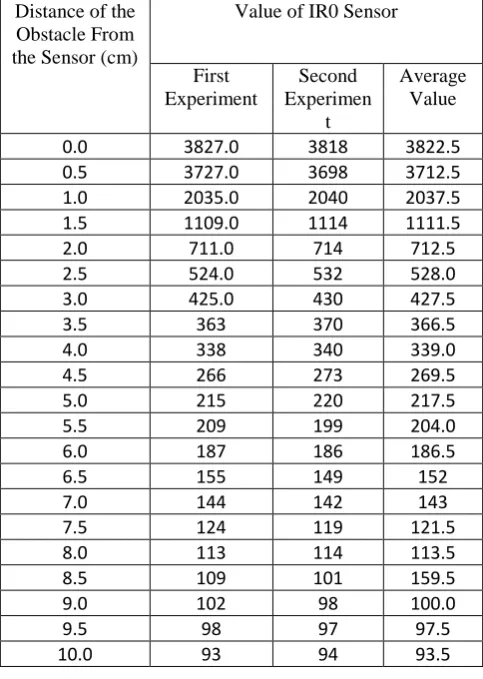
In order to get the optimum threshold value of the infrared proximity sensors, a series of experiment were conducted to measure the intensity value of the sensors against distance. The experiments were conducted two times by monitoring the value of one of the infrared proximity sensor with the respect of the object distance from the sensor. The values of the infrared proximity sensor are taken at various distances from the object ranging from 0cm to 10cm at every intervals of 0.5cm.
The following data is the experiments reading value and average value for IR0 sensor.
Table 4.2. Infrared proximity sensor value with respect to object distance.
Distance of the Obstacle From the Sensor (cm)
Value of IR0 Sensor
First Experiment
Second Experimen
t
Average Value
0.0 3827.0 3818 3822.5
0.5 3727.0 3698 3712.5
1.0 2035.0 2040 2037.5
1.5 1109.0 1114 1111.5
2.0 711.0 714 712.5
2.5 524.0 532 528.0
3.0 425.0 430 427.5
3.5 363 370 366.5
4.0 338 340 339.0
4.5 266 273 269.5
5.0 215 220 217.5
5.5 209 199 204.0
6.0 187 186 186.5
6.5 155 149 152
7.0 144 142 143
7.5 124 119 121.5
8.0 113 114 113.5
8.5 109 101 159.5
9.0 102 98 100.0
9.5 98 97 97.5
10.0 93 94 93.5
Table 4.2 shows the readings of the sensors with respect to the distance. The experiment was repeated two times in order to get the average value of the sensor.
Fig. 4.10 Average value of IR0 sensor with respect to object distance.
Figure 4.10 shows the graph of the average value of IR0 sensor with respect to the object distance. From the
graph, it was found out that when the robot is very near to the object or an obstacle the average maximum amount of infrared measured in real environment was around 3822.5 which is correspond to 0cm. In order to process the signals of the infrared sensors, a threshold value for each was established through experimentation. This means that whenever the signal is larger than the threshold value, it is considered that the robot is too close to an object and it must change its direction in order to avoid the obstacle. Thus, the IR0, IR1, IR2, IR5, IR6 and IR7 were set to the optimum threshold value to give the robot enough time to change the direction before a head-on collision. In this project, each of the infrared proximity sensor threshold value was set to 200 which correspond to a distance around 4cm. This provides an enough time for the robot to respond.
b) Effect of Object Colour on Infrared Proximity
Sensor Intensity Value
From the experiment that has been carried out in the previous section, it was found out that the optimum threshold value of the infrared proximity sensor was 200 which indicate the distance between the robot and the object was around 4cm. From the finding, an experiment was carried out to see whether the colour of the object affect the collision avoidance behaviour of the robot at three different distance of 3cm, 4cm and 5cm. The result obtained was shown in Figure 4.11.
Fig. 4.11 The effect of object’s colour on IR sensor value.
The infrared proximity sensor loses its sensitivity when the black coloured object is detected. This is due to the black colour absorbing the infrared beam emitted by the emitter and causes less reflection of infrared received by the receiver. There was 69%, 61% and 55% of reduction in measurement of reflected infrared received by the receiver respectively for each distance compared to the measurement of reflected infrared when the object colour is white. The white object reflect back the infrared emitted by the transmitter better than the black object and thus make the robot more sensitive to avoid obstacle.
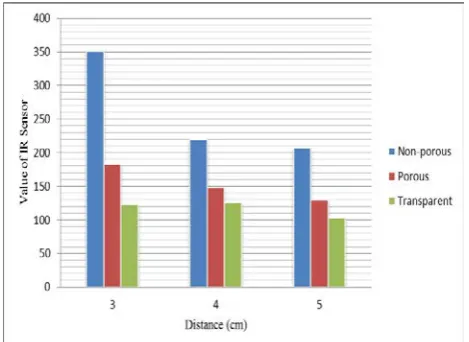
c) Characteristic of the Object’s Material
The characteristic of the object’s material also affect the measurement of reflected infrared received by the receiver. Since it was found out that a brighter object
good in reflecting back the infrared emitted, thus the experiment was carried out with a bright colour object but different in material characteristic. A white cloth used to represent porous material, white box for the non-porous material and a mineral water bottle for the transparent material.
Fig. 4.12.Value of IR sensor with respect to the object’s material characteristic.
Figure 4.12 shows that an obstacle that have the non-porous characteristic have the good ability in reflecting back the infrared emitted by the infrared sensor. By comparing the object that have the porous characteristic with the non-porous characteristic, it shows a 48%, 32% and 31% of reduction in the amount of infrared measured by the receiver of infrared sensor with respect to the distance of the object to the robot from 3cm, 4cm and 5cm respectively.
An object with a transparent characteristic shows the worst reduction in the amount of infrared measured by the receiver of the infrared sensor by a reduction of 65%, 42% and 50% respectively for each distance when compared to the object with non-porous characteristic. In conclusion, a non-porous object was selected to be used in this project to ensure the effectiveness of the collision avoidance algorithm.
4.6 Control of Motor Behaviour
To reach the goal of the project, the ability to control the movement and speed of the robot is crucial. The E-puck robot used differential wheels while the movement based on the speed of rotation and its direction. If both the wheels are driven same direction and speed, E-puck will move forward. If both wheels are turned with equal speed in opposite directions, so E-puck will turning left or right.
E-puck has two stepper motors that have 20 steps per revolution and the gear has a reduction of 50:1 [11]. Thus the maximum speed of stepper motor is ±1000steps/s.
Fig. 4.13. Differential drive robot schema.
E-puck is equipped with a differential drive as shown in Figure 4.13 to control the robot. The wheel diameter is 4.1cm and the distance between the two wheels is 5.3cm [11]. Thus, from the radius of the wheel and the distance between the two wheels, the maximum of linear and rotational speed can be calculated.
Linear speed
V = ωr (4.1) = 2π × 2.05cm
= 12.9cm/s.
Rotational Speed
In order for the robot to rotate, one of the wheels rotates in counter-clockwise direction and the other in clockwise direction. The negative (-) sign shows the magnitude of counter-clockwise direction and it will not affect the calculation.
V = r(ω1+ ω2)/2 (4.2)
= 4.86 rad/s.
a) Test on Motor Behaviour (Optimum Speed)
Test was conducted to get the ideal speed for the E-puck robot to work effectively. An adequate amount of time is needed for the robot’s camera to process the image captured. Therefore, a test to find the probability of success of the E-puck robot to get the target object with a different speed was conducted. To determine the probability of success, tests were conducted ten times for each set of speed. The test is done in indoor environment with the controlled light source.
Fig. 4.14 Probability of the task success at different speed.
Figure 4.14 shows the probability of the success of the robot to get the target object at different set of speed. When the speed of the robot set to 100steps/s and 200steps/s, it shows a 90% of success for the robot to get the targeted object. Above the speed of 200steps/s, the probability of success decreases. Thus, the optimum speed to be used in this project is 200steps/s for its high probability of task success and the efficiency in time consuming.
4.7 Effectiveness of Object Recognition and
Localization for E-puck Robot
The developed algorithms were tested for its effectiveness in the real environment and in simulated environment. The test were conducted in the ideal condition for the real environment and the IR sensors and speed was set to its optimum value. The tests were conducted ten times for each set of the task to find the probability of its successfulness.
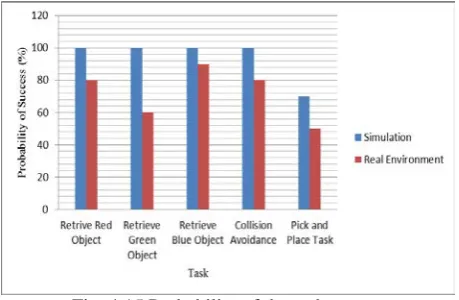
Fig. 4.15 Probability of the task success.
Figure 4.15 shows the probability of the task success being carried out by the E-puck robot in the simulation and real environments. 100% of task have being successfully carried out in simulated environment to retrieve red, green and blue and simultaneously avoids any obstacle in the desired path. In the real environment implementation, a declination of 20%, 40%, 10% and 20% are shown of each of this task respectively. The best colour object that the robot can detect is blue colour.
This is because the sensitivity of the sensors in real environment is different in the simulated environment. From the data obtained from the previous experiment that tested out the sensitivity of the infrared sensors and camera, it shows that both of the infrared sensors and camera is less sensitive in the real environment compared to the simulated environment. Plus, the environment condition may also affect the reading of the sensors in the real environment.
For the pick and place task, the percentage of success in simulated environment is 70% and only 50% in real environment. Pick and place task is the combination of the entire algorithm developed. When the tasks were carried out separately in the simulated environment, the probability of success is 100% for each task. When the entire algorithm for each task was combined to create a
pick and place task, the probability of success is only 70% when it was carried out in the simulated environment. There are two factors that might contribute to this probability of success that is the ability of the camera to measure the tonal range of desired object colour and the ability of the camera to keep the desired object in sight.
The percentage of success for the pick and place task being carried out in the real environment shows only 50% successful rate. Both of the factors mentioned before was the main reason for the probability of success for the pick and place task being carried out in the real environment to be decreased. In addition, based on the test in which the RGB tonal range of one colour object was measured, other colours’ tonal range value is also being detected. Sometimes this value surpassed the desired object colour. Thus, it contributes to the rate of failure of this project.
4.8 Summary
To summarize, the optimum threshold of the sensors value of the infrared sensors and camera were obtained through a series of experiment in the simulated and real environments. From the data obtained, the optimum value of each sensors threshold was set in the algorithm in order to produce a better and effective algorithm. The speed of the motor was also being tested to get the ideal speed for the E-puck robot to work effectively. The object recognition and localization algorithm was implemented to the E-puck robot and the performance and the effectiveness of the algorithm were tested on both simulated and real environments.
5.
Conclusion and Recommendation
5.1 Conclusion
As a conclusion, this project has been done successfully and completely. The object recognition and localization algorithm was successfully developed and being implemented on E-puck mobile robot. It was able to recognise the desired object based on their colour which is red and blue, pick the desired object and locate it at the endpoint which marked in green colour. At the same time, it was able to avoid collision with obstacle in the environment.
The rate of success of this project in the real environment is not as high as in the simulated environment due to some factors. One of it was the sensitivity of the sensors (camera and infrared). This reason is supported by the experiment that has been carried out to both of the sensors. The tonal range measurement of the desired object colour is not consistent as in the simulated environment. In addition, other factors that contribute to this problem is the quality of the camera and the ability of the camera to keep the desired object in sight.
Moreover, in this project, the ability of the camera to extract the tonal range for the desired object colour is crucial. Thus, a histogram with RGB tonal range higher is preferable for this project. It will help in increasing the
rate of success in recognising the desired object based on their colour.
Throughout doing this project, many problems had occurred. It is undeniable that having knowledge in C programming is really needed in developing the algorithm and in finishing the project generally.
A continuation of work will be done in achieving the most effective algorithm to establish an object detection algorithm based on colour histogram for the application in autonomous robot system used in industry.
5.2 Recommendation
Overall, further improvement should be made to enhance the project reliability and improve the functionality. Here some recommendation that might be considered to increase the effectiveness of project in the future which are:
i. Using a better technique of image processing in order to get the desired object.
ii. Using a high quality camera for the purpose of image processing.
iii. Using multiple of camera so that the rate of success in recognising desired object based on their colour is higher.
iv. Improve the algorithm so that the execution of task is efficient and effective.
References
[1] A. Gopalakrishnan, S. Greene, and a. Sekmen, “Vision-based mobile robot learning and navigation,” ROMAN 2005. IEEE International Workshop on Robot and Human Interactive Communication, 2005., pp. 48–53, 2005.
[2] E. T. Baumgartner and S. B. Skaar, “An autonomous vision-based mobile robot,” IEEE Transactions on Automatic Control, vol. 39, no. 3, pp. 493–502, Mar. 1994.
[3] E. Sahin and P. Gaudiano, “Development of a visual object localization module for mobile robots,” 1999 Third European Workshop on Advanced Mobile Robots (Eurobot’99). Proceedings (Cat. No.99EX355), pp. 65–72, 1999.
[4] A. Mcandrew, “An Introduction to Digital Image Processing with Matlab Notes for SCM2511 Image Processing 1 Semester 1 , 2004,” 2004.
[5] X. Chen, Q. Huang, P. Hu, M. Li, Y. Tian, and C. Li, “Rapid and precise object detection based on color histograms and adaptive bandwidth mean shift,” 2009 IEEE/RSJ International Conference on Intelligent Robots and Systems, pp. 4281– 4286, Oct. 2009.
[6] H. Park, S. Baek, and S. Lee, “IR sensor array for a mobile robot,” Proceedings, 2005 IEEE/ASME International Conference on Advanced Intelligent Mechatronics., pp. 928–933, 2005.
[7] a. H. Ismail, H. R. Ramli, M. H. Ahmad, and M. H. Marhaban, “Vision-based system for line following mobile robot,” 2009 IEEE Symposium on Industrial Electronics & Applications, no. Isiea, pp. 642–645, Oct. 2009.
[8] J. Lobo, L. Marques, J. Dias, U. Nunes, and A. T. De Aimeida, “Sensors for Mobile Robot
Navigation.” 1998 Lecture Notes in Control and Information Sciences, pp. 50-81, 1998.
[9] P. Kucsera, “Sensors for mobile robot systems,” vol. 5, no. 4, pp. 645–658, 2006.
[10] B. Schiele and J. L. Crowley, “Probabilistic Object Recognition Using Multidimensional Receptive Field Histograms,” pp. 50–54, 1996.
[11] E-puck (2006). E-puck education robot. Retrieved on October 2, 2013, from http://www.e-puck.org.