Article
1
STUDY OF THE WATER QUALITY OF A
2
TROPICAL RESERVOIR
3
Alberto Quevedo-Castro1, Jesús L. Lopez1, Jesus Gabriel Rangel-Peraza1, Erick Bandala3,
4
Yaneth Bustos-Terrones2*
5
1 Division of Postgraduate Studies and Research, Technological Institute of Culiacán, Juan de Dios Bátiz 310,
6
Col. Guadalupe. CP. 80220. Culiacán, México.
7
2 CONACYT-Division of Postgraduate Studies and Research, Technological Institute of Culiacán, Juan de
8
Dios Bátiz 310, Col. Guadalupe. CP. 80220. Culiacán, México.
9
3 Division of Hydrologic Sciences, Desert Research Institute. 755 Flamingo Road, Las Vegas,
10
Nevada 89119-7363.
11
*Correspondence: ybustos.mx@gmail.com; Tel.: +526672367132
12
ABSTRACT: A study of the water quality of the Adolfo López Mateos Reservoir (ALMD) was
13
developed through different indicators from a spatial and seasonal perspective. Variables related to
14
the general characteristics of water quality, trophic level and ecological risk were assessed through
15
the water Quality Index (WQINSF-BROWN), Trophic State Index (TSICARLSON) and the Ecological Risk
16
Index (RIHAKANSON). Using data from physical, chemical and biological parameters obtained from
17
four sampling points in the ALMD, the water quality was assessed in each model used. The results
18
indicated that the reservoir presents a water quality classified as "medium" (WQINSF-BROWN= 70),
19
where significant variations in the concentrations of some parameters are observed. The reservoir
20
showed a general trophic state classified as "Mesotrophic" (TSIGENERAL-AVERAGE = 43.04). The ecological
21
risk analysis achieved the best classification of the methodology, discarding contamination by heavy
22
metals in surface waters. Through this type of applied methodologies will help as decision making
23
tools in the dam, as well as for application in other dams in the region.
24
Keywords: Tropical reservoir; water quality index (WQI); trophic state index (TSI); ecological risk
25
index (ERI); ecological risk assessment (ERA)
26
27
1. Introduction
28
Water resources are dynamically influenced by several factors such as human, agricultural and
29
industrial activities. For this reason waterbodies show a poor water quality [1]. The assessment of
30
water quality is obtained through the study of physical, chemical and biological components, which
31
are related to natural phenomena, human effects and their possible uses. The reservoirs play a
32
fundamental role from the ecological point of view. Therefore, a poor water quality puts in risk the
33
sustainability and survival of the ecosystems and their species [2, 3].
34
The contamination of waterbodies is commonly affected due to the increase in contaminant
35
concentrations as a consequence of agrochemical abuse, upstream mining leachates, the use of
36
herbicides in anti-narcotics campaigns, domestic waste and discharges of wastewaters, as well as the
37
presence of species of aquatic lily produced by eutrophication in reservoirs [4, 5]. Contaminants
38
entering a water body naturally or anthropogenically are retained in sediments and deposited at the
39
bottom of these aquatic ecosystems, causing toxic effects on aquatic systems. These deposits are of a
40
great scientific value since they retain a historical record of the type of pollution that has taken place
41
Preprints (www.preprints.org) | NOT PEER-REVIEWED | Posted: 28 December 2018
© 2018 by the author(s). Distributed under a Creative Commons CC BY license.
Preprints (www.preprints.org) | NOT PEER-REVIEWED | Posted: 28 December 2018 doi:10.20944/preprints201812.0335.v1
© 2018 by the author(s). Distributed under a Creative Commons CC BY license.
in the surrounding areas. Besides, when the sediments interact with the surface water currents, they
42
move the retained contaminants and alter the general dynamics of the water mass [6]. Thus,
43
variations in pH, salinity and the properties of the redox potential can cause the mobilization and
44
resuspension of chemical particles accumulated in the sediments, magnifying even its toxic effect,
45
such as the case of heavy metals. Heavy metals are largely derived from anthropogenic sources, such
46
as domestic, agricultural and industrial waste and constitute a danger to aquatic biota and human
47
beings, as well as an environmental deterioration factor [7].
48
The monitoring and evaluation of water quality involve an analysis of various parameters that
49
evidence the degree of alteration of natural variations of a waterbody. These variations are analyzed
50
through indicators that quantify water quality for a given use from a holistic perspective [8, 9].
51
However, the efforts made in the literature only show applications from a specific perspective for
52
each indicator, considering only partial diagnoses of water quality that can be affected by various
53
sources of pollution such as eutrophication or contamination by heavy metals. Different
54
mathematical tools are proposed in order to integrate indicators that show a broader diagnosis
55
through the application of multiparameter indicators in tropical water bodies. One of them is the
56
Water Quality Index (WQI), which represents a numerical classification involved in the decision
57
making of water resources to diagnose the spatial and temporal variation of contaminants and
58
facilitating the treatment and analysis of a large amount of data [10, 11]. The most commonly method
59
used for the computation of the WQI is the one proposed by Brown and the NSF (National Sanitation
60
Foundation) [12-15].
61
Another tool is the Trophic State Index (TSI), which is used to define the trophic status of a
62
waterbody. The Carlson TSI considers the annual average values of transparency by using the depth
63
of Secchi disk, surface concentrations of total phosphorus and chlorophyll-α [16-18]. Finally, the
64
Ecological Risk Index (ERI), developed by Håkanson [19], is used to calculate the toxicity coefficient
65
of various metallic elements [20-23]. The integration of metric tools in the evaluation of the water
66
quality allows extending the assessment of water quality of aquatic ecosystems from several
67
perspectives [24].
68
Multiparametric studies in water bodies show a broader picture than works that only consider
69
water quality parameters analyzed in insolation. Due to the scarce information in the implementation
70
of various indices in tropical water bodies, this work aims to undertake a comprehensive study of
71
water quality by implementing the WQI, TSI and ERI indexes, considering physical, chemical and
72
biological parameters, those concerning to eutrophication and some that represent ecological risk for
73
the Adolfo López Mateos Reservoir (ALMD).
74
2. MATERIALS Y METHODS
75
2.1. .Study area
76
Adolfo López Mateos (ALMD) is located in the state of Sinaloa to the north of Mexico (25° 05'
77
25" North Latitude and 107° 23' 00" West Longitude). ALMD is one of the most important tropical
78
reservoirs in the region and contributes to the water supply for the production of agricultural foods,
79
being the region with the largest export in the country. This reservoir is the largest in surface
80
extension (11.354 Ha) and has a conservation capacity of 3.087 Mm3. Therefore, this reservoir is
81
essential for irrigating the most important agricultural valley in Mexico [25]. The modification of the
82
environment by the construction of hydraulic systems for the control of avenues, logging and
83
accelerated deforestation, construction of roads, dismantling and diversion of currents can change
84
the water quality of the reservoir [26].
85
Preprints (www.preprints.org) | NOT PEER-REVIEWED | Posted: 28 December 2018
Preprints (www.preprints.org) | NOT PEER-REVIEWED | Posted: 28 December 2018 doi:10.20944/preprints201812.0335.v1
This work was carried out using data provided by the National Water Commission of Mexico
86
(government agency which is the watershed operator). This information was obtained every six
87
months in ALMD through the National Monitoring Network. For this work, the physicochemical and
88
biological data consisting of the period of 2012-2017 were used. The monitoring was conducted
89
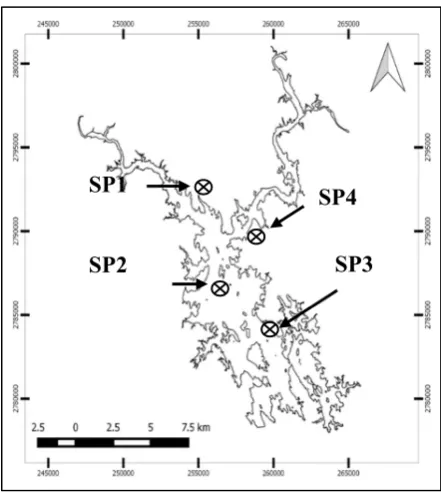
biannually at 4 sampling points of the ALMD (Figure 1). The sampling, transportation and
90
preservation of samples were carried out in accordance with standard methods. The samples were
91
analyzed in an accredited laboratory by the Mexican Accreditation Entity, based on international
92
standard methods for water analysis [27].
93
94
95
Figure 1. Sampling points of the PALM.
96
2.2. Water Quality Index
97
To simplify the interpretation of the physicochemical and biological parameters of ALMD, the
98
NSF-brown Water Quality Index (WQINSF-BROWN) was used [28]. The WQINSF-BROWN showed the water
99
quality state of the reservoir by using the averages of the concentrations obtained from 9 parameters
100
of water quality for seven years (2012-2017) in 4 sampling points (SP1-SP4). A linear mathematical
101
model (Equation 1) was used in order to calculate WQINSF-BROWN. This model involves the use of nine
102
water quality parameters: Fecal coliforms (FC), Biochemical oxygen Demand (BOD5), nitrates (NO3),
103
phosphates (PO4-), hydrogen potential (pH), dissolved oxygen (DO), total dissolved solids (TDS),
104
temperature (Tem) and turbidity (Tur). Weights (wi) were assigned for each parameter and the
105
quality distributions (Subi) were used based on the established by the aforementioned methodology.
106
𝑊𝑄𝐼
= ∑
𝑆𝑢𝑏 ∗ 𝑤 )
(1)
107
Where wi is the relative weight assigned to each parameter weighted between 0-1. The sum of
108
the 9 weights must be equal to 1 (Table 1). The value Subi represents the score obtained as a function
109
of water quality parameter. This value depends on the probability distribution for each parameter.
110
SP1
SP2
SP4
SP3
Preprints (www.preprints.org) | NOT PEER-REVIEWED | Posted: 28 December 2018
Preprints (www.preprints.org) | NOT PEER-REVIEWED | Posted: 28 December 2018 doi:10.20944/preprints201812.0335.v1
The mean value of each water quality parameter represents a score between 0 and 100. The higher
111
the score is, the better the quality of water. The index result was classified according to the scale
112
proposed by the National Sanitation Foundation (NSF) (Excellent = 91-100; Good = 71-90; Fair =
51-113
70; Marginal= 26-50; Poor = 0-25) [28].
114
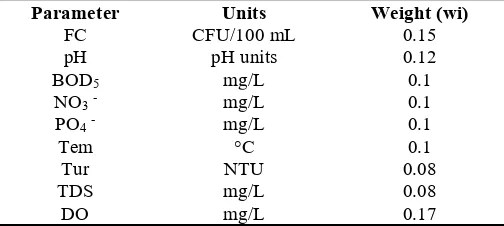
Table 1. Water quality variables used in the WQINSF-BROWN calculation.
115
Parameter Units Weight (wi)
FC CFU/100 mL 0.15
pH pH units 0.12
BOD5 mg/L 0.1
NO3- mg/L 0.1
PO4- mg/L 0.1
Tem °C 0.1
Tur NTU 0.08
TDS mg/L 0.08
DO mg/L 0.17
2.3. Trophic State Index
116
The criteria for evaluating eutrophication in a waterbody consider the analysis of nutrient
117
concentrations, the amount of chlorophyll a (Chla) and total phosphorus (TP), as well as the
118
transparency (Tra) with Secchi Disk [29, 30]. The classification of trophic state is based on the nutrient
119
that represents a primary production limitation. In most of the cases, the limiting nutrient is
120
phosphorus in waterbodies, in particular in those located in tropical regions [11, 31-33]. The
121
evaluation of eutrophication in ALMD was carried out using the Carlson Trophic State Index [34]
122
(TSICARLSON). The scale of the TSICARLSON varies between 0-100, where; TSICARLSON < 30 = oligotrophic,
123
30 < TSICARLSON < 60 = Mesotrophic, 60 < TSICARLSON < 90 = eutrophic and 90 < TSICARLSON < 100 =
124
hypertrophic. TSICARLSON is obtained by calculating the mathematical equations established in
125
Equations 2 to 5 using the mean values of the parameters that compose the index; Transparency
126
(TSITra) determined by measuring the Secchi Disk depth, while chlorophyll concentration (TSIChla) and
127
Total Phosphorus (TSITP) were carried out using standard methodologies [27]. Ln is the calculation
128
of the natural logarithm.
129
𝑇𝑆𝐼
= 9.81 𝐿𝑛 [𝐶ℎ𝑙𝑎
] + 30.6
130
(2)
131
𝑇𝑆𝐼
= 60 − 14.4 𝐿𝑛 [𝑇𝑟𝑎 𝑚)]
132
(3)
133
𝑇𝑆𝐼 = 14.42 𝐿𝑛 [𝑇𝑃
] + 4.15
134
(4)
135
𝑇𝑆𝐼
=
[ ]136
(5)
137
Preprints (www.preprints.org) | NOT PEER-REVIEWED | Posted: 28 December 2018
Preprints (www.preprints.org) | NOT PEER-REVIEWED | Posted: 28 December 2018 doi:10.20944/preprints201812.0335.v1
2.4. Ecological Risk Index
138
The pollution produced by high levels of heavy metals in water bodies has been a major concern
139
for the scientific community because of the impact of toxicity levels on aquatic ecosystems ecology
140
[35, 36]. The content of harmful metals in the water increases significantly due to the discharge of
141
industrial waste, the combustion of fossil fuels, domestic wastewater, water transport and
142
agricultural irrigation [37]. An ecological risk assessment is the process used to verify how the
143
environment is affected as a result of exposure to one or more environmental stressors such as
144
chemicals, land change, disease, invasive species and climate change [38]. When an aquatic ecosystem
145
is exposed to contaminants, waterbodies should be analyzed from various components, including
146
physical, chemical and biological parameters, and the amount of metals influenced by some
147
hydrological factors such as dispersion, advection and dilution or by some geochemical processes
148
such as adsorption-desorption, precipitation and diffusion [39]. In this study, the Ecological Risk
149
Index (ERI) was used as a fast and practical tool for environmental risk assessment in ALMD. This
150
methodology is proposed by Håkanson [19] and suggests the classification of contamination in a
151
waterbody and the identification of the toxic substances in order to take actions for the control and
152
mitigation of this contamination [40-42]. Ecological Risk Index is based on the Equations 6 and 7:
153
𝑅𝐼
Å= ∑
𝐸𝑟 = ∑
𝑇𝑟 ∗ 𝐶
(6)
154
C
d=
∑
𝐶 = ∑
̅155
(7)
156
Where RIHAKANSON is the ERI presented by the waterbody, 𝐸𝑟 the factor of the potential
157
ecological risk and 𝑇𝑟 the toxic response factor of a given substance (i = mg/L). ERI is defined as the
158
sum of all the risk factors (𝐸𝑟). On the other hand, it is also necessary to calculate the degree of
159
pollution (Cd) by obtaining the factor of pollution of each metal (𝐶 ). This factor is obtained by the
160
ratio between the mean concentration of the metal (𝐶̅ ) and the reference concentration given by
161
the Standard Preindustrial Impact (𝐶 ) (Table 2).
162
Table 2. Rating scale for Eri and RIHAKANSON.
163
Eri. Potential ecological risk for substance
< 40 Low
40 ≤ Eri< 80 Moderate 80 ≤ Eri< 160 Considerable 160 ≤ Eri< 320 High
≥ 320 Very high
RI Ecological risk for lake/basin
< 150 Low
150 ≤ RI < 300 Moderate 300 ≤ RI < 600 Considerable
RI ≥ 600 Very high
For the calculation of each 𝑇𝑟 value, the equations of the toxic-response of the methodology
164
were considered (HG = 40 * 5/BPI, Cd = 30 * √ 5/√ BPI, As = 10, Pb = Cu = 5 and Cr = 2 * √ 5/√ BPI. Each
165
𝐶 was obtained by dividing the mean concentration of the heavy metals (𝐶̅ ), where the reference
166
values given by the methodology (𝐶 ) were: Hg = 0.25, Cd = 1.0, As = 15, Pb = 70 and Cr = 90).
167
Preprints (www.preprints.org) | NOT PEER-REVIEWED | Posted: 28 December 2018
Preprints (www.preprints.org) | NOT PEER-REVIEWED | Posted: 28 December 2018 doi:10.20944/preprints201812.0335.v1
3. RESULTS AND DISCUSSION
168
3.1. Selection of parameters
169
ALMD is under the supervision of the national militia to safeguard the integrity of the reservoir
170
with the support of CONAGUA, which is the operator responsible for the control of facilities and the
171
monitoring of the water quality parameters. The water quality data were analyzed from a temporal
172
and spatial perspective studying the behavior of the parameters for the determination of each index.
173
By integrating components that define the health of reservoirs using multiparameter measurements
174
from various perspectives, a better diagnosis is obtained in the extension of the water quality
175
assessment. Unlike recent classical non-multiparameter studies that only evaluate WQI, TSI and ERI
176
from a specific point of view [43-45], the proposed multiparametric study opens the gap by
177
considering a panorama that deepens the understanding of those natural intrinsic processes or
178
anthropogenic that impact on the quality of reservoir water over time from a global context. Due to
179
the nulls efforts to integrate multiparameter parameter analysis tools, a series of physical, chemical
180
and biological parameters (Table 3) were used for the computation of WQINSF-BROWN. Aspects related
181
to the eutrophication of the reservoir were addressed in TSICARLSON and the toxicity of some heavy
182
metals was assessed through the ecological risk analysis (RIHÅKANSON). A Pearson correlation analysis
183
was also carried out to identify the degree of correlation between variables with respect to the water
184
quality of ALMD. The bold numbers represent the variables that had more significant correlation (P
185
< 0.05) (Table 4).
186
Preprints (www.preprints.org) | NOT PEER-REVIEWED | Posted: 28 December 2018
Preprints (www.preprints.org) | NOT PEER-REVIEWED | Posted: 28 December 2018 doi:10.20944/preprints201812.0335.v1
Table 3. Parameters of water quality used in the ERA.
187
Ecological
indexes Parameter Units
Temporal variation average Spatial variation average
Mean Max value
Min value
Standard deviation 2012 2013 2014 2015 2016 2017 SP1 SP2 SP3 SP4
WQI NSF-BROWN
FC CFU/100
mL 206 2127 221 598 127 992 729 661 851 759 834 5794 1 1275.5
pH pH
units 7.58 7.37 7.76 7.71 8.26 9.25 8.05 7.98 8.07 8.01 7.91 9.5 7.07 0.62
BOD5 mg/L 6.02 2.66 5.38 3.03 2.0 3.46 3.63 3.64 3.53 3.43 3.45 9.7 2 2.3
NO3- mg/L 0.01 0.24 0.04 0.02 0.01 0.02 0.07 0.07 0.04 0.07 0.06 0.59 0.001 0.15
PO4- mg/L 0.04 0.03 0.02 0.03 0.01 0.02 0.03 0.03 0.02 0.02 0.02 0.09 0.001 0.02
Tem °C 32.4 31.2 29.1 28.8 30.7 29.2 29.9 30.1 29.8 30.1 29.69 33.8 24.5 2.73
Tur NTU 2.1 22.1 1.8 1.6 2.2 3.3 6.5 8.9 2.5 5.4 6.31 74 0.88 13.10
TDS mg/L 119 117 147 97 109 101 119 116 111 115 115 156 82 21.45
DO mg/L 3.65 5.07 7.28 6.77 9.63 9.90 7.50 7.20 7.54 7.22 7.3 12.1 2.93 2.62
TSICARLSON
Chla mg/m3 2.4 18.1 4.03 12.7 4.2 3.5 8.5 7.62 11.3 6.07 9.2 37.3 0.05 9.5
Tra m 2.4 0.63 1.8 2.7 1.12 1.39 1.51 1.65 1.71 1.62 1.6 3.4 0.4 0.86
TP mg/L 0.07 0.25 0.06 0.08 0.10 0.04 0.10 0.11 0.09 0.11 0.11 0.52 0.02 0.12
RIHÅKANSON
As mg/L 0.0014 0.0028 0.0023 0.0014 0.0014 0.0036 0.0014 0.0032 0.0014 0.0022 0.0020 0.0127 0.0014 0.0024
Cd mg/L 0.0002 0.0002 0.0002 0.0002 0.0002 0.0002 0.0002 0.0002 0.0002 0.0002 0.0002 0.0002 0.0002 1.37E-19
Cr mg/L 0.0003 0.0067 0.0003 0.0003 0.0011 0.0003 0.0014 0.00153 0.00181 0.0022 0.0017 0.0154 0.0003 0.0037 Hg mg/L 0.0001 0.0005 0.0001 0.0002 0.0001 0.0001 0.00016 0.00016 0.0003 0.00015 0.00019 0.0013 0.0001 0.00025
Pb mg/L 0.0015 0.0015 0.0015 0.0015 0.0015 0.0015 0.0015 0.0015 0.0015 0.0015 0.0015 0.0015 0.0015 8.78E-19
188
Preprints
(www.preprints.org) | NOT PEER-REVIEWED | Posted: 28 December 2018
Preprints
(www.preprints.org) | NOT PEER-REVIEWED | Posted: 28 December 2018
doi:10.20944/preprints201812.0335.v1
Peer-reviewed version available at
Environments
2019
,
6
, 7;
Table 4. Pearson correlation matrix for water quality parameters.
189
Parameter Chla Tra TP FC BOD5 NO3- pH TDS DO PO4- Tur
Tra -0.0714
TP 0.1035 -0.3557
FC 0.1865 -0.4641 0.5241
BOD5 -0.0096 0.3272 -0.1678 -0.1757
NO3- 0.1508 -0.3848 0.89 0.6818 -0.0806
pH -0.1622 -0.2232 -0.3966 0.0392 -0.213 -0.3271
TDS -0.2484 -0.0968 -0.031 -0.1798 0.2839 0.0908 -0.3352
DO -0.2632 -0.1937 -0.174 -0.1482 -0.1767 -0.2293 0.7597 -0.3385
PO4- 0.3632 0.3133 0.3395 0.1128 0.2151 0.4045 -0.2635 0.0561 -0.3643
Tur 0.1846 -0.4621 0.7583 0.826 -0.0798 0.8493 -0.2597 0.0237 -0.2985 0.2702
Tem -0.1783 -0.2145 0.1391 -0.0985 -0.3134 0.0526 -0.3628 0.4309 -0.4706 -0.0406 0.0617
190
Preprints
(www.preprints.org) | NOT PEER-REVIEWED | Posted: 28 December 2018
Preprints
(www.preprints.org) | NOT PEER-REVIEWED | Posted: 28 December 2018
doi:10.20944/preprints201812.0335.v1
Peer-reviewed version available at
Environments
2019
,
6
, 7;
3.2. Water Quality Index
191
To calculate the WQINSF-BROWN, each subscript (Subi) of the nine parameters that compose the
192
methodology [28] was calculated through the probability distributions that express the water quality
193
related to the concentration means obtained each year (Table 5) and for each sampling point (SP)
194
(Table 6). The value obtained from probability distribution (Subi) was multiplied by the weight (Wi).
195
WQIValue (Subi*Wi) was calculated for each parameter and these values were added (∑ WQIValue) to
196
calculate the WQINSF-BROWN (Table 7).
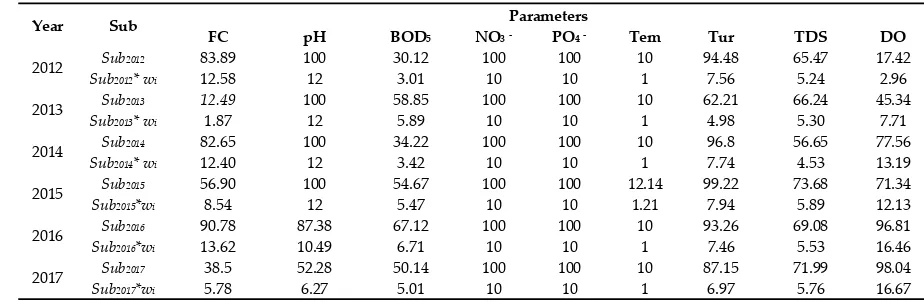
197
Table 5. Determination of ICAvalue by year.
198
Year Sub Parameters
FC pH BOD5 NO3- PO4- Tem Tur TDS DO
2012 Sub2012 83.89 100 30.12 100 100 10 94.48 65.47 17.42
Sub2012* wi 12.58 12 3.01 10 10 1 7.56 5.24 2.96
2013 Sub2013 12.49 100 58.85 100 100 10 62.21 66.24 45.34
Sub2013* wi 1.87 12 5.89 10 10 1 4.98 5.30 7.71
2014 Sub2014 82.65 100 34.22 100 100 10 96.8 56.65 77.56
Sub2014* wi 12.40 12 3.42 10 10 1 7.74 4.53 13.19
2015 Sub2015 56.90 100 54.67 100 100 12.14 99.22 73.68 71.34
Sub2015*wi 8.54 12 5.47 10 10 1.21 7.94 5.89 12.13
2016 Sub2016 90.78 87.38 67.12 100 100 10 93.26 69.08 96.81
Sub2016*wi 13.62 10.49 6.71 10 10 1 7.46 5.53 16.46
2017 Sub2017 38.5 52.28 50.14 100 100 10 87.15 71.99 98.04
Sub2017*wi 5.78 6.27 5.01 10 10 1 6.97 5.76 16.67
Table 6. Determination of WQIvalue by sampling point (SP).
199
SP FC pH BOD Parameters
5 NO3- PO4- Tem Tur TDS DO
SP1 SubSubSP1 49.97 97.44 48.50 100.00 100.00 10.00 77.31 65.79 80.02
SP1* wi 7.50 11.69 4.85 10.00 10.00 1.00 6.19 5.26 13.6
SP2 SubSP2 53.42 100.00 48.50 100.00 100.00 10.00 73.11 66.81 76.64
SubSP2* wi 8.01 12.00 4.85 10.00 10.00 1.00 5.85 5.35 13.03
SP3 SubSP3 44.26 96.43 49.48 100.00 100.00 10.00 91.49 68.46 80.46
SubSP3* wi 6.64 11.57 4.95 10.00 10.00 1.00 7.32 5.48 13.68
SP4 SubSP4 48.51 100 52.32 100.00 100.00 10.00 78.77 67.12 76.05
SubSP4*wi 7.28 12.00 5.23 10.00 10.00 1.00 6.30 5.37 12.93
Table 7. Temporal and spatial TSI of ALMD.
200
Parameters 2012 2013 2014 Temporal variation 2015 2016 2017 SP1 SP2 Spatial variation SP3 SP4
TSIChla 39.53 59.01 44.27 55.60 44.69 42.93 51.65 50.53 54.44 48.29
TSITra 47.31 66.48 51.53 45.23 58.30 55.24 54.02 52.73 52.26 53.00
TSITP 22.38 40.31 19.68 24.53 26.88 14.54 27.46 28.52 26.37 28.01
TSICARLSON 36.41 55.27 38.50 41.79 43.29 37.57 44.37 43.92 44.36 43.10
TSISPATIAL-AVERAGE 43.94
TSITEMPORAL-AVERAGE 42.14
TSIGENERAL-AVERAGE 43.04
201
The mean spatial (SP1-SP4) and temporal (2012-2017) variations of the WQINSF-BROWN classify the
202
water quality of ALMD as ¨medium¨ (WQINSF-BROWN =70) (Table 7). The superficial reservoirs that have
203
a "medium" classification for water quality present a moderate increase in the concentration of
204
pollutants [46]. In the temporal variation, fluctuations of the WQINSF-BROWN of 59-81% are observed
205
during the 6 year period of study. This significant variation is due to the significant increase in the
206
Preprints (www.preprints.org) | NOT PEER-REVIEWED | Posted: 28 December 2018
Preprints (www.preprints.org) | NOT PEER-REVIEWED | Posted: 28 December 2018 doi:10.20944/preprints201812.0335.v1
mean values of CF (2127 CFU/100 mL), Tur (22.18 NTU) and DO (5.07 mg/l). The best water quality
207
was observed in 2016, with a WQINSF-BROWN of 81 (CF = 127 CFU/100 mL, Tur = 3.34 NTU and DO =
208
9.63 mg/L) (Table 3). The presence of high warm temperatures significantly influences the decrease
209
in the score for the subi, both in the lower condition found (2013; Tem = 31.28 °C) as the highest one
210
(2016; Tem = 30.7 °C) (Table 3). From a temporal point of view, a significant variation was observed
211
in this study (2016 WQINSF-BROWN = 81; 2017 WQINSF-BROWN = 67), which is attributed to the increase in
212
the concentrations of FC (992 CFU/100 mL) and BOD5 (3.46 mg/L) (Table 3). In years 2012 (WQI
NSF-213
BROWN = 64), 2013 (WQINSF-BROWN = 59) and 2017 (WQINSF-BROWN = 67), water quality of ALMD was
214
classified as "medium", while in 2014 (WQINSF-BROWN = 74), 2015 (WQINSF-BROWN = 73) and 2016 (WQI
NSF-215
BROWN = 81), this reservoir showed a "Good" water quality (Table 7). NO3- showed a variation of
0.01-216
0.24 mg/L and PO4-of 0.01-0.04 mg/l (Table 3). The parameters with the highest value of subi during
217
the period of study were pH and Tur, with a mean value of 89.94% and 88.85%, respectively. On the
218
other hand, the lower mean percentages were attributed to Tem (10.35%), BOD5 (49.18%), FC (60.86%)
219
and TDS (67.18%) (Table 5).
220
Water quality index values (WQINSF-BROWN) ranged from 70 to 71 (Table 7) in the four sampling
221
points. A slight increase in the concentrations of FC was observed in the four sampling points (Table
222
3). The reservoir showed a homogeneous distribution of contaminants in the 4 sampling points for
223
BOD5 parameters (3.25-3.63 mg/L) and TDS (111-119 mg/L). Warm temperatures were also observed
224
in AMLD, ranging from 29.79 to 30.05 °C (Table 3). Due to the homogeneous behavior of water quality
225
parameters from a spatial point of view, the water quality was maintained as "medium" classification
226
according to Brown et al., [28]. On the other hand, due to the decrease of Tur (2.54 NTU) and TDS
227
(111 mg/L), and the increase of OD concentration (7.54 mg/L) (Table 3), the reservoir was classified
228
as "Good" in SP3 (Table 7). Turbitidy and TDS are related to the dissolved solids and particulate
229
matter. Therefore, a reduction of these parameters increases the penetration of sunlight that
230
originates the photosynthetic processes and the balance of primary productivity, improving the
231
health conditions in the oxygenation of the reservoir [47]. The reservoirs classified in the category
232
"Good" represent suitable conditions for the proper functioning of the ecosystem and the trophic
233
chain [48]. The variables with the highest score in the spatial evaluation are attributed to NO3-and
234
PO4. Values of 100% were found for the subi of each sampling point. This situation could be related
235
to the low levels of these nutrients found in AMLD.
236
In AMLD, the main pollutants distributed along the water body correspond to particulate matter
237
originated by organic material and toxic inorganics coming from natural or anthropogenic activities
238
[49]. This type of contaminants that are scattered evenly in the four sampling points and with
239
significant variations in the temporal evaluation are regulated by the diffusion-advection processes
240
[50]. In this way, the spatial and temporal analysis show that the parameters with the most significant
241
changes in the index are due to the variation of the concentration of FC, BOD5, Tur, TDS and Tem.
242
On the other hand, the parameters that showed the highest scores in the subi obtained were; NO3-and
243
PO4-, with concentrations less than 0.24 mg/L and 0.04 mg/L, respectively (Table 3).
244
3.3. Trophic State Index
245
The mean concentrations of Chla and TP, and the Tra values were used to obtain the TSICARLSON
246
(Table 8) by using the Eq. 2 – Eq. 5 [51]. According to these equations, the trophic level of ALMD is
247
"Mesotrophic" (30 < TSICARLSON < 60). Spatial (TSISPATIAL-AVERAGE = 43.94) and temporal (TSI
TEMPORAL-248
AVERAGE = 42.14) values are consistent with this classification. A spatial analysis showed that TSICARLSON
249
does not present significant variation between the four sampling points analyzed. These values
250
oscillated between 43.10 and 44.37, with a difference of 1.27%. Chla is a key biochemical component
251
in the cellular process of biomass production through the consumption of nutrients (nitrogen and
252
Preprints (www.preprints.org) | NOT PEER-REVIEWED | Posted: 28 December 2018
Preprints (www.preprints.org) | NOT PEER-REVIEWED | Posted: 28 December 2018 doi:10.20944/preprints201812.0335.v1
phosphorus) responsible for the photosynthesis process [52, 53]. The variation of Chla was from 6.07
253
to 11.3 mg/m3, with a significant increase of 46% in this concentration between samples points SP3
254
and SP4. The values of Tra varied between from 1.51 to 1.71 m (Table 3). A positive Pearson
255
correlation was observed between Chla and PO4, (Table 4). Despite the high variation of Chla, low
256
concentrations of TP (0.09 – 0.11 mg/L) and NO3-(0.04 – 0.07 mg/L) were observed (Table 3). This
257
situation limited the overproduction of biomass from the reservoir, which explains the slight
258
variation observed for the spatial Trophic Status Index: SP4 (43.10) < SP2 (43.92) < SP3 (44.36) < SP1
259
(44.37). The trophic status of AMLD at each sampling point is mainly attributed to; TSITra (53) > TSIChla
260
(51.22) > TSITP (27.59).
261
Preprints (www.preprints.org) | NOT PEER-REVIEWED | Posted: 28 December 2018
Preprints (www.preprints.org) | NOT PEER-REVIEWED | Posted: 28 December 2018 doi:10.20944/preprints201812.0335.v1
262
Table 8. Temporal and spatial evaluation of WQINSF-BROWN in ALMD.
263
Parameters Temporal variation Spatial variation
2012 2013 2014 2015 2016 2017 SP1 SP2 SP3 SP4
FC 12.58 1.87 12.40 8.54 13.62 5.78 7.50 8.01 6.64 7.28
pH 12 12 12 12 10.49 6.27 11.69 12 11.57 12
BOD5 3.01 5.89 3.42 5.47 6.71 5.01 4.85 4.85 4.95 5.23
NO3- 10 10 10 10 10 10 10 10 10 10
PO4- 10 10 10 10 10 10 10 10 10 10
Tem 1 1 1 1.21 1 1 1 1 1 1
Tur 7.56 4.98 7.74 7.94 7.46 6.97 6.19 5.85 7.32 6.3
TDS 5.24 5.3 4.53 5.89 5.53 5.76 5.26 5.35 5.48 5.37
DO 2.96 7.71 13.19 12.13 16.46 16.67 13.60 13.03 13.68 12.93
WQINSF-BROWN 64 59 74 73 81 67 70 70 71 70
WQISPATIAL-AVERAGE 70
WQITEMPORAL-AVERAGE 70
WQIGENERAL-AVERAGE 70
264
265
266
Preprints
(www.preprints.org) | NOT PEER-REVIEWED | Posted: 28 December 2018
Preprints
(www.preprints.org) | NOT PEER-REVIEWED | Posted: 28 December 2018
doi:10.20944/preprints201812.0335.v1
Peer-reviewed version available at
Environments
2019
,
6
, 7;
On the other hand, the temporal variation showed that the year with the highest incidence in
267
the index occurred in 2013 (TSICARLSON = 55.27), with a difference of 18.86% compared with the highest
268
score; 2012 (TSICARLSON = 36.41). The lowest values of TSIChla (59.01), TSITra (66.48) and TSITP (40.31)
269
were obtained in 2013, while the optimal values are attributed to 2012 (TSIChla = 39.53), 2015 (TSITra =
270
45.23) and 2017 (TSITP = 14.54). PT showed significant correlation (p < 0.05) with FC (0.5241), NO3
-271
(0.89), pH (-0.3966), PO4-(0.3395) and Tur (0.7583), while Tra was significantly correlated with PT
(-272
0.3557), FC (-0.4641), BOD5 (0.3272), NO3-(-0.3848), PO4-(0.3133) and Tur (-0.4621) (Table 4). TP is often
273
correlated with Tra and therefore, a doubling in the TP concentration is attributed to a reduction of
274
half the depth of Secchi Disk. A similar behavior is observed for Chla [34]. Thus, the increase in
275
concentrations of some pollutants related to nitrogenous and phosphorous compounds, as well as
276
biodegradable particulate matter and bacteria, increase the turbidity in the water [54]. The increase
277
of turbidity prevents biochemical processes of natural self-purification, which needs the solar light
278
[49]. The main contaminants that indirectly influence the trophic status of ALMD are due to diffuse
279
sources attributed to productive activities generated in the region as livestock (FC = 2127 CFU/100
280
mL), biodegradable and non-biodegradable particulate material product of soil erosion and
281
vegetation deforestation (BOD5 = 6.02 mg/L), as well as the use of fertilizers in agriculture (NO3-= 0.24
282
mg/L) that originate the turbidity in the water of ALMD (Tur = 22.1 NTU) (Table 3). A high positive
283
significant correlation between FC and Tur (0.826) and a medium correlation between FC and NO3-
284
were found in this study. This last correlation could be explained as following: these bacteria are
285
thermotolerant fecal coliform organisms and are responsible for performing biochemical metabolism
286
to degrade organic matter and produce the nitrogen by releasing NO3-in water [55]. The coliform
287
density in ALMD during 2012 (206 CFU/100 ml) and 2013 (2127 CFU/100 ml) increased the presence
288
of NO3- from 0.01 to 0.24 mg/L from 2012 to 2013 (Table 3).
289
3.4. Ecological Risk Index
290
The degree of pollution (Cd) of a substance is determined by calculating the pollution factor (Cif)
291
for each heavy metal analyzed (Table 9). Subsequently, the potential ecological risk factor (Eri) was
292
calculated to quantitatively express the temporal and spatial response of ALMD by means of
293
Ecological Risk Index (RI) (Table 10).
294
Table 9. Determination of ERI in ALMD.
295
Parameter Tri Degree of contamination (C d)
Temporal (2012-2017)
Spatial
(SP1-SP4) General
As 15 0.00086 0.00054 0.00140
Cd 1 0.0012 0.0008 0.0020
Cr 90 0.0001 0.00007 0.00017
Hg 0.25 0.0044 0.0030 0.0074
Pb 70 0.00012 0.00008 0.00021
296
Preprints (www.preprints.org) | NOT PEER-REVIEWED | Posted: 28 December 2018
Preprints (www.preprints.org) | NOT PEER-REVIEWED | Posted: 28 December 2018 doi:10.20944/preprints201812.0335.v1
Table 10
. Determination of
RI
in ALMD
297
Parameter
(Tri* Ci f)
Temporal variation Spatial variation
2012 2013 2014 2015 2016 2017 SP1 SP2 SP3 SP4
As 0.0009 0.0018 0.0015 0.0009 0.0009 0.0024 0.0009 0.0021 0.0009 0.0014 Cd 0.0060 0.0060 0.0060 0.0060 0.0060 0.0060 0.0060 0.0060 0.0060 0.0060 Cr 0.000007 0.00014 0.000007 0.000007 0.00002 0.000007 0.00003 0.00001 0.00004 0.00005 Hg 0.016 0.08 0.016 0.032 0.016 0.016 0.0256 0.0256 0.048 0.024 Pb 0.0001 0.0001 0.0001 0.0001 0.0001 0.0001 0.0001 0.0001 0.0001 0.0001 ∑Eri 0.0230 0.0881 0.0236 0.0390 0.0230 0.0245 0.0326 0.0338 0.0550 0.0316
RISPATIAL 0.1530
RITEMPORAL 0.2212
RIGENERAL 0.3742
298
Preprints
(www.preprints.org) | NOT PEER-REVIEWED | Posted: 28 December 2018
Preprints
(www.preprints.org) | NOT PEER-REVIEWED | Posted: 28 December 2018
doi:10.20944/preprints201812.0335.v1
Peer-reviewed version available at
Environments
2019
,
6
, 7;
Each pollution factor (Cif) was multiplied by the toxic Response (Tri) (Eq. 6 and Eq. 7) (Table 10).
299
The average of the data concentrations show that: Hg (0.00019 mg/L) < Cd (0.0002 mg/L) < Pb (0.0015
300
mg/L) < Cr (0.0017 mg/L) < As (0.0020 mg/L) (Table 3). Temporal and spatial evaluation also showed
301
that Hg was the heavy metal with the highest importance in Ecological Risk Index (Hg = 0.0044 > Cd
302
= 0.0012 > Cr = Pb = 0.0001 > As = 0.00086). Cr and Pb represent a major toxic (Tri) response between
303
the heavy metals analyzed, their concentration in ALMD was low.
304
The result of Eri shows that there is a greater potential risk factor in 2013 than the ones observed
305
in others years (2013 = 0.0881 > 2015 = 0.0390 > 2017 = 0.0245 > 2012 = 2016 = 0.0230). From a spatial
306
point of view, the SP4 site presents a slightly lower value (0.0316) followed by SP1 (0.0326) < SP2
307
(0.0338) < SP3 (0.0550). However, the ecological risk potential of each substance was found below the
308
"Low" classification (Eri < 40) in both evaluations (temporal and spatial assessment). The general
309
Ecological Risk Potential Index (RIGENERAL) of ALMD was 0.3742. The results obtained for AMLD
310
reservoir are well, and below the lower category in the classification "Low" (RI < 150). This
311
classification represents very low threat for ALMD due to pollution caused by heavy metals.
312
4. CONCLUSIONS
313
In this study, the application of ecological indexes was carried out for obtaining a diagnosis in
314
an integrated way about the water quality, trophic status and the ecological risk for heavy metals
315
pollution of ALMD, a tropical reservoir with greater agricultural importance in Mexico. This
316
assessment was carried out from a spatial and temporal point of view that can be applied in other
317
dams of the region, even in dams of other countries that present characteristics similar to those of the
318
study area. The implementation of the indexes identified the most significant parameters, based on
319
their importance for each model used. This type of applied methodologies related to multiparametric
320
integrative analysis helps as a global decision making tools unlike non-multiparameter studies, that
321
only consider a part of the components that define water quality in reservoirs. According to the
322
results, it was obtained that the ALMD reservoir presents a WQINSF-BROWN = 70, classifying the
323
water quality of the reservoir as "medium". This reservoir is affected mainly by the organic
324
biodegradable material (BOD5), diffuse fecal contamination (FC) and dissolved particulate matter
325
(TDS), which cause variations in water turbidity (Tur). Trophic state of ALMD reservoir is located in
326
the category of "Mesotrophic", with a TSIGENERAL-AVERAGE = 43.04. The parameter that most
327
affected the score of the TSI index was transparency, followed by chlorophyll-a and finally the
328
phosphorus as a limiting nutrient. Because the reservoir showed low concentrations of AS, Cd, Cr,
329
Hg, and Pb, ALMD did not present a potential ecological risk. Heavy metals concentrations found in
330
the reservoir do not represent a negative effect or endanger to the health of the reservoir and needed
331
in order to discard the ecological risk assessment in a broader manner. However, they are studies are
332
also needed on the heavy metals accumulated in the sediments to discard the ecological risk
333
assessment in a broader way. Finally, based on the results obtained in this study, it was concluded
334
that the water of ALMD is suitable for agricultural use.
335
Acknowledgements: This work was supported by CONACYT project (Cátedras CONACYT 2014 Ref. 2572).
336
Authors would like to thank CONAGUA for the collaboration.
337
REFERENCIAS
338
[1] Ashinyani, N.; Suryanarayana, T.M. Assement of groundwater quality using GWQI method – A case study
339
of Nadiad Taluka, Gujarat, India. Hydro 2015 INTERNATIONAL. 20th International Conference on
340
Hydraulics, Water Resources and River Engineering. 17-19 December 2015.
341
[2] Songyan, Y.; Zongxue, X.; Wei, Depeng, Z. Effect of land use types on stream water quality under
342
seasonalvariation and topographic characteristics in the Wei River basin, China. Ecol Indic. 2016, 60, 202–
343
212.
344
[3] Vidhya, V.; John, M.; Mario S. Does river restoration affect diurnal and seasonal changes to surface water
345
quality? A study along the Thur River, Switzerland. Sci. Total Environ. 2015, 532:91–102.
346
Preprints (www.preprints.org) | NOT PEER-REVIEWED | Posted: 28 December 2018
Preprints (www.preprints.org) | NOT PEER-REVIEWED | Posted: 28 December 2018 doi:10.20944/preprints201812.0335.v1
[4] Metcalfe, C.D.; Metcalfe, T.L.; Beddows, P.A.; Bouchot, G.G.; Li, H.; Van Lavieren, H. Contaminants in the
347
coastal karst aquifer system along the Caribbean coast of the Yucatan peninsula, Mexico. Environ Pollut.
348
2011, 159(4), 991-997.
349
[5] Grill, G.; Ouellet Dallaire, C.; Fluet Chouinard, E.; Sindorf, N.; Lehner, B. Development of new indicators to
350
evaluate river fragmentation and flow regulation at large scales: A case study for the Mekong river basin.
351
Ecol Indic. 2014, 45, 148-159.
352
[6] Dimas, A.; Hinojosa, A.; Oller, P. Prefacio. Boletín de la Sociedad Geológica Mexicana, abril, 2011, 63, i-ii.
353
[7] Cuthbertson, A.; Newkirk, C.; Llardo, J.; Loveridge, S.; Skidmore, M. Angry, Scared, and Unsure: Mental
354
Health Consequences of Contaminated Water in Flint. J. Urban Health. 2016, 93, 6.
355
[8] Guillén, V.; Teck, H.; Kohlmann, B.; Yeomans, J. Microorganismos como bioindicadores de la Calidad del
356
Agua. Tierra tropical: sostenibilidad, ambiente y sociedad, 2012, 8, 1, 65-93.
357
[9] Wu, Z.; Zhang, D.; Cai, Y.; Wang, X.; Zhang, L.; Chen, Y. Water quality assessment based on the water quality
358
index method in Lake Poyang: The largest freshwater lake in China. Scientific Reports. 2017, 7, 1-10.
359
[10] Sharma, S.; Chhipa, R. Evaluation and Optimization of Water Quality Index for Ground Water Sourse of
360
North West Jaipur and Agglomerates. Int. J. chem. sci. 2012, 10, 2297- 2305.
361
[11] Li, W.; Gao, L.; Shi, Y.; Wang, Y.; Liu, J.; Cai, Y. Spatial distribution, temporal variation and risks of
362
parabens and their chlorinated derivatives in urban surface water in Beijing, China. Sci. Total Environ.
363
2016, 01, 539.
364
[12] Misaghi, F.; Delgosha, F.; Razzaghmanesh, M.; Myers, B. Introducing a water quality index for assessing
365
water for irrigation purposes: A case study of the ghezel ozan river. Sci. Total Environ. 2017, 589, 107-116.
366
[13] Bhadra, A.K.; Sahu, B.; Rout, S.P. Evaluation of the water quality index in river brahmani, odisha in the light
367
of national sanitation foundation (NSF) standards. Asian J. Res. Chem. 2014, 7(6), 586-592.
368
[14] Simões, F.; Moreira, A.B.; Bisinoti, M.C.; Gimenez, S.M.; Yabe, M.J. Water quality index as a simple indicator
369
of aquaculture effects on aquatic bodies. Ecol Indic. 2008, 8, 476-484.
370
[15] Behar, R.; Zúñiga de Cardozo, M.; Rojas, O. Análisis y Valoración del Índice de Calidad de Agua (ICA) de
371
la NSF: Caso Ríos Cali y Meléndez. Ingeniería y Competitividad. 1997,1, 1, 17-27.
372
[16] Liu, W.; Zhao, E.; Kuo, Y.; Jang, C. Identifying the relationships between trophic states and their driving
373
factors in the Shihmen reservoir, Taiwan. Limnologica. 2017, 64, 38-45.
374
[17] De Freitas, P.; Reis Sousa, M.; Porfírio, A.F.; Almeida, B.S.; Furtado, R.; Santaella, S. T. Preliminary analysis
375
on the use of trophic state indexes in a brazilian semiarid reservoir. Biol. Sci. 2015, 37, 309-318.
376
[18] Cañedo-Argüelles, M.; Rieradevall, M.; Farrés-Corell, R.; Newton, A. Annual characterisation of four
377
mediterranean coastal lagoons subjected to intense human activity. Estuar. Coast. Shelf Sci. 2012, 114,
59-378
69.
379
[19] Håkanson, L. An ecological risk index for aquatic pollution control. A sedimentological approach. Water
380
Res. 1979, 14, 975–1001.
381
[20] Wang, N.; Wang, A.; Kong, L.; He, M. Calculation and application of sb toxicity coefficient for potential
382
ecological risk assessment. Sci. Total Environ. 2018, 610-611, 167-174.
383
[21] Zhang, W.; Jin, X.; Liu, D.; Lang, C.; Shan, B. Temporal and spatial variation of nitrogen and phosphorus
384
and eutrophication assessment for a typical arid river - Fuyang river in northern china. J. Environ. Sci. 2017,
385
55, 41-48.
386
[22] Zhang, Y.; Yongqiang, Z.; Kun, S.; Qin, B.; Yao, X.; Zhang, Y. Optical properties and composition changes in
387
chromophoric dissolved organic matter along trophic gradients: Implications for monitoring and assessing
388
lake eutrophication. Water Res. 2018,131, 255-263.
389
[23] Yongxia, L.; Qian, W.; Zhuang, Y.; Yuan, Y.; Yuana, K.; Mantang, W.; Qing, C. Calculation of Thallium's
390
toxicity coefficient in the potential ecological risk index: A case study. Chemosphere. 2018, 194, 562-569.
391
[24] Zhang, L.; Liu, J. Relationships between ecological risk indices for metals and benthic communities metrics
392
in a macrophyte-dominated lake. Ecol Indic. 2014, 40, 162-174.
393
[25] Comisión Nacional del Agua (CONAGUA). Estadísticas del agua en México. Secretaria de Medio Ambiente
394
y Recursos Naturales (SEMARNAT), México. 2016.
395
[26] CONABIO. Cuenca Alta de los Ríos Culiacán y Humaya. Obtained from:
396
http://www.conabio.gob.mx/conocimiento/regionalizacion/doctos/rhp_020.html (Accessed 15 march
397
2017).
398
[27] APHA. Standard Methods for the Examination of Water and Wastewater. Washington DC:1992.
399
Preprints (www.preprints.org) | NOT PEER-REVIEWED | Posted: 28 December 2018
Preprints (www.preprints.org) | NOT PEER-REVIEWED | Posted: 28 December 2018 doi:10.20944/preprints201812.0335.v1
[28] Brown, R.M.; Mcclelland, N.; Deininger, R.A.; Tozer, R. A Water Quality Index - Do We Dare, Proceedings
400
of the National Symposium on Data and Instrumentation for Water Quality Management, Conference of
401
State Sanitary Engineers and Wisconsin University. Madison, WIS, 1970, 364-383.
402
[29] Khan, F.A.; Ansari, A. Eutrophication: an ecological vision. Bot. Rev. 2005, 71, 449-482.
403
[30] López, M.; Madroñero, S. Estado trófico de un lago tropical de alta montaña: caso laguna de La Cocha.
404
Ciencia e Ingeniería Neogranadina. 2015, 25, 21-42.
405
[31] Wurzburger, N.; Wright, S. J. Fine-root responses to fertilization reveal multiple nutrient limitation in a
406
lowland tropical forest. Ecology. 2015, 96, 2137-2146.
407
[32] Maavara, T.; Parsons, C. T.; Ridenour, C.; Stojanovic, S.; Dürr, H.H.; Powley, H.R.; Cappellen, P.V. Global
408
phosphorus retention by river damming. Proceedings of the National Academy of Sciences of the United
409
States of America. 2015, 112, 15603-15608.
410
[33] Munyati, C. A spatial analysis of eutrophication in dam reservoir water on the Molopo river at Mafikeng,
411
south Africa. Sustainability of Water Quality and Ecology. 2015, 6, 31-39.
412
[34] Carlson, R.E. A trophic state index for lakes. Limnol. Oceanogr. 1974, 23, 361-369.
413
[35] Akin, B.S.; Kırmızıgül, O. Heavy metal contamination in surface sediments of Gökçekaya dam lake,
414
Eskişehir, Turkey. Environ Earth Sci. 2017, 76, 402.
415
[36] López, E.; Barceló, I.; Solís, H.; Laure, A.; Avila, P.; Martínez-Delgadillo, S. Calculation of the Ecological Risk
416
Index in the José Antonio Alzate Dam, State of Mexico, Mexico. Biol. Trace Elem. Res. 2009, 135, 121–135.
417
[37] Kutlu, B. Dissemination of heavy-metal contamination in surface sediments of the uzunçayır dam lake,
418
tunceli, Turkey. Hum. Ecol. Risk Assess. 2018, 24, 2182-2194.
419
[38] Kükrer, S.; Erginal, A. E.; Şeker, S.; Karabıyıkoğlu, M. Distribution and environmental risk evaluation of
420
heavy metal in core sediments from lake çıldır (NE turkey). Environ. Monit. Assess. 2015, 187, 1-14.
421
[39] USEPA. United States Environmental Protection Agency Understanding variation in partitioncoefficient,
422
Kd, values. Volume I: The Kd model, methods of measurement, and application of chemical reaction codes.
423
EPA, Washington, DCCampbell PGC, Lewis AG. 1999.
424
[40] Liu, Y.; Wang, Q.; Zhuang, W.; Yuan, Y.; Jiao, K.; Wang, M.; Chen, Q. Calculation of Thallium's toxicity
425
coefficient in the potential ecological risk index: A case study. Chemosphere. 2018, 194, 562-569.
426
[41] Mahato, M.K.; Singh, G.; Singh, P.K.; Singh, A.K.; Tiwari, A.K. Assessment of mine water quality using
427
heavy metal pollution index in a coal mining area of Damodar river basin, India. Bull. Environ. Contam.
428
Toxicol. 2017, 99, 54-61.
429
[42] Akköz, C. The determination of some pollution parameters, water quality and heavy metal concentrations
430
of Aci lake (Karapinar/Konya, turkey). Transylv. Rev. Syst. Ecol. Res. 2017, 19, 1-18.
431
[43] Wu, Z.; Wang, X.; Chen, Y.; Cai, Y.; Deng, J. Assessing river water quality using water quality index in lake
432
taihu basin, china. Sci. Total Environ. 2018, 612, 914-922.
433
[44] Liu, Y.; Wang, M.; Wang, Q.; Zhuang, W.; Yuan, Y.; Yuan, Y.; Chen, Q. Calculation of thallium's toxicity
434
coefficient in the evaluation of potential ecological risk index: A case study. Chemosphere. 2018, 194,
562-435
569.
436
[45] Dereli, H.; Dinçtürk, E. Population structure and some growth properties of Gibel carp (Carassius Gibelio)
437
in a mesotrophic lake. Not. Sci. Biol. 2016, 8, 286-291.
438
[46] Ewaid, S.H.; Abed, S.A. Water Quality Index for Al-Gharraf River, Southern Iraq. Egypt. J. Aquat. Res. 2017,
439
43, 117-122.
440
[47] Jazzar, S.; Berrejeb, N.; Messaoud, C.; Marzouki, M.N.; Smaali, I. Growth parameters, photosynthetic
441
performance, and biochemical characterization of newly isolated green microalgae in response to culture
442
condition variations. Appl. Biochem. Biotechnol. 2016, 179, 1290-1308.
443
[48] Carbajal-Hernández, J.J.; Sánchez-Fernández, L.P.; Villa-Vargas, L.A.; Carrasco-Ochoa, J.A.;
Martínez-444
Trinidad, J.F. Water quality assessment in shrimp culture using an analytical hierarchical process. Ecol
445
Indic. 2013, 29, 148-158.
446
[49] Chapman, D. Water Quality Assessments. A Guide to the Use of Biota, Sediments and Water in
447
Environmental Monitoring. Chapman and Hall, 2nd ed. London. 1996.
448
[50] Thongtha, K.; Kasemsuwan, J. Numerical simulations of water quality measurement model in an
opened-449
closed reservoir with contaminant removal mechanism. Int. J. Differ. Equ. 2018, 1-12.
450
[51] Moreno, A.; Ramírez, J.J. Variación temporal de la condición trófica del lago Parque Norte, Medellín
451
(Antioquia), Colombia. Actualidades Biológicas, 2010, 32, 75-87.
452
Preprints (www.preprints.org) | NOT PEER-REVIEWED | Posted: 28 December 2018
Preprints (www.preprints.org) | NOT PEER-REVIEWED | Posted: 28 December 2018 doi:10.20944/preprints201812.0335.v1
[52] Santos, S.A.; dos Santos, T.R.; Furtado, M.S.; Henry, R.; Ferragut, C. Periphyton nutrient content, biomass
453
and algal community on artificial substrate: Response to experimental nutrient enrichment and the effect
454
of its interruption in a tropical reservoir. Limnology, 2018, 19, 209-218.
455
[53] Reimers, J.R.; Cai, Z.; Kobayashi, R.; Rätsep, M.; Freiberg, A.; Krausz, E. Formation of water-chlorophyll
456
clusters in dilute samples of chlorophyll-a in ether at low temperature. Physical Chemistry Chemical
457
Physics: PCCP. 2014, 16, 2323-2330.
458
[54] Bachmann, R.W.; Hoyer, M.V.; Croteau, A.C.; Canfield Jr, D.E. Factors related to secchi depths and their
459
stability over time as determined from a probability sample of US lakes. Environ. Monit. Assess. 2017, 189,
460
1-17.
461
[55] Rodriguez, S.; Gauna, L.; Martinez, G.; Acevedo, H.; Romero, C. Nitrate and Bacterial Contamination in
462
Water. Tierra latinoamericana. 2012, 30, 111-11.
463
Preprints (www.preprints.org) | NOT PEER-REVIEWED | Posted: 28 December 2018
Preprints (www.preprints.org) | NOT PEER-REVIEWED | Posted: 28 December 2018 doi:10.20944/preprints201812.0335.v1