SCAN: A Smart Application Platform for Empowering Parallelizations of Big
Genomic Data Analysis in Clouds
Wei Xing
Cancer Research UK Manchester Institute University of Manchester, Manchester, United Kingdom
email: [email protected]
Wei Jie
School of Computing and Technology
University of West London, London, United Kingdom email: [email protected]
Crispin Miller
Cancer Research Manchester Institute
University of Manchester, Manchester, United Kingdom email: [email protected]
Abstract—Cloud computing is often adopted to process big data for genome analysis due to its elasticity and pay-as-you-go features. In this paper, we present SCAN, a smart application platform to facilitate parallelization of big genome analysis in clouds. With a knowledge base and an intelligent application scheduler, the SCAN enables better understanding of bio-applications’ characteristics, and helps to orchestrate huge, heterogeneous tasks efficiently and cost-effectively. We conducted a simulation study and found that the SCAN platform is able to improve the performance of genome analysis and reduce its cost in a wide variety of circumstances.
Keywords-genome analysis; application platform; cloud com-puting; parallelization
I. INTRODUCTION
Cancer is a disease of the genome. Systematic studies of the cancer genome can provide us with a global view of the molecular architecture of complex traits, which is useful for the identification of genes, pathways, and cell signal networks that may dictate tumour clinical behaviour and treatment response [1]–[3]. Because cancer cells have a large variety of relatively rare mutations, a computational chal-lenge arises to process hundreds of millions of short DNA sequences (corresponding to billions of DNA nucleotides) in a cost-effective way.
Today cloud computing is often employed to provide huge computational resources for the needs of genome analysis on an on-demand basis. Genome analysis normally encom-passes a chain of various biological applications, which may engage thousands of analytic tasks with hundreds of thousands of copies of heterogeneous data in different sizes derived from geographically diverse sources. Though current cloud computing systems are able to adapt to workload changes by provisioning required resources automatically, there is still plenty of room to improve the performance and reduce the total cost for processing big genomic data.
There are two major issues with cloud-based big ge-nomic data analysis. Firstly, most genome analytic processes
are currently executed sequentially in clouds when there are huge opportunities for application parallelization. This opportunity is missed because we lack a smart scheduler that can “understand” the genomic applications and identify opportunities for concurrency. Secondly, very often analysis processes spend large proportions of their running time on blocked I/O due to the volume of data that must be fetched or retrieved, both to/from the analysis user and to/from intermediate storage used to communicate between analysis processes.
To address the above issues, We need a smart scheduling mechanism to orchestrate the huge number of analysis processes and make them execute effectively in clouds. For example, it could assign analysis tasks with their required computing resources in a “just enough and just on time” manner, so that the utilisation of cloud computing resources can be optimised. we also need an intelligent mechanism that can supply data when required with the progress of analysis execution. For example, it could upload required genome reference files just before they are needed to avoid a long waiting time, or fragment large sequencing datasets into suitable small pieces to enable parallel execution and thus speed up the whole process.
Other genomic data processing share the same kernel of the SCAN platform.
The SCAN platform has two key components. The first component distributes large amounts of biological data required by analysis processes in an intelligent manner. This is informed by an application knowledge base which includes information about various bio-applications and their characteristics, such as input data format, parameter settings, performance suggestions, etc. By querying the knowledge-base, the SCAN can determine, for example, the most suitable file size for each type of genomic data analysis based on the resource cost and performance requirements. It can then suggest to subdivide a big input data file into some number of small input files for parallel processing. The second key component of the SCAN platform applies smart algorithms to determine what cloud resources to hire, and how to distribute resources between different analysis jobs, aiming to execute analysis tasks in the cloud as efficiently as possible.
In this paper, we present the design and development of the SCAN platform. We also describe a reward-based job scheduling mechanism to orchestrate large numbers of heterogeneous genome analysis tasks. Finally, the benefits of the SCAN platform is demonstrated through a simula-tion study. The evaluasimula-tion results indicate that the SCAN platform can improve overall genomic data analysis perfor-mance and can significantly reduce the attendant cost. The contributions of this work are:
1) A smart application platform is developed to facilitate big genomic data processing in clouds.
2) A knowledge-based data distribution mechanism is im-plemented to parallelize big genomic data processing. 3) A scheduling algorithm is designed to better support resource elasticity of genome analysis in cloud envi-ronments.
4) Simulation experiments are conducted to examine the benefits of running the GATK application using the SCAN platform.
The remainder of this paper is structured as follows: in Section II we describe the design and development of the SCAN platform architecture and its key components, and provide detailed information on SCAN’s smart algorithms. In Section III-B the prototype implementation is discussed. In Section IV we study SCAN’s performance in a simulated cloud. In Section V related work is discussed before the conclusion of the paper in Section VI.
II. DESIGN
Genome analysis normally involves a number of differ-ent analysis applications, which may incorporate multiple levels of biological information such as phenotype, geno-type, expression profiles, proteomics, protein interaction, metabolic analysis and physiological measurements, etc. The main challenge addressed in the design of the SCAN is
that different stages of a particular analysis pipeline may require substantially different amounts and types of input data and computing resources. For example, mapping of deep sequencing data to genome annotation via a relational database such as ENSEMBL relies on the ability to perform frequent joins across multiple tables containing millions of rows, while computation of downstream statistics is often dependent on repeated numerical calculations over permuted data in order to provide a null distribution [4]. The SCAN provides the required data and cloud computing resources smartly in order to improve the performance and reduce the cost of genome analysis.
A. Basic Requirements
In this section, we analyse basic requirements of the design of the SCAN platform as follows:
1) Catering to diverse application requirements: SCAN manages various bio-applications, each with different computing resource requirements, and each dealing with different kinds of data. For example, a sequence aligner may process sequence data in FASTQ format and may need many CPUs, whilst the GATK handles aligned sequence data in BAM files and may need a large amount of main memory [5], [6].
2) Allowing parallel and concurrent control: Different ap-plications also support different degrees and modes of parallelism (for example, local multithreading, coarse-grained multi-process sharding and fine-coarse-grained dis-tributed computing). Therefore it is important that SCAN can compare the benefits of and coordinate these different modes, including communicating with the underlying cloud infrastructure to commission appropriate resources.
3) Staging of data files: the SCAN has to process various data files of different sizes. It is essential to provide a method of manipulating or fetching the required data for each application process. For example, for optimal performance, the GATK analysis should operate on a 2GB BAM file; however, whole genome sequencing data normally runs to over 100GB, which must there-fore be sharded.
4) Maintaining a knowledge base: the SCAN needs to assemble information about cost and performance of different bio-applications within different cloud infras-tructures in order to form an optimal execution plan.
B. SCAN Data Flow
Gene alignment Gene variation detection
Cellprofiler
MaxQuant
Cy
to
sc
ap
e
NGS Data Analysis
Cell Image Data Analysis
Protein Data Analysis
In
te
g
ra
tiv
e n
et
w
o
rk
D
at
a A
n
aly
sis
Illumina Hiseq 2500
Mass Spectrometry Microscopy
Genotype2phenotype
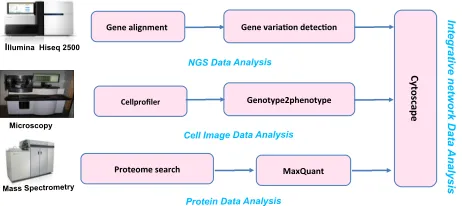
Figure 1. SCAN Data Flow Digram.
properties of these networks underlie virtually all aspects of cell function and can, for example, predict disease outcome and responses to treatment.
The SCAN is thus designed to analyse either exome data or Whole Genome Sequencing (WGS) data from the Illumina HiSeq platform referring to some public genomic or proteomic data. It may also analyse proteomic data and high throughput imaging data together with the genomic data [7]. Figure 1 shows the SCAN data flow digram and the applications in details. We design the SCAN to work with standard formats to enable interoperability with other tools. For example, the read mapping produces sorted SAM output and the variant caller takes sorted SAM input, and generates a standard VCF file.
C. SCAN Ontology and Genomic Application Knowledge
Having information about applications is critical for effi-ciently planning genome analysis. This information is used for application data preparation, parameter setting, workflow orchestration and cloud resource allocation. In order to organise information to help the SCAN to “understand” various biological and clinical applications, we define a semantic model to represent heterogeneous information in a meaningful way.
The SCAN semantic model is composed of a domain ontology (DO), a cloud ontology (CO) and the SCANlinker. The definition in BNF syntax is as follows:
Active Ontology ::=
’Ontology(’ [ domain ] ’)’ | ’Ontology(’[cloud ]’)’ | ’SCAN(’{linker}’)’
Those ontologies provide an expressive information model to describe genome analysis and the cloud domain. They enable information to be logically self-organised and automatically processed.
D. SCAN Reward Algorithm
We designed reward functions to motivate SCAN’s scheduling decisions. We assume that a large number of independent users are submitting analysis pipeline requests to a cloud, and that they all offer reward on the same
terms (i.e. there are no users with more urgent work than others willing to offer a premium for fast execution). We use either thetime-orientedreward scheme and the throughput-oriented scheme. Any cloud manager can select a suitable scheme for allocating resources based on user’s policy.
• Time-oriented Reward: Under the time-oriented reward scheme, users offer a reward proportional to input data size for completion of their whole analysis pipeline, with a constant penalty per unit time the work is delayed. Thus the reward R given for finishing an analysis with input data sizedin total timet is related by constantsRmax andRpenalty:
R(d, t) =d(Rmax−tRpenalty)
This scheme represents the case where the primary undesirable factor is the time wasted by users waiting for analysis pipelines to complete: they are paid pro-portional to time, and so the penalty for delaying work is similarly a linear function of time.
• Throughput-oriented Reward: Under the throughput-oriented reward scheme, users offer a reward propor-tional to therate at which analysis requests are com-pleted, and thus inversely proportional to the duration of the complete pipeline execution. It can be given in terms of input data sizedand analysis time tin terms of a scaling factorRscale:
R(d, t) = dRscale
t
This scheme represents the case where the user is more concerned with relative speedup than with the total time consumed for a particular run: whilst the time-oriented scheme values any minute it can save equally, the throughput-oriented scheme rewards according to theproportionof runtime that was eliminated.
III. THEDEVELOPMENT OFSCAN
Data Broker Scheduler Workers
data type worker
/input/fasta/s1.fa 11 2,4,g1 /input/fasta/s2.fa 12 8,8,g3 /input/fasta/s3.fa 13 12,8,b1 /input/protein/m1.mgf 11 16,8,m1
….
Genome GATK
SCAN Platform
SCAN Platform
Genome MuTect
<!-- http://www.semanticweb.org/wxing/ontologies/ scan-ontology#GATK1 -->
<owl:NamedIndividual rdf:about="&scan-ontology;GATK1">
<scan-ontology:performance>good </scan-ontology:performance> <scan-ontology:inputFileSize>10 </scan-ontology:inputFileSize> <scan-ontology:steps>1</scan-ontology:steps>
<scan-ontology:eTime>180</scan-ontology:eTime>
</owl:NamedIndividual>
Genome GATK
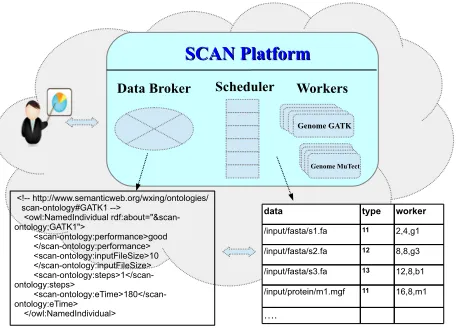
Figure 2. Overview of SCAN Architecture.
A. SCAN Architecture
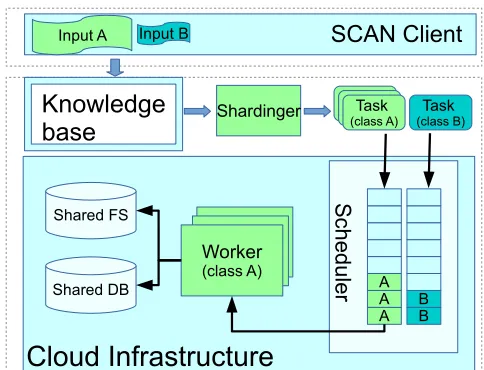
Considering all the requirements presented in Section II-A, we present the SCAN as a smart application platform (shown in Figure 2). It comprises three key components: a) Data Broker, b) SCAN Scheduler, and c) SCAN Workers. The Data Broker splits and distributes large datasets for various applications, so that the SCAN is able to run subtasks in parallel. The SCAN Scheduler maintains analytic task queues and pools of SCAN workers that may be used to execute those tasks or subtasks. Tasks are scheduled by a ”reward” algorithm with the aim to maximise profit (the difference between resource costs and user reward for work completion). The SCAN Workers are varied in terms of their application software stack (for example, operating systems and installed applications available) and their hardware con-figuration (for example, the number of (virtual) CPU cores they are assigned or the amount of physical memory they are permitted to use). In the following, we will discuss these three components in more detail.
1) Data Broker: The Data Broker is designed to fragment or merge large sets of input data for massive analytic tasks so that the SCAN can parallelize genome analysis. The SCAN can intelligently fragment the input data of each step of analysis workflows based on the information provided in a knowledge-base. For example, it can divide a large input file into many small input files so that a big data process can be executed by several parallel analysis processes, choosing the degree of parallelism based on a user cost policy.
The data broker has two key components: an application knowledge base to guide data preparation of each task, and data sharders to fragment various genomics data into suitable chunks. The knowledge-base is built by using semantic web technology, i.e., ontology and the instances. There are three key functions of the data broker are described as follows:
(i) The Creation of SCAN Knowledge-base: We have cre-ated an OWL (Web Ontology Language) ontology that de-scribes biological data and its associated bio-applications,
re-sources, capabilities and the relationships among them [12], [13]. The ontology is based on the Gene Ontology (GO) described in [14] and extends the GO to include de-scriptions about biological data types and formats, bio-applications, cloud middleware services, computing and storage resources, networks, and usage policies. Besides the ontology, we add various instances of tasks of omics data analysis, including genome analysis, proteome analysis, imaging analysis, and integrative analysis running in a cloud. For example, the instances of genome analysis include workflows like data variation detection analysis and miRNA fusion detection workflows.
The knowledge-base is initially created by profiling some of the most common genome applications. In this case, there is no profiling information. We can just use history information about a particular application as the start point, then SCAN knowledge-base can update its knowledge ac-cordingly. After that, the knowledge base will be expanded by using information from logs of each task running on the SCAN platform. For example, we profiled GATK per-formance under different hardware configurations and with different inputs [15]. The datasets include genome inputs of different sizes, ranging from 1GByte to 9GBytes. We can then conclude that total execution time linearly increases with the input file size and that different GATK analysis tools scale differently with thread count, generating differ-ent parallelism recommendations depending on the reward offered by the user. Based on these profiling results, we can express the GATK input datasets in the SAN ontology in RDF/OWL format as follows:
...
<owl:NamedIndividual rdf:about="&scan-ontology;GATK1"> <rdf:type rdf:resource="&scan-ontology;Application"/>
<scan-ontology:inputFileSize>10 </scan-ontology:inputFileSize>
<scan-ontology:steps>1</scan-ontology:steps> <scan-ontology:RAM>4</scan-ontology:RAM> <scan-ontology:eTime>180</scan-ontology:eTime> <scan-ontology:CPU>8</scan-ontology:CPU> </owl:NamedIndividual>
...
In order to enrich the knowledge base, The SCAN keeps the log information of each task scheduled to run in a cloud. The log information will be used to further populate the SCAN knowledge-base. We show below an example of the knowledge-base expansion when some GATK tasks are run under the SCAN:
...
<!-- http://www.semanticweb.org/wxing/ontologies /scan-ontology#GATK1 -->
<owl:NamedIndividual rdf:about="&scan-ontology;GATK1"> <rdf:type rdf:resource="&scan-ontology;Application"/>
<scan-ontology:inputFileSize>10 </scan-ontology:inputFileSize>
<!-- http://www.semanticweb.org/wxing/ontologies /scan-ontology#GATK2 -->
<owl:NamedIndividual rdf:about="&scan-ontology;GATK2"> <rdf:type rdf:resource="&scan-ontology;Application"/>
<scan-ontology:CPU>8</scan-ontology:CPU> <scan-ontology:steps>1</scan-ontology:steps> <scan-ontology:RAM>4</scan-ontology:RAM> <scan-ontology:eTime>200</scan-ontology:eTime> <scan-ontology:inputFileSize>5
</scan-ontology:inputFileSize> </owl:NamedIndividual>
<!-- http://www.semanticweb.org/wxing/ontologies /scan-ontology#GATK3 -->
<owl:NamedIndividual rdf:about="&scan-ontology;GATK3"> <rdf:type rdf:resource="&scan-ontology;Application"/>
<scan-ontology:steps>1</scan-ontology:steps> <scan-ontology:CPU>8</scan-ontology:CPU> <scan-ontology:eTime>280</scan-ontology:eTime> <scan-ontology:RAM>4</scan-ontology:RAM> <scan-ontology:inputFileSize>20
</scan-ontology:inputFileSize> </owl:NamedIndividual>
<!-- http://www.semanticweb.org/wxing/ontologies /scan-ontology#GATK4 -->
<owl:NamedIndividual rdf:about="&scan-ontology;GATK4"> <rdf:type rdf:resource="&scan-ontology;Application"/>
<scan-ontology:eTime>80</scan-ontology:eTime> <scan-ontology:steps>1</scan-ontology:steps> <scan-ontology:CPU>8</scan-ontology:CPU> <scan-ontology:inputFileSize>4
</scan-ontology:inputFileSize>
<scan-ontology:RAM>4</scan-ontology:RAM> </owl:NamedIndividual>
</rdf:RDF>
(ii) Querying the SCAN Knowledge-base for Sharding Data: The Data Broker will query the SCAN knowledge-base to decide the suitable chunk size of input files of tasks whenever there is a new GATK task in the SCAN platform. It then will call Data Sharders to chunk (different types of) genomic data into pieces accordingly and submit those tasks to the Scheduler.
In general, the SCAN will be smarter to suggest the com-bination of the most suitable input data size and available cloud computing resources when more log information has been collected from previous tasks executed on the platform. The decision is based on a set of workflow execution con-ditions, including the actual information needed (specified as a SPARQL query), and other aspects like the availability of the source [16]. For example, in our prototype we have defined the class AlignedGenomicData that represents inputs to the GATK pipeline. This class has a propertyCPU
that isrequiredByGATK workflows.
Since in our ontology we have defined over 10 differ-ent genome analysis workflows (as instances of the class
GenomeAnalysis), the Data Broker sends a query to select the most suitable one for deciding the size of a input file. The query is done in SPARQL, and retrieves the suggested values of those instances of GATK, along with itsCPU andRAMresource attributes. Below is a SPARQL
SCAN Client
S
ch
ed
ule
r
A A A
B B Worker
(class A) Shared FS
Shared DB
Knowledge
base
Task
(class B)
Task
(class A)(class A)Task Task (class A)
Input B Input A
Cloud Infrastructure
Shardinger
Figure 3. The Key Components and the Implementation.
query for the GATK instances in the SCAN knowledge-base:
PREFIX SCAN: <http://www.semanticweb.org/wxing/ontologies /scan-ontology#GATK>
FROM <scan-wxing.owl> SELECT ?InputData
WHERE { ?s SCAN:inputFileSize "sharding"? . OPTIONAL { ?x:resourceRequired "clouds" .
?y SCAN:computingResource ‘‘CPU" . ?z onG:computingResource ‘‘RAM’’ . }
The selected GATK instances are ranked according to the values of their execution time and the size of input files.
(iii) Sharding Input Data for Genomic Tasks in a Cloud: Genome data size for a particular analysis varies widely. The SCAN is equipped with Data Sharders for each type of genomic data, such as FASTQ and BAM files. They can, for example, divide a 100GB FASTQ file into 25 4GB files, and create 25 data analysis subtasks. On the other hand, the SCAN can merge many small input files into one big file, for example, for the GATK task called VariantsToVCF. The SCAN knowledge-base will advise the appropriate shard size.
To make decisions, the SCAN implements acost function, which maps the number of machines currently active and their configuration to the cost per unit time of keeping them running, and areward function, which maps task latency and task size onto a reward measured in the same units (latency measures the time from a task entering the queue for the first analysis stage to completing the last stage). The task’s size is a format-specific concept, but generally reflects the number of records of input data supplied.
The cost function consists of tiers, representing a class of resources that can be hired at a given price. For example, if the deployment belonged to an academic institution, they might describe their institution’s private cloud as a tier of resources at negligible cost, their University’s private cloud as a tier with higher cost with availability bounded by the available physical decisions are taken.
The reward function may express concepts such as a deadline, where reward falls to zero as the results are useless thereafter, and bonuses for rapid completion, where reward slopes upwards before plateauing when execution is fast enough that the customer is not willing to pay for more.
Denoting the reward function R(latency,records), and the number of records in jobj asrecsj, we can then define
thedelay cost DCof delaying queueQbydelaytime units:
DC(delay) =X
j∈Q
R(ETT(j),
recsj)−R(ETT(j) +delay,recsj)
(1)
ETT(j) gives the Estimated Total Time for the job j
to run, given its progress so far and the occupancy of this queue and those of future pipeline stages. This is the sum of time already passed since the job started and the estimated queueing and execution times for future pipeline stages.
We estimate execution time for pipeline stage i, denoted EETi, using a linear function of the number of job input
records derived from profiling data. We also estimate the time we expect a general job to spend in the queue for stage
i,EQTi. Writing the jobj’s current stageSj, we have:
ETT(j) =elapsedj+X i=Sj
(EQTi+EETi(j)) (2)
3) SCAN Workers: SCAN Workers are responsible for ex-ecuting tasks as instructed by the scheduler. The workers are very simple entities: they are assigned SCAN tasks, which they run until completion, and provide feedback concerning their resource utilization to the scheduler. Each worker has a software stack suitable for a particular application and a certain hardware configuration. SCAN Workers can host most genomic applications by using cloud virtualisation technology. Currently we have implemented GATK, BWA, and Maxquant workers for the SCAN platform.
B. SCAN Prototype Implementation
The current SCAN implementation realises the design using the SCAN knowledge-base; a custom-built scheduler; and existing Linux and Windows services for the workers, CIFS for the shared filesystem and Apache Cassandra for the database. The SCAN knowledge-base is built using an OWL/RDF ontology and its instance store; SPARQL is used to query the store. The scheduler is implemented in Python, using the CherryPy web framework to process HTTP requests. Its interface is realized using HTTP RPCs. It maintains an in-memory pool of available workers and a FIFO queue of pending tasks per class. Workers do not need any custom SCAN software to provide their required interface. They accept tasks using existing remote control mechanisms, such as ssh.
Within the EU FP7 CELAR project [17], the SCAN has been implemented in conjunction with CELAR cloud middleware development [18]. The CELAR cloud is a fully automated and highly customisable system for elastic provi-sioning of resources in cloud computing platforms. It aims at providing an elasticity layer for applications that need to be able to take advantage of the elastic, pay-as-you-go resource provisioning nature of cloud infrastructures in a transparent and customizable manner. The SCAN interacts with two key cloud components of the CELAR, which are the CELAR Manager and the CELAR Decision Module. The CELAR Manager is a cloud component to orchestrate and execute the deployment of the applications in the cloud, and the Decision Module takes automated control measures, based on application behaviour and the user-defined requirements. By employing CELAR middleware components, such as the CELAR cloud manager and the decision making module, the SCAN can query the analysis performance characteristics and issue scaling commands to the underlying cloud infras-tructure. However, the SCAN can function independent of the CELAR. General speaking, the SCAN can work with any kind of cloud platforms and various cluster systems.
IV. EVALUATION
1) GATK Application: A typical genomic data process is to determine whether a DNA sample taken from a patient exhibits genetic mutations known to cause cancer, and if it does, which specific variety of the disease. We employ the GATK application which is typically used to build a pipeline consisting of multiple stages. The first stage consumes the user’s input data, whilst every other stage depends on the full output of its predecessor. We consider a particular 7-stage pipeline that is commonly used to diagnose genetic mutations in input data compared to a known reference genome: the user submits aligned DNA or RNA reads, typically in Binary Aligned Map (BAM) format, and at the end of the pipeline receives a list of suspected mutations compared to the reference genome.
Many of the GATK tools used in this pipeline require a great deal of I/O bandwidth, but they are ultimately compute- or memory-bound rather than I/O-bound. A ge-nomic sequence file can varied in size, from 100MB to 500GB, which will greatly affect the needs of computing and memory resources. The SCAN makes the inputs of GATK steps according to the suggestions from the knowledge base. In our case, the inputs will be 2GB for each task. Most (but not all) GATK tools can be accelerated by local multi-threading: ordinarily this is manually controlled by the user, but in this paper it will be controlled by our resource alloca-tion algorithm. In both cases the degree of multi-threading must be chosen when the stage starts execution, and cannot be adjusted thereafter, but can differ from pipeline stage to stage.
We model GATK pipeline stages with single-threaded execution time that is a linear function of the size of the first stage’s input data. Thus for each pipeline stage i we can specify coefficients ai and bi such that execution time
Ei can be given in terms of input data size d:
Ei(d) =aid+bi
We compute multi-threaded execution time assuming that the single-threaded execution time for a particular stage may be split by a constant factor ci into a sequential part and a
part which scales perfectly. Thus threaded execution time using tthreads Ti(t, d)relates toEi(d)by:
Ti(t, d) =ci
Ei(d)
t + (1−ci)Ei(d)
Thus the maximum possible speedup achievable by adding threads is limited in accordance with Amdahl’s law. The values of ai, bi and ci were determined for each pipeline
stage by linear regression of offline profiling data. The profile measured the time taken to analyse a variety of input sizes and thread counts. We found these simple models represented the profiling data very accurately.
A. Experimental Configuration
Most of cancer genome data centres are with a hybrid in-frastructure, that is they have their own decimated resources, and they will use public cloud resource when they need more computing resources for some cases. We thus setup a hybrid cloud for our evaluation which consist of two tiers: aprivate
tier (624 CPU cores and 64GB RAM per node) and apublic
tier. Using cores at either tier has a constant cost per core per unit time, with private cores being cheaper than public cores. The private tier represents the owned compute resources which are commonplace in scientific institutions with HPC requirements, with the cost representing depreciation of the owned machines or an internal incentive for fair sharing. The public tier represents cores or machines hired from a public cloud computing provider such as Amazon EC2, or perhaps a national-level academic shared computing facility. Here we assume that the private tier compute core is the same (Ghz, processor model, etc) as public tier compute core in our evaluation.
B. Evaluation Results
We ran a number of simulation sessions, varying the parameters shown in Table I. Table II gives the fixed ai,
bi andci parameters that determine the scalability of each
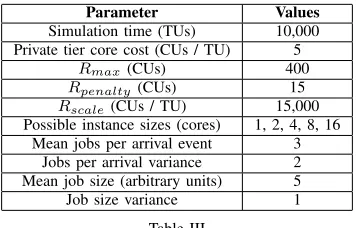
pipeline stage. Finally, Table III gives miscellaneous fixed parameters (recall that the various R parameters influence the reward given for completing a pipeline run in a given time, as described in Section III-A2). The scalability factors were derived from profiling of the real GATK with a variety of thread counts and input data sizes; the other parameters were selected by trial and error in order to exhibit a cross-section of the system’s behaviour. In particular the arrival batch size and job size parameters were chosen to produce significant short-term workload variation, such that the scaling and resource allocation algorithms would experience a wide range of cluster utilisation during a given simulation run.
All our experiments measure how performance varies with changing system workload by varying the mean job inter-arrival interval. For context, a mean interval of 2.0 time units represents a very busy system where much public resource hiring is necessary to keep the task queue from growing out of control, whilst a mean interval of 3.0 time units corresponds to a quiet system where the private resource tier is rarely if ever fully occupied. All measurements were repeated 10 times, and all error bars represent a single standard deviation either side of the mean.
Parameter Values
Resource allocation algorithm Greedy, long-term, long-term adaptive, best constant Horizontal scaling algorithm Always-scale, never-scale, predictive scaling Mean job inter-arrival interval 2.0, 2.1 ... 3.0 TUs
Task completion reward function Time-based, throughput-based Public tier core cost (CUs / TU) 20, 50, 80, 110
Table I
VARIABLE SIMULATION PARAMETERS
Pipeline stage ai bi ci
1 0.35 5.38 0.89 2 2.70 -0.53 0.02 3 1.74 3.93 0.69 4 3.35 0.53 0.79 5 1.03 17.86 0.91 6 0.02 0.39 0.25 7 0.01 5.10 0.02
Table II
PER-PIPELINE-STAGE SCALABILITY FACTORS
Parameter Values
Simulation time (TUs) 10,000 Private tier core cost (CUs / TU) 5
Rmax(CUs) 400
Rpenalty(CUs) 15 Rscale(CUs / TU) 15,000
Possible instance sizes (cores) 1, 2, 4, 8, 16 Mean jobs per arrival event 3
Jobs per arrival variance 2 Mean job size (arbitrary units) 5 Job size variance 1
Table III
MISCELLANEOUS SIMULATION ATTRIBUTES FIXED ACROSS ALL RUNS
2.0 2.2 2.4 2.6 2.8 3.0 Mean inter-arrival interval (TUs)
300 200 100 0 100 200 300 400 500 600
Mean profit per pipeline run (CUs)
Reward function: Time-based Public-tier hire cost (CUs per TU): 50 Resource allocation algorithm: Best constant plan
Profit vs. mean arrival interval for various horizontal scaling functions
Horizontal scaling function
Predictive Always-scale Never-scale
Figure 4. Reward-to-time vs. cores for various horizontally-scaled, heterogeneous simulation.
6
8
10
12
14
16
18
20
22
24
Total core-stages per pipeline run
0.5
1.0
1.5
2.0
2.5
3.0
3.5
Reward-to-cost ratio
Figure 5. Reward-to-cost ratio vs. cores for horizontally-scaled, hetero-geneous simulation.
marginally better than either baseline, although it remains within a standard deviation of either.
Also we combined both dynamic horizontal scaling and heterogeneous workers, again permitting different stages to use different degrees of multithreading, but allowing (simulated) CELAR to resize each of these pools as required. We now pay the 30 second startup penalty whenever a worker was previously assigned to a pool that uses a different number of threads, as CELAR would need to shut it down, adjust the number of VCPUs, and restart it for its new role. Figure 5 shows the relationship between the number of cores employed per pipeline run and the reward-to-cost ratio achieved. This configuration achieves a ratio of 3.11, the best of all configurations, thanks to its ability to support multithreaded pipeline stages without the rigidity of statically assigning workers to phases.
We explored all permutations of resource allocation al-gorithm, horizontal scaling alal-gorithm, reward scheme and workload, and found that our proposed algorithms are often able to improve performance above their respective base-lines, demonstrating that real-world workloads using the GATK and similar analysis tools may benefit from intelligent cluster scaling and pipeline stage sizing. We found that the SCAN outperforms the best-constant baseline algorithm in many circumstances, and that the SCAN’s predictive horizontal scaling represents a useful compromise between the two baseline schemes that always or never scale when private resources are fully occupied.
V. RELATEDWORK
TransMart, Taverna, BioMart, and InforSense KDE [19]– [23]. To the best of our knowledge, they all can hire public cloud resources to satisfy their resource requirements, but follow a simple hire-on-demand policy when doing so. None of these systems have smart mechanisms to improve the application performance and reduce the cost of big genome analysis.
Galaxy is a web-based platform with many built-in genome analytic workflows [19]. In particular, the Galaxy CloudMan was developed as a software package to provide a common interface to different cloud infrastructures. It depends on the cloud infrastructure to improve performance and cost effective for particular applications. TransMart is a translational platform allowing the management and exploration of clinical and omics data [20]. It supports complicated data queries crossing domains by using multiple relational databases, but does not provide any mechanism to address the performance and cost-effective issues. Cloud computing is simply employed to provide elastic computing resource for back-end database systems.
String and Cytoscape are application platform for search-ing and visualizsearch-ing molecular function and/or interaction networks and biological pathways and integrating these networks with annotations, gene expression profiles and other state data [24], [25]. Similarly, BRISK and the cBio Cancer Genomics Portal focus mainly on the exploration of omics data, and iDASH provides biomedical and be-havioural researchers with access to data, software and a high-performance computing environment [26]–[28]. None of them address performance issues or reduce the cost of required resources for genomic data analysis in clouds.
There are some works on scheduling strategies for cloud environments [29]–[31]. In [29], authors proposed an opti-mized scheduling algorithm to achieve the optimization or sub-optimization for cloud scheduling. In this algorithm an Improved Genetic Algorithm (IGA) is used for the auto-mated scheduling policy. It is used to increase the utilization rate of resources and speed. However, the majority of these scheduling strategies are static in nature. They produce a good schedule given the current state of resources in Clouds or Grids and do not take into account changes in resource availability. SCAN enables dynamic scheduling that is done on-the-fly considering the current state of the system and adaptive in application nature.
VI. CONCLUSION
Genome analysis needs to process large amounts of omic data. An application platform must be smart enough to han-dle those data requirements and facilitate the corresponding processes. In this paper, we present the SCAN, a smart application platform for big genomic data analysis in clouds. We discuss the smart mechanisms of the SCAN, as well as its key components. We conduct a simulation study which
shows that SCAN scheduler is able to outperform simple baseline schemes in a wide variety of circumstances.
In the future, we intend to investigate how the SCAN can better work with proteome analysis and drug discovery applications. We also plan to adopt learning algorithms to guide the Scheduler, and enhance the interaction between the SCAN and Cloud middleware.
ACKNOWLEDGEMENT
This work was supported by the European Commission’s CELAR (317790) FP7 project (FP7- ICT-2011-8). We thank the Scientific Computing team and RNA Biology Group at CRUK MI for their helpful comments. We would like to thank CELAR partners, in particular, the Laboratory for Internet Computing (LINC), University of Cyprus for their excellent collaboration work on the CELAR.
REFERENCES
[1] P. A. Futreal, L. Coin, M. Marshall, T. Down, T. Hubbard, R. Wooster, N. Rahman, and M. R. Stratton, “A census
of human cancer genes,” Nature reviews. Cancer, vol. 4,
no. 3, p. 177183, March 2004. [Online]. Available:
http://europepmc.org/articles/PMC2665285
[2] F. W. Albert and L. Kruglyak, “The role of regulatory
varia-tion in complex traits and disease,” Nature reviews. Cancer,
vol. 16, no. 4, p. 197212, February 2015.
[3] A. Thompson, M. Abu, and D. Hanger, “Key issues in the acquisition and analysis of qualitative and quantitative mass spectrometry data for peptide-centric proteomic experiments,”
in Amino Acids, submitted.
[4] P. Flicek and et al., “Ensembl 2014,”Nucleic Acids Research,
vol. 42, no. Database-Issue, pp. 749–755, 2014. [Online]. Available: http://dx.doi.org/10.1093/nar/gkt1196
[5] P. Cock and et al., “The sanger fastq file format for sequences with quality scores, and the solexa/illumina
fastq variants,” Nucleic Acids Research, vol. 38,
no. 6, pp. 1767–1771, 2010. [Online]. Available:
http://nar.oxfordjournals.org/content/38/6/1767.abstract
[6] H. Li and et al., “The sequence alignment map
format and samtools,” Bioinformatics, vol. 25, no. 16,
pp. 2078–2079, Aug. 2009. [Online]. Available:
http://dx.doi.org/10.1093/bioinformatics/btp352
[7] C. van El and et al., “Whole-genome sequencing in health care. recommendations of the european society of human
genetics,” European Journal of Human Genetics, vol. 21
Suppl 1, pp. S1–5, 2013.
[8] A. McKenna, M. Hanna, E. Banks, A. Sivachenko,
K. Cibulskis, A. Kernytsky, K. Garimella, D. Altshuler, S. Gabriel, M. Daly, and M. A. DePristo, “The Genome Analysis Toolkit: a MapReduce framework for analyzing
next-generation DNA sequencing data.” Genome research,
[9] H. Li and R. Durbin, “Fast and accurate long-read alignment
with burrowswheeler transform,” Bioinformatics, vol. 26,
no. 5, p. 589595, January 2010.
[10] J. Cox and M. Mann, “Maxquant enables high peptide iden-tification rates, individualized p.p.b.-range mass accuracies
and proteome-wide protein quantification,” Nature Biotech,
vol. 26, no. 12, p. 13671372, November 2008.
[11] A. Carpenter, T. Jones, M. Lamprecht, C. Clarke, I. Kang, O. Friman, D. Guertin, J. Chang, R. Lindquist, J. Moffat, P. Golland, and D. Sabatini, “Cellprofiler: image analysis software for identifying and quantifying cell phenotypes,”
Genome Biology, vol. 7, no. 10, p. R100, 2006. [Online].
Available: http://genomebiology.com/2006/7/10/R100
[12] “Jena 2 Ontology API,” http://jena.sourceforge.net/ontology/.
[13] N. F. Noy, S. D. M. Sintek, R. W. F. M. Crubezy, and M. A. Musen., “Creating semantic web contents with protege-2000,”
IEEE Intelligent Systems, vol. 16, pp. 60–71, 2001.
[14] M. Ashburner, C. A. Ball, J. A. Blake, D. Botstein, H. Butler, J. M. Cherry, A. P. Davis, K. Dolinski, S. S. Dwight, J. T. Eppig, M. A. Harris, D. P. Hill, L. Issel-Tarver, A. Kasarskis, S. Lewis, J. C. Matese, J. E. Richardson, M. Ringwald, G. M. Rubin, and G. Sherlock, “Gene ontology: tool for the unification of biology. The Gene Ontology Consortium.”
Nature genetics, vol. 25, no. 1, pp. 25–29, May 2000.
[Online]. Available: http://dx.doi.org/10.1038/75556
[15] C. Smowton, A. Balla, D. Antoniades, C. Miller, G. Pallis, M. Dikaiakos, and W. Xing, “Analysing cancer genomics in
the elastic cloud,” in Proceedings of the CCGrid Workshop
on Clusters, Clouds and Grids for Life Sciences (to appear).
IEEE/ACM, 2015.
[16] E. Prud’hommeaux and A. Seaborne,SPARQL Query
Lan-guage for RDF, W3C Working Draft, July 2005.
[17] G. Copil, D. Moldovan, D.-H. Le, H.-L. Truong, S. Dustdar, C. Sofokleous, N. Loulloudes, D. Trihinas, G. Pallis, M. D. Dikaiakos, C. Sheridan, E. Floros, C. K. Loverdos, K. Star, and W. Xing, “On controlling elasticity of cloud applications
in celar,” inEmerging Research in Cloud Distributed
Com-puting Systems, Advances in Systems Analysis, Software En-gineering, and High Performance Computing (ASASEHPC)
Book Series, 2015.
[18] I. Giannakopoulos, N. Papailiou, C. Mantas, I. Konstantinou, D. Tsoumakos, and N. Koziris, “CELAR: Automated
Appli-cation Elasticity Platform.” IEEE International Conference
on Big Data, 2014.
[19] J. Goecks, A. Nekrutenko, J. Taylor, and T. G.
Team, “Galaxy: a comprehensive approach for supporting
accessible, reproducible, and transparent computational
research in the life sciences,” Genome Biology,
vol. 11, no. 8, p. R86, 2010. [Online]. Available:
http://genomebiology.com/2010/11/8/R86
[20] B. Athey, M. Braxenthaler, M. Haas, and Y. Guo, “transmart: An open source and community-driven informatics and data
sharing platform for clinical and translational research.”AMIA
Joint Summits on Translational Science proceedings AMIA
Summit on Translational Science, vol. 2013, pp. 6–8, 2012.
[21] D. Hull, K. Wolstencroft, R. Stevens, C. Goble, M. R. Pocock, P. Li, and T. Oinn, “Taverna: a tool for building and running
workflows of services,” Nucleic Acids Res, pp. 729–732,
2006.
[22] D. Smedley, S. Haider, B. Ballester, R. Holland, D. London, G. Thorisson, and A. Kasprzyk, “Biomart - biological queries
made easy,” BMC Genomics, vol. 10, no. 1, p. 22, 2009.
[Online]. Available:
http://www.biomedcentral.com/1471-2164/10/22
[23] Q. Lu, P. Hao, V. Curcin, W. He, Y.-Y. Li, Q.-M. Luo, Y.-K. Guo, and Y.-X. Li, “Kde bioscience: Platform for
bioinfor-matics analysis workflows,” JOURNAL OF BIOMEDICAL
INFORMATICS, vol. 39, pp. 440–450, 2006. [Online].
Available: http://dx.doi.org/10.1016/j.jbi.2005.09.001
[24] D. Szklarczyk, A. Franceschini, M. Kuhn, M. Simonovic, A. Roth, P. Minguez, T. Doerks, M. Stark, J. Muller, P. Bork, L. J. Jensen, and C. v. Mering, “The string database in 2011: functional interaction networks of proteins, globally
integrated and scored,”Nucleic Acids Research, 2010.
[25] M. Cline, M. Smoot, E. Cerami, A. Kuchinsky, N. Landys, C. Workman, R. Christmas, I. Avila-Campilo, M. Creech, B. Gross, K. Hanspers, R. Isserlin, R. Kelley, S. Kill-coyne, S. Lotia, S. Maere, J. Morris, K. Ono, V. Pavlovic, A. Pico, A. Vailaya, P. Wang, A. Adler, B. Conklin, L. Hood, M. Kuiper, C. Sander, I. Schmulevich, B. Schwikowski, G. Warner, T. Ideker, and G. Bader, “Integration of biological
networks and gene expression data using cytoscape,”Nature
Protocols, vol. 2, no. 10, pp. 2366–2382, 2007.
[26] A. Tan, B. W. Tripp, and D. Daley, “Brisk - research-oriented
storage kit for biology-related data.”Bioinformatics, vol. 27,
no. 17, pp. 2422–2425, 2011.
[27] J. Gao, B. A. Aksoy, U. Dogrusoz, G. Dresdner, B. Gross, S. O. Sumer, Y. Sun, A. Jacobsen, R. Sinha, E. Larsson, E. Cerami, C. Sander, and N. Schultz, “Integrative analysis of complex cancer genomics and clinical profiles using the
cbioportal,” Science Signaling, vol. 6, no. 269, pp. pl1–pl1,
2013.
[28] I. N. Sarkar, A. J. Butte, Y. A. Lussier, P. Tarczy-Hornoch, and L. Ohno-Machado, “Translational bioinformatics: linking
knowledge across biological and clinical realms.”J Am Med
Inform Assoc, vol. 18, pp. 354–7, 2011 Jul-Aug 2011.
[29] H. Zhong, K. Tao, and X. Zhang, “An approach to opti-mized resource scheduling algorithm for open-source cloud
systems,” inChinaGrid Conference (ChinaGrid), 2010 Fifth
Annual, July 2010, pp. 124–129.
[30] L. Wang, S. U. Khan, D. Chen, J. Koodziej, R. Ranjan, C. zhong Xu, and A. Zomaya, “Energy-aware parallel task
scheduling in a cluster,” Future Generation Computer
Sys-tems, vol. 29, no. 7, pp. 1661 – 1670, 2013.
[31] L. Wang, G. von Laszewski, J. Dayal, X. He, A. J. Younge, and T. R. Furlani, “Towards thermal aware workload
schedul-ing in a data center,” inThe 10th International Symposium on
Pervasive Systems, Algorithms, and Networks, ISPAN 2009,
Kaohsiung, Taiwan, December 14-16, 2009, 2009, pp. 116–