TITLE Utility Approaches to Evaluating the Effectiveness of Consumer Confidence Reports AUTHORS
Jessica Evans ([email protected], ORCID 0000-0002-9200-2948, American Water Works
Association, 1300 I Street NW Ste 701W Washington, DC 200051)
Adam T. Carpenter ([email protected], ORCID 0000-0002-9688-8088, American Water
Works Association, 1300 I Street NW Ste 701W Washington, DC 20005)
ABSTRACT The Safe Drinking Water ActAmendments of 1996 require community water systems in the United States to send consumers Consumer Confidence Reports (CCRs). CCRs
contain information on detected contaminants and required educational information about
drinking water. The authors of this study developed a survey to evaluate how utilities track
consumer feedback, understanding, and the role of the CCR in shaping consumer perceptions
about water quality. Responses from this survey indicate it is common for utilities to indirectly
track the effectiveness of their CCRs, but few utilities indicated directly evaluating consumer
understanding or the effect of CCRs on consumer perceptions.
KEYWORDS consumer confidence report, communication, water quality report
1 Indiana University, Paul H. O’Neill School of Public and Environmental Affairs, 1315 E. 10th
Street, Bloomington IN 47404
1.1 BACKGROUND
A consumer confidence report (CCR) is required to be prepared annually by most
community water systems (CWS) under the 1996 amendments to the Safe Drinking Water Act
(PL 104-82). The purpose of the report, which is often referred to as a water quality report, is to
provide information to consumers and enable them to make health-based decisions regarding
drinking water consumption. The CCR serves as a public right-to-know provision of the SDWA
(USEPA, 1998).
Under the CCR rule, CWSs with at least 15 service connections or serving more than 25
consumers year-round must provide an annual report for customers that includes information on
the quality and safety of their drinking water. Unless the CWS has a waiver, CWSs must directly
deliver the report to customers. The report must include:
1. water system information
2. information on the source of water
3. required definitions
4. a table summarizing detected contaminants
5. information on monitoring for Cryptosporidium, radon, and other contaminants
6. compliance with other drinking water regulations
7. variance and exemptions if applicable and
8. required educational information.
Required educational information includes statements about contaminants in all drinking
water, information to vulnerable populations about Cryptosporidium, and statements on nitrate,
arsenic, and lead if applicable (USEPA, 1998). CWSs are required to distribute the CCR to
after the report is due provide certification to their primacy agency that the report has been sent
to consumers and contains correct information (USEPA, 1998).
1.2 CCR Effectiveness
Before the development and first distribution of the final CCR rule, researchers began to
evaluate the effectiveness of components that would go into CCRs, including whether the pilot
versions of the report affected consumers’ confidence in the safety of their drinking water. Trax
and Snyder (1998) conducted a questionnaire that evaluated consumers’ overall understanding of
a pilot CCR and found that 62-86% of customers remembered receiving the CCR. Those who
recalled receiving the CCR, however, did not recall most important information, as determined
by the CCR rule guidelines, such as contact information, source of the water, water quality
contaminant levels, and the meanings of key terms, such as maximum contaminant level (MCL)
and maximum contaminant level goal (MCLG). Importantly, the authors considered important
information to be information that is required by the CCR rule, and the CCR rule does not
require summary statements on whether water quality meets standards or other condensed
information consumers may find more helpful. Trax and Snyder (1998) concluded it was
possible there was an overload of information in the CCR.
In another evaluation of the report’s effectiveness, one water utility in Connecticut
voluntarily created and delivered a pilot CCR in 1997 and conducted pre- and post-report
surveys on consumer response, finding that consumer confidence in water quality increased 2.4%
(Odugbesan, Vaughn, Oswald, & Herlihy, 1998). Roper Starch (1999) conducted a nationwide
survey to determine what information consumers already knew and what they wanted to know
about drinking water. The study found that Americans wanted more information about the
indicated that they “sometimes” or “always” read information regarding drinking water (Roper
Starch, 1999). During the development of their first CCR, District of Columbia Water and Sewer
Authority (now DC Water) conducted focus groups to evaluate and improve the report
(Spiesman, Bhat, Lawson, & Rizzo, 2002). They found that the best practices for their CCR
would be to include simple, large graphics and summary statements in larger font for those
consumers who did not want detailed information (Spiesman et al., 2002).
Researchers continued to evaluate the effectiveness of the consumer confidence reports in
the initial years after the rule. After the fourth year of utilities sending the CCR, Benson, Walker,
and Montecinos (2002) conducted surveys with 89 CWSs in Nevada that evaluated consumer
response, costs versus benefits of the CCR, and effectiveness of the CCR in informing
consumers about water quality. The study found that there was a slight increase in consumer
inquiries after distribution of the CCR. 39% of utility respondents indicated they believed the
benefits to consumers of the CCR outweighed the costs at that time. When asked whether they
believed benefits to consumers would continue to outweigh costs in the future, 51% of
respondents indicated that they believed so. Lastly, 61% of utility respondents indicated that they
felt the CCR was an effective tool to inform consumers about the source and quality of their
drinking water (Benson et al., 2002). Johnson (2003) aimed to evaluate the effects of format and
presentation of contaminant information on consumers’ perceptions about their water quality.
The study found that whether CCRs included qualitative descriptions of contaminant levels,
numerical contaminant levels in a table, or a bold statement indicating a violation had occurred
did not change overall consumer opinion on water quality and utility performance (Johnson,
violation information and that consumers who viewed reports with bolded violation statements
were more likely to indicate a violation had occurred (Johnson, 2003).
1.3.1 Challenges of the CCR: Readership and Recall
Researchers have studied the readership of the CCR. In 2002, the EPA conducted a
survey of 1,000 households that included questions on the CCR. The survey found that only 29%
of respondents indicated they had read their CCR and an additional 8% recalled receiving the
CCR (USEPA, 2003). The survey found that 71% of respondents were either “confident” or
“very confident” about the quality and safety of their tap water and over 90% indicated they
would like more information about possible contaminants in their water (USEPA, 2003). Lazo et
al. (2004) evaluated how CCRs influenced consumer perceptions and found that only 40% of
consumer respondents remembered receiving a water quality report. Of those who remembered
receiving a CCR, over 40% felt more confident in their water quality. The authors then estimated
that 35% of all customer households read the CCR (Lazo et al., 2004).
In a more recent evaluation of CCR effectiveness, the Las Vegas Valley Water District
evaluated the effects of primer mailing formats on customers’ recall of the CCR. In this study,
primer mailing pieces were letters or postcards sent to customers indicating the Consumer
Confidence Report would be delivered in the near future. The authors found recall of the CCR
was higher among individuals who remembered receiving any primer over individuals who did
not remember receiving a primer at all. The study also found any recall of the CCR improved
consumers’ ratings on drinking water safety (Davis, 2007), indicating that recall of any primer
piece shaped consumers’ perception of drinking water. Similarly, Carpenter and Roberson
(2013) conducted a series of utility and consumer surveys assessing recall and opinions on
about CCRs, and 49.5% of respondents recalled receiving one either in the past year or sometime
in the last three years. Of those who recalled receiving a CCR, between 65%-93% somewhat or
strongly agreed that the report contained important information and increased their confidence in
their water supply (Carpenter & Roberson, 2013).
1.3.2 Challenges of the CCR: Complex, Technical Language and Mandated Information Community water systems are required to include definitions and other information with
language that is suggested or mandated by the EPA or state’s primacy agency (USEPA, 1998).
The nature of this language required in the CCR began as and has continued to be a source of
concern for many CWSs (Berberich, 1997). Johnson (2001) evaluated public reaction to
language required by the CCR rule; the study found the majority of respondents understood the
mandated language but expressed concern about water quality after reading it (Johnson, 2001).
Rudd, Kaphingst, Colton, Gregoire, and Hyde (2010) aimed to rewrite a utility’s CCR in plain
language. The authors assessed, restructured, and rewrote a utility’s CCR, focusing on simple
vocabulary and sentence structure and length. The utility in charge of sending the CCR adopted
some of the researchers’ changes but were limited by the increase in report length, associated
costs, and mandated language that could not be changed (Rudd et al., 2010).
Researchers have continued to evaluate the effects of the required language on
consumers’ confidence in water quality and how CWSs can improve their communication.
Phetxumphou et al. (2016) evaluated the understandability of a sample of CCRs and found that
many of the CCRs failed to effectively communicate drinking water information. The authors
trained individuals to rate a sample of CCRs using the Centers for Disease Control and
Prevention’s Clear Communication Index (CCI) indices and found that none of the CCRs had
effective public health communication, the authors of the study concluded that CWSs were not
effectively communicating water quality information to their customers (Phetxumphou et al.,
2016).
In another study, the same group of researchers evaluated the readability of a nationally
representative sample of CCRs using Flesch-Kincaid readability tests (Roy at al., 2015).
Flesh-Kincaid readability tests use measures of word and sentence length to assess how difficult a
passage is to understand; the tests develop a relative score and reading level associated with U.S.
grade-level. Flesh-Kincaid tests are common in education, publishing, healthcare, and industry
for written forms of communication (Kincaid et al., 1975). The authors found that the CCRs
were written at the 11th to 14th grade level, while the National Institute of Health recommends
public health communications be written at a sixth or seventh grade level (Roy et al., 2015). The
authors suggested utilities consider adjusting the Flesch-Kincaid reading level of their CCR to
increase its effectiveness (Phetxumphou et al., 2017).
1.4.1 Recent Analysis and Anticipated Changes to the CCR
The regulatory driver and structure underlying the CCR has been largely unchanged since
the CCR rule was finalized in 1998. However, there have been a number of efforts focused on
analyzing the use of the CCR from both a regulatory and communications perspective.
1.4.2 Retrospective Review of the CCR
In 2011, U.S. EPA announced that a retrospective review of the CCR rule would be
conducted as part of the Obama Administration’s Executive Order 13563 (76 FR 3821, 2011).
One EPA official described the review as an opportunity to increase consumer awareness of
water quality through consideration of new CCR methods (Eisenberg, 2011). In 2012, the EPA
and consideration of electronic delivery of the CCR (USEPA, 2012). Public feedback on CCR
understandability included views that information in the CCR could be confusing, misleading,
and alarming, especially the detected contaminants tables and health effects language. The
stakeholders involved in the understandability portion of the retrospective review suggested that
the EPA update and strengthen guidance and templates (USEPA, 2012).
1.4.3 Electronic Delivery of the CCR
As part of the retrospective review, EPA considered the potential merits and drawbacks
of electronic delivery of the CCR. Stakeholders believed that printing and mailing the CCR was
unnecessarily expensive, technological and regulatory concerns could inhibit electronic delivery,
and overcoming those concerns to allow for electronic delivery would provide multiple benefits
to consumers (USEPA, 2012). After the retrospective review, U.S. EPA released a memorandum
(USEPA, 2013b) detailing five electronic delivery options that would fulfill the CCR rule’s
requirement for reports to be “mailed or otherwise directly delivered” (USEPA, 1998). The
electronic delivery methods include a CCR embedded in an email message, a CCR sent as an
attachment to an email, URL linked directly to the CCR sent via email, a URL linked directly to
the CCR mailed to customers (e.g. via a water bill’s text, a separate mailing, etc.), or any
additional electronic delivery method that met the definition of direct delivery (USEPA, 2013b).
As part of an evaluation of possible benefits of electronic delivery, Carpenter and Roberson
(2013) conducted two surveys with CWSs and one public survey and found that electronic
delivery of the CCR could result in nearly $20 million in cost savings annually to utilities.
1.5 Anticipated Changes from America’s Water Infrastructure Act of 2018 (AWIA) America’s Water Infrastructure Act of 2018 (S. 3021, Public Law 115-270) was signed
Drinking Water Act. Section 2008 makes changes to the Consumer Confidence Report, which
EPA will need to develop regulations for by October 2020. These changes include:
• Utilities with greater than 10,000 population served will need to provide CCRs at least twice per year
• The option for electronic delivery is now codified in the law, rather than an interpretation of previous law
• Increasing the “readability, clarity, and understandability” and “accuracy” of the information within the CCR
• Including information about corrosion control efforts as part of the required elements of the CCR.
Given these changes, additional information about the current use of CCRs and methods to
utilize it as a communications tool will be increasingly important for policymakers and utilities
to consider.
1.6 CCR as a Communications Tool Beyond Required Information
A roundtable of utility officials gathered by the American Water Works Association met
in 1997 when the CCR rule was still in development to discuss challenges and benefits of the
upcoming rule. In addition to concerns about the health effects language, participants noted that
the CCR could be utilized as an annual report on water quality, including as an opportunity to
make consumers more comfortable with their water source (Berberich, 1997). Many authors
have since conducted studies with suggestions on how to increase the effectiveness or type of
information included in CCRs (Meyer-Emerick, 2004; Phetxumphou et al., 2017; Spiesman et
al., 2004). USEPA provides the CCR iWriter tool and reference sheets for utilities to consult
emphasizes the role of the CCR as a communications tool that can inform customers of other
issues related to their drinking water, such as source water protection or water conservation
methods (USEPA, 2009).
There is an opportunity to utilize the CCR as an instrument to engage with customers,
provide meaningful information, and develop a process of continuous improvement based on
feedback. Despite the CCR’s potential, few researchers have comprehensively examined how
utilities track the CCR’s effectiveness and how utilities use the CCR for purposes beyond the
regulatory requirements. This study, therefore, explores how utilities track the CCR’s
effectiveness and how it is utilized as a communications tool. The results of this survey may
provide a baseline assessment of utilities’ use of the CCR as well as research and policy options
for future consideration.
2.1 Survey Methods
In light of concerns among U.S. consumers about the quality of drinking water (AP-GfK,
2016; Chapman University, 2017; DiJulio, Firth, Kirzinger, & Brodie, 2016; Firth, Kirzinger, &
Brodie, 2016; McCarthy, 2016, 2017) and continuing issues with the effectiveness of CCRs
(Phetxumphou et al., 2016; Roy et al., 2015), community water systems face challenges in
increasing consumers’ confidence in their drinking water. Although the CCR is one report most
CWSs must use to communicate about the quality of their drinking water, concerns about
effectiveness of the CCR remain. This survey was developed to understand how U.S. utilities
track consumer feedback, understanding, and the role of their CCR in shaping consumer
perceptions about water quality. The survey also aimed to identify consistent trends in consumer
feedback or common areas of consumer misunderstanding and evaluate what methods utilities
The survey was conducted from June 25, 2018 through July 23, 2018. It was distributed
to American Water Works Association’s approximately 4,000 member utilities. A reminder
message was sent out approximately one week before the survey closed. The following
categories of questions were included in the survey:
- Information about the utility, including utility name, state, and population served.
Some of this information has been anonymized as the survey was conducted with
the agreement that individual responses would not be identified. Utilities were not
asked to identify whether they were publicly or privately operated.
- Information about how the utility tracks engagement and understanding of the
CCR
- Information about how the utility tracks consumer confidence in water quality and
the effect of the CCR on consumer confidence in water quality
- Information about how the utility assesses what information consumers would
like in the CCR and ways the utility makes changes to increase engagement.
- Methods the utility uses to conduct outreach regarding the CCR, including
information on the utility’s website
- Whether the utility has used or is planning to use electronic delivery. For those
utilities that have, whether they’ve changed or added information that could not
be included before due to space, weight, or other limitations, and whether any
testing on the impact of electronic delivery has been completed
- Information about feedback received from customers about the CCR
- Information about any specific challenges in CCR required language
- Whether the utility updates water quality information more than once per year
through mail or electronic delivery
- Challenges the utility would face with a requirement to send more than one CCR
per year
There are both strengths and limitations to the sampling method utilized. The use of
AWWA’s members allows for wide distribution of the survey and reaches many large water
utilities. This wide reach can be seen in that the respondents collectively serve a population of
over 48.2 million people. With approximately 86% of the U.S. population of 327 million served
by public water systems (281 million), this sample contains the information of approximately
15% of the U.S. population served by community water systems. Since the main intent of this
study is to understand the breadth and depth of techniques used to engage customers with the
CCRs, this method accomplished reaching a large portion of the total possible study population.
However, as the sample pool contains very few small and very small (<3,300 and <500
population served) utilities, it does not necessarily represent the practices undertaken by those
utilities, which account for most of the nation's water utilities but a relatively small percentage of
the people served by public water supplies. To better understand CCR practices at these smaller
systems, future work could seek to specifically target systems of those types. The survey asked
only for information about institutional practices and did not ask for the opinions of or
information about individuals. The survey is therefore not considered human subjects research.
To maximize response rates, utilities were not asked to provide examples or data in response to
survey questions, such as questions about supplemental information included in the CCR or
regarding how utilities track consumer engagement of the CCR.
The survey was sent to AWWA’s approximately 4,000 utility members in U.S. states and
territories. The survey consisted of a total of 20 questions. Three questions were open-ended, and
17 questions were multiple choice. 240 respondents completed the online survey. To maximize
the number of responses, survey respondents were able to skip questions. As a result, each
question in the survey did not receive an equal number of responses. Survey results were
obtained from utilities in 43 U.S. states, excluding Alaska, Idaho, Mississippi, Montana,
Nebraska, Rhode Island, and Vermont. There were no responses from the District of Columbia.
There were responses from Guam and Puerto Rico. Because the CCR is a regulatory construct
unique to the United States, responses were not solicited from other countries. To minimize the
number of questions asked in the survey, utilities were not asked to identify whether they were
privately or publicly owned. As a result, the results from this survey reveal no information about
variation in CCR methods and community water system ownership.
Table 1 shows the distribution of responses to this survey by utility size. Utility sizes
were based on those designated in the final CCR Rule (USEPA, 1998). Notably, the distribution
of utility sizes represented in the survey differs from the distribution of utility sizes in the United
States (Table 2). When viewed by number of utilities, community water systems in the United
States are overwhelmingly very small (<500 population served) or small (501 - 3,300 population
served). As such, because the distribution of CCRs is directly tied to population served, the vast
majority of CCRs are provided by very large (>100,000 population served) and large (10,001 to
100,000 population served). For this reason, we recognize the applicability of these results to
very-small and small systems is limited, but with the respondents reporting that they collectively
serve a population of over 48,200,000 people, the respondents represent a considerable portion of
remain valuable despite these limitations. The respondents of this survey represent a higher
proportion of large (utilities serving between 10,000 and 100,000 people) and very large (utilities
serving more than 100,000 people) utilities than are represented in the United States. The authors
of this study recognize the results of this survey are therefore not representative of CCR methods
used by all US utilities. This difference in utility size distribution of this survey and distribution
of utility sizes does not interfere with the goals of the survey given that large and very large
utilities provide water for 82% of the US population served by public water systems (USEPA,
2013a).
3.2 Tracking CCR Effectiveness: How Utilities Track and Increase Consumer Engagement, Understanding, and Perceptions of the CCR
For the purposes of this study, CCR effectiveness includes whether a CCR drives
consumer engagement, is understandable to consumers, and/or affects consumers’ confidence in
their water. Survey respondents were asked to describe what methods their utility uses to track
consumer engagement and understanding of the CCR. Table 3 shows utilities’ responses. In total,
45% of utility respondents indicated they use at least one method of tracking consumer
engagement or understanding of the CCR, and 22% of utility respondents indicated they use two
or more methods. Of those utilities that indicated they use an “other” method, 10 indicated that
they track consumer engagement with the CCR using website analytics. Under mail delivery of
the CCR, utilities would need to perform surveys or other methods to estimate the readership of
their CCR. With electronic delivery, utilities that are able to track the number of times the report
has been accessed are able to more quickly estimate CCR readership.
Utilities were asked what methods they use to evaluate consumer perceptions about their
the CCR on shaping consumer confidence in water quality. 13% (30/238)of respondents
indicated they conduct consumer surveys evaluating consumer confidence in their water quality
generally, and 11% (25/238) of respondents indicated they conduct consumer surveys evaluating
specific consumer concerns about water quality. 15% (34/238) of respondents selected “other” as
a method of evaluating consumer confidence in water quality. 68% of respondents indicated they
do not track consumer perceptions about water quality. In turn, roughly one third of utilities in
this survey conducted at least one method of tracking consumer perceptions about their water
quality. These findings indicate that very few respondents are evaluating whether their CCR has
a direct effect on consumers’ confidence in water quality.
Meyer-Emerick (2004) noted CCRs may not address consumer concerns if the utilities
are not aware of what information consumers want to know. The survey, therefore, asked what
methods utilities use to evaluate information consumers would like in their CCRs. Less than 2%
(4/238) indicated they conduct surveys or polls that directly ask consumers what information
they would like in their report. 51% (121/238) of respondents indicated they address past
questions or concerns from consumers in evaluating what information consumers would like in
future CCRs. This finding means that more than half of the survey respondents have altered or
considered altering their CCR based on feedback from consumers. 9% (20/238) selected “other”
as a response, which included methods such as website analytics, social media, and tracking
requests for paper copies. 46% (108/238) of respondents indicated they do not use any methods
to understand what information consumers would like in their CCRs, pointing to an opportunity
for future improvement in engaging with customers.
The format and language of the CCR have been sources of concern for both utilities
et al., 2016; Roy et al., 2015; Rudd et al., 2010). Section 1414(c)(4)(B) of the Safe Drinking
Water Act lays out the specific requirements for the content of the CCR, including some format
and language that cannot be altered (USEPA, 1998). As previously discussed, America’s Water
Infrastructure Act of 2018 (AWIA) changes some CCR requirements and provides US EPA and
water utilities with an opportunity to reevaluate and possibly modify required language in a way
that would improve readability, understandability, and usefulness of the CCR. Under the CCR
rule, CWSs are able to add information that is deemed appropriate for public education, may
change the format of most information, and can add information not required under the rule
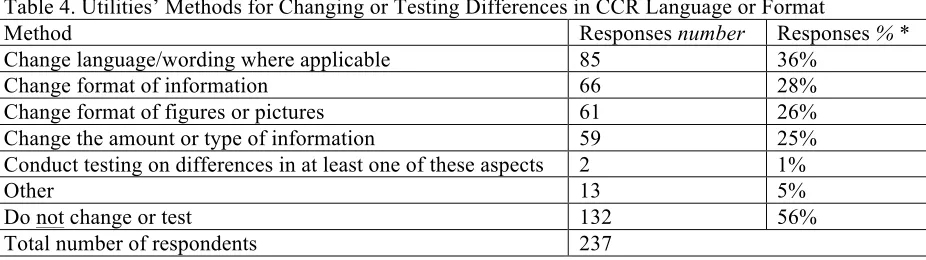
(USEPA, 1998). Utilities were asked what methods they use to change or test differences in CCR
language or format to increase consumer engagement or understanding of the content, as shown
in Table 4. Overall, 44% of respondents perform at least one method of changing or conducting
testing on format or language, and 29% of respondents perform two or more methods, indicating
that some utilities do use their capacity to make changes to the report where possible.
Utility representatives were asked to indicate methods their utility uses to conduct
outreach of the CCR. 44% (105/238) of respondents indicated they provide an electronic or
hardcopy newsletter to consumers. 34% (81/238) of respondents indicated that their utility gives
announcements to local media outlets. 80% (190/238) of respondents indicated that information
about the CCR is available on the utility website. 45% (107/238) of respondents indicated they
advertise the CCR on social media. Only 16% (38/238) of respondents indicated that they do not
conduct any outreach of the CCR. Overall, 83% of respondents perform at least one method of
outreach, and 68% of respondents perform two or more methods of outreach. This finding shows
a large majority of utilities perform at least one method of driving engagement and readership of
acceptable electronic delivery methods (USEPA, 2013b) or were required by utilities’ primacy
agency, so it is possible some utilities’ responses about outreach efforts are also part of their
primacy agency’s requirements for meeting good faith efforts to reach non-bill paying
consumers.
3.3 Utilities' Methods of Tracking and Increasing Consumer Engagement, Understanding, and Perceptions of the CCR Vary by Utility Size and Region
In total, 81% of utilities represented in this survey perform at least one method of
tracking or evaluating consumer feedback, understanding, or perceptions about water quality
based on the CCR. 19% (45 of 238 respondents) did not track CCR engagement or perceptions,
did not evaluate what information consumers would like in their CCR, and did not test or make
changes to the language or format of the CCR.
Figure 1 shows the utilities’ methods of tracking and increasing consumer engagement,
understanding, and perceptions by utility size. Using independent samples Kruskal-Wallis Tests
with a significance level of 0.05, the distribution of all five methods varied across system
size. P<0.001 was found for four of these categories, with P=0.002 for tracking of consumer
perceptions. The distribution of these variables is visualized in Table 1. Because the survey
yielded so few responses from CWSs serving a population of less than 500 people, results from
systems of this size were not included in the analysis.
Overall, larger utilities were more likely to indicate they perform at least one method of
tracking consumer engagement, understanding, or perceptions about water quality, changing
CCR language or format, evaluating what consumers want in their CCR, or advertising their
fewest respondents that indicated they conducted at least one method of evaluating and
increasing consumer engagement, understanding, and perceptions.
Figure 2 shows utilities’ methods of tracking and increasing consumer engagement,
understanding, and perceptions by US Census Bureau Region. Using independent samples
Kruskal-Wallis Tesst with a significance level of 0.05, the distribution of three of five methods
varied across regions, although with considerably less certainty than across system
size. Significance values were P=0.004 for the distribution of conducting publicity, p=.013 for
whether or not utilities tracked consumer perceptions, and p=0.039 for testing or changing
aspects of the CCR language or format. Of the tests that were not significant, whether utilities
tracked customer perceptions was p=.260 and whether utilities evaluated what information
consumers wanted in CCRs has P=0.963.
3.4.1 Role of Electronic Delivery of the CCR’s Effectiveness
In a 2012 survey, Carpenter and Roberson (2013) assessed potential cost savings,
feasibility, and other potential benefits of electronic delivery of CCRs. Following the same
outreach methods as this survey, Carpenter and Roberson (2013) distributed their survey to the
approximately 4,000 American Water Works Association utility members in the United States
and United States territories. Respondents to the Carpenter and Roberson (2013) survey
represented 713 utilities, compared to 240 respondents of this survey. The utility respondents to
the Carpenter and Roberson (2013) survey served a smaller average population size of 25.5
million people, compared to this survey’s average of 48.2 million people served. Respondents
were not asked to indicate whether their utility was publicly or privately owned.
Utilities were asked whether their utility had used electronic delivery for some or all of
delivery were compared to Carpenter and Roberson’s (2013) results. Notably, 70% of
respondents indicated they have delivered their CCR electronically, compared to up to 93% of
respondents that indicated they would use electronic delivery in the 2012 utility survey
(Carpenter & Roberson, 2013). To evaluate other possible effects of electronic delivery of the
CCR, respondents that indicated they currently or have sent the CCR electronically were asked if
their utility had added information or changed aspects of the CCR that were not included in years
where the CCR was delivered on paper. 57% (96/166) of respondents indicated they had not
added more information and did not plan to. 13% (21/166) responded that they had not added
information or changed aspects of the CCR but planned to. 32% (53/166) of respondents
indicated they had added or changed aspects of the CCR since changing to electronic delivery. A
summary of the information or altered aspects of the CCR is shown in Table 6. Importantly, the
majority of changes included the addition of more information, indicating that electronic delivery
allows for utilities to add clarifying information or information on water quality topics that may
not be required to be addressed in the CCR.
Respondents were then asked if their utility had tracked or conducted testing on whether
electronic delivery of the CCR had changed consumer feedback, understanding, or perceptions of
water quality based on the CCR.24% (40/166) responded that they have tracked the number of
times the report has been accessed. 4% (7/166) indicated they had conducted consumer surveys,
and 5% (9/166) of respondents selected "other." These findings continue a trend of indirectly
evaluating changes in the effects of delivery method of the CCR. 69% (114/166) of utilities
responded they have not tracked the effects of electronic delivery of the CCR on consumers’
A literature review did not reveal published research evaluating the differences in
readership or effectiveness of CCRs delivered by mail or electronically. For this reason,
evaluating and comparing the effect of different mail and electronic delivery methods on CCR
readership and recall is an important potential focus for future research. There may be variation
in CCR readership based on acceptable methods of electronic delivery, such as a URL included
in the electronic bill or URL included in the hard-copy bill. Electronic delivery introduces the
potential for utilities to examine CCR readership through website analytics, such as
click-through rates or page views. Utilities may not have low-cost methods of evaluating the
readership of their CCR sent through mail-delivery; such evaluations could include phone or
other customer surveys evaluating customer recall of receiving and reading the CCR. As such, a
potential area of future research may include evaluating whether electronic or mail delivery
methods affects CCR readership.
3.4.2 Cost Savings of Electronic Delivery of the CCR
In their 2012 utility survey, Carpenter and Roberson (2013) asked utilities whether they
expected to use electronic delivery and the expected cost savings of implementing various forms
of electronic delivery. The estimated nationwide CCR cost in Carpenter and Roberson (2013)
was $28,174,000 in 2012 dollars. Based on the information in Table 5 and values from
Carpenter and Roberson (2013), a new upper bound estimate of current cost savings by utilities
can be produced through the following calculation: Total pre-electronic delivery CCR costs X
average percentage of estimated cost savings for “Bill providing URL” methodology X the
percentage of utilities currently using electronic delivery = the upper bound of current electronic
Because Carpenter and Roberson (2013) were reporting in 2012 dollars, for
comparability, all of the values shown in Tables 7 and 8 are shown in both 2012 dollars and 2018
dollars (adjusting using the Bureau of Labor Statistics Calculator from January 2012 to January
2018). Table 7 shows this upper bound cost savings based on the utilities currently using
electronic delivery of the CCR.
The same equation can be repeated with “percentage of utilities currently using electronic
delivery” replaced with “percentage of utilities currently using electronic delivery plus
percentage of utilities that have not used electronic delivery but plan to.” The result is the upper
bound potential savings, which assumes all utilities who reported they may use electronic
delivery implement it in the future. These values are shown in Table 8.
The upper-bound cost estimates use the pre-electronic delivery costs to utilities and
percentages of cost savings resulting from the most-cost efficient electronic delivery method
evaluated in Carpenter and Roberson (2013). The upper-bound cost estimates assume that all
utilities conducting electronic delivery use the bill providing URL delivery method because it is
likely the most cost effective delivery method. A bill providing URL delivery method likely adds
the least or no additional cost to a utility since a URL adds little additional text to a bill delivered
through mail or electronically delivered bill. Other delivery methods, such as a mailed postcard
with the CCR URL, may introduce more costs to a utility given printing and mailing costs. This
upper bound savings estimate therefore does not take into consideration variation in utilities’
electronic CCR delivery methods.,
Carpenter and Roberson’s (2013) upper-bound savings estimate for electronic delivery of
the CCR was $19,549,000 (2012 dollars) or $21,377,000 (2018 dollars). Compared to Carpenter
is about 24% lower when considering only utilities already using electronic delivery (Table 7) or
12.5% lower when including utilities that may implement in the future (Table 8). The lower
upper bound savings estimate can be attributed to the lower percentage of utilities that have
implemented or are expecting to implement electronic delivery than was estimated in Carpenter
and Roberson (2013).
4.1 Trends in Consumer Feedback of the CCR
Utilities were asked what common consumer misunderstandings they encountered after
sending the CCR. Overall, 38% (87/230) indicated that they do not hear misunderstandings from
consumers, which means slightly less than half of utilities encountered no misunderstandings.
39% (90/230) indicated consumers experience difficulty interpreting whether levels of detected
contaminants are a concern, which was a pattern Johnson (2003) found. 21% (48/230) of
respondents indicated consumers had difficulty interpreting whether information in required
statements is applicable to them, and 32% (73/230) indicated that they encounter consumers not
understanding that tested contaminants not listed in the report are not detected, which was not a
pattern noted in the development of the CCR.
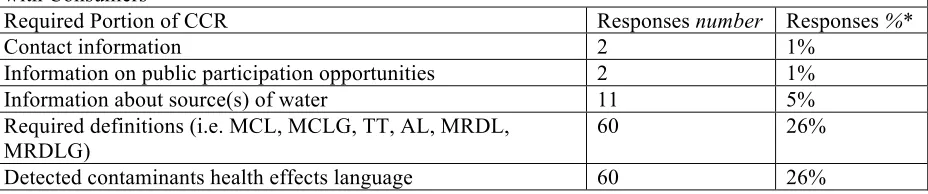
Table 9 shows a summary of utilities’ responses to CCR requirements that make it more
difficult for them to communicate to consumers. Some of those requirements were the same as
those noted in prior literature, such as required definitions (Trax & Snyder, 1998) and detected
contaminants’ health effects (Berberich, 1998). No single requirement was selected as causing
difficultly communicating by slightly more than one-quarter of respondents. In total, 53% of
respondents felt there was at least one aspect of the CCR requirements that made it more difficult
Utilities were asked to describe the feedback they received from consumers regarding the
CCR. 38% of respondents indicated they receive positive feedback from consumers. The highest
recorded response was a request for a copy of the CCR (58%, 131/227), indicating some
consumers may have lost their report, never received one, or wanted a hard copy. The next
highest recorded response was questions or concerns about water quality after reading the report
(56% or 126/227), in line with consumer concerns after reading the report that Johnson (2001)
had shown. 38% (87/227) of utilities indicated consumers have questions or concerns about a
water quality issue not included in the report, indicating that the CCR may not be answering all
of consumers’ concerns or questions about water quality. 21% (48/227) indicated consumers
found at least some of the report content too technical. 13% (29/227) of utilities indicated they
hear “other” feedback. Only 13% (29/227) of utilities indicated they did not receive any
feedback on the CCR. Utilities may not receive feedback on the CCR from consumers for a
multitude of reasons, including that consumers may not be reading the CCR, contact information
for the utility may not be easily accessible, or that consumers were satisfied with the information
in the CCR. The results from this survey question cannot reveal why utilities did not receive
feedback.
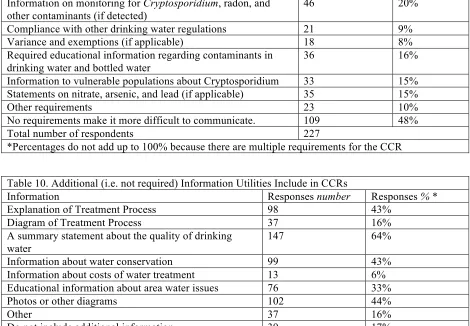
To understand what information utilities are sharing with consumers beyond information
required by the CCR Rule, utilities were asked what additional (i.e. not required) information
they include in the report. Table 10 lists their responses. A large majority of respondents (83%)
indicated they include at least one additional source of information, and 75% reported including
two or more additional sources of information, indicating the majority of respondents to this
survey are modifying and including information for consumers beyond CCR requirements.
quality of drinking water, which is consistent with Phetxumphou et al.’s (2016) finding that 63%
of CCRs evaluated in that study explicitly stated whether the water was safe to drink according
to state and federal standards.
4.2 Utility Concerns with A Potential Requirement to Send More Than One CCR Annually At the time this study was being designed, A U.S. House of Representatives bill (H.R.
3387), the Drinking Water System Improvement Act of 2017, had been introduced containing
provisions for improving and affecting water infrastructure, including one provision that would
require two consumer confidence reports to be released annually (H.R. 3387, 2017). To
understand what challenges this would present to utilities, utilities were asked how frequently
they update water quality and what concerns they would have if there were a requirement to send
more than one CCR annually. H.R. 3387 itself did not move forward in Congress, but many of
its provisions were ultimately incorporated into America’s Water Infrastructure Act, as described
in Section 1.5, after the data collection for this study was complete.
78% (179/230) of respondents indicated they send only the CCR once annually as
required. 14% (33/230) of utilities indicated they update water quality information more than
once a year through mail, electronic delivery, or a combination of delivery methods. 8% (18/230)
indicated they are considering updating information more than once annually. In total, less than a
quarter of the respondents indicated they send information more than once per year or are
considering doing so. This question was asked prior to the introduction or passage of AWIA and
its requirement for biannual delivery. This study did not assess whether utilities prepare and
make available additional and more frequent water quality information independent of the CCR
Regarding problems associated with a requirement to send more than one CCR a year,
66% of respondents (150/227) selected difficulty associated with staffing needs required to
create the CCR. 65% (148) indicated they would be concerned with costs associated with
printing, mailing, and other paper delivery services. It is unclear why 65% of respondents
indicated concern with paper delivery costs given that 70% of respondents indicated they use
electronic delivery for CCR delivery. 14% (31/227) indicated a concern about the difficulty
managing inquiries after a CCR is sent, and 15% (35/237) indicated a concern about technical
difficulties associated with billing systems and websites. 21% of respondents (47/227) selected
“other” as a concern regarding a requirement to send more than one CCR annually, including
that sending more than one would be wasted utility effort (18), a concern about negative effect
on public perception due to cost or causing confusion (11), and no concerns (three).
5.1 SUMMARY AND CONCLUSIONS
This survey sought to evaluate how community water systems track and evaluate the
effectiveness of their consumer confidence reports. Survey results indicate that the majority of
utilities perform indirect evaluations of the effectiveness of their CCRs, but very few indicated
performing surveys or other methods that directly evaluated the CCR’s effectiveness. While 81%
of utilities represented in this survey perform at least one method of tracking or evaluating
consumer feedback, understanding, or the role of the CCR in shaping perceptions about water
quality, very few utilities indicated they conduct surveys that directly evaluate consumers’
understanding of the CCR (5% of respondents), the role of the CCR in shaping consumer
confidence in water quality (2%), or test the effects of differences in CCR language or format
Census Bureau region. Exploring this variation by utility size and US Census Bureau region is a
topic for future research.
This survey also aimed to evaluate what areas of consumer misunderstanding and
feedback utilities receive regarding the CCR. Almost 40% of utilities indicated receiving positive
feedback of the CCR, indicating that some consumers may be satisfied with required information
in their CCR and that the CCR may be increasing consumers’ confidence in water quality.
Nearly 40% of utilities reported hearing no misunderstandings of the report from consumers. The
most commonly reported feedback and misunderstandings about the report were similar to
consumer concerns in initial literature about the report. Over half of utilities reported receiving
questions or concerns from consumers after reading the report, noted in Johnson (2001), and
38% reported receiving questions about water quality concerns not mentioned, highlighted as a
concern by Meyer-Emerick (2004).
Utilities may have little incentive to try to improve or evaluate the effectiveness of the
CCR given their own limited resources and the requirement to send the CCR with much of the
same required language regardless of feedback received from consumers. However, some survey
respondents reported modifying their CCR to increase consumer engagement with the report by
conducting outreach methods that are not required by the regulation. Other survey respondents
indicated modifying the language or format of their CCR to increase how understandable the
information in the report is to consumers. Notable examples include utilities altering the
Flesh-Kincaid reading level of their report to a seventh-grade reading level, using feedback from
citizens’ groups, and changing online CCR formats to be more user-friendly booklets.
The persistence of consumer concerns about the report highlights the importance of
evaluating the role of electronic delivery and its capacity to add more information or make more
visually appealing reports in shaping consumer confidence or knowledge of water quality.
Alternatively, future research may focus on comparing the readership or recall of CCRs
delivered by mail compared to those delivered electronically. Utilities may consider increasing
the effectiveness of their CCR by evaluating their CCR’s recall (Davis, 2007), increasing clarity
by adding summary statements (Phetxumphou et al., 2016), and decreasing sentence length or
word complexity where possible (Roy et al., 2015). Such considerations will help utilities more
clearly communicate information about water quality to consumers. Future research may also
focus on the impact of AWIA’s requirement for large utilities to send a CCR at least biannually
on the effectiveness of the CCR. Information gained from this study and related CCR research
may aid the EPA in addressing requirement set force by AWIA to increase the readability,
clarity, understandability, and accuracy of the information presented in the CCR.
ACKNOWLEDGEMENTS
The primary author’s internship to conduct this research was paid for by AWWA’s Water
Industry Technical Action Fund (WITAF). The authors appreciate the help of Andrea Dietrich of
Virginia Tech in providing valuable input regarding the content and analysis of the survey.
REFERENCES
76 FR 3821. 18 January 2011. Executive Order 13563. Improving Regulation and Regulatory Review. Federal Register https://www.federalregister.gov/documents/2011/01/21/2011-1385/improving-regulation-and-regulatory-review.
America’s Water Infrastructure Act of 2018, Pub L. No 115-270. https://www.congress.gov/bill/115th-congress/senate-bill/3021.
AP-GfK. (2016). A survey of the American general population (ages 18+). Associated Press-GfK Public Affairs & Corporate Communications, February 11-15, 2016. Retrieved 21
June 2018 from:
Benson, M., Walker, M., & Montecinos, C. (2002). Nevada’s CWS managers assess the CCRs.
Journal AWWA, 94(3), 65-70. https://dx.doi.org/10.1002/j.1551-8833.2002.tb09434.x
Berberich, C. (1998). Roundtable—consumer confidence reports: challenge and opportunity.
Journal AWWA, 90(1), 4-5. https://dx.doi.org/10.1002/j.1551-8833.1998.tb08355.x Carpenter, A.T., & Roberson, J.A. (2013). Electronic delivery of consumer confidence reports.
Journal AWWA, 105(3), 127-136.http://dx.doi.org/10.5942/jawwa.2013.105.0025 Centers for Disease Control and Prevention (CDC). (2015). The CDC Clear Communication
Index. https://www.cdc.gov/ccindex/index.html.
Chapman University. (2017). American’s top 10 fears 2017. Retrieved 21 June 2018 from:
https://blogs.chapman.edu/wilkinson/2017/10/11/americas-top-fears-2017/
Davis, J.C. (2007). Making the most of consumer confidence reports: how primer direct mail pieces affect customers’ recall. Proceedings from AWWA, Annual Conference, Toronto. Eisenberg, M. (2011). EPA Communiqué: enhancing public awareness of drinking water quality.
Journal AWWA. 103(12), 22-23. https://doi.org/10.1002/j.1551-8833.2011.tb11568.x DiJulio, B., Firth, J., Kirzinger, A., & Brodie, M. (2016). Kaiser Health Tracking Poll: February
2016. Kaiser Health Tracking Poll, February 2016. Retrieved 22 June 2018 from: https://www.kff.org/global-health-policy/poll-finding/kaiser-health-tracking-poll-february-2016/
Firth, J., Kirzinger, A., & Brodie, M. (2016). Kaiser Health Tracking Poll: April 2016. Kaiser Health Tracking Poll, April 2016. Retrieved 22 June 2018 from:
https://www.kff.org/report-section/kaiser-health-tracking-poll-april-2016-water-safety-and-hni/
Johnson, B. B. (2001). Public reaction to mandated language for U.S. drinking water quality reports. Risk: Health, Safety &Environment, 12, 153–178.
https://scholars.unh.edu/cgi/viewcontent.cgi?article=1468&context=risk.
Johnson, B.B. (2003). Do reports on drinking water quality affect customers’ concerns?
Experiments in report content. Risk Analysis, 23, 985-998. https://doi.org/10.1111/1539-6924.00375.
Kincaid, J.R., Fishburne Jr, R.P., Rogers, R.L. & Chissom, B.S. 1975. Derivation of New Readability Formulas (Automated Readability Index, Fog Count and Flesch Reading Ease Formula) for Navy Enlisted Personnel. Research Report from Naval Technical Command, Millington, TN, USA.
McCarthy, J. (2016). Americans’ concerns about water pollution edge up. Gallup. Retrieved 21 June 2018 from:
https://news.gallup.com/poll/190034/americans-concerns-water-pollution-edge.aspx.
McCarthy, J. (2017). In U.S. water pollution worries highest since 2001. Gallup, March 1-5. Retrieved 21 June 2018 from: https://news.gallup.com/poll/207536/water-pollution-worries-highest-2001.aspx.
Meyer-Emerick, N. (2004). Are we answering the right questions? Improving CCR communication. Journal AWWA, 96(8), 104-111. https://doi.org/10.1002/j.1551-8833.2004.tb10682.x.
Odugbesan, L., Vaughn, A., Oswald, L., & Herlihy, J. (1998). BHC Company’s 1st annual Water quality report: lesson’s learned. AWWA WQTC, San Diego.
Phetxumphou, K., Roy, S., Davy, B.M., Estabrooks, P., You, W., & Dietrich, A.M. (2016). Assessing clarity of message communication for mandated USEPA drinking water quality reports. Journal of Water and Health, 14, 223-235.
https://doi.org/10.2166/wh.2015.134.
Phetxumphou, K., Roy, S., Davy, B.M., Estabrooks, P., You, W., & Dietrich, A.M. (2017). Write consumer confidence reports customers can understand. Opflow, 43, 24-26.
https://doi.org/10.5991/OPF.2017.43.0010.
Roy, S., Phetxumphou, K., Dietrich, A.M., Estabrooks, P.A., You, W., & Davy, B.M. (2015). An evaluation of the readability of drinking water quality reports: a national assessment.
Journal of Water and Health, 13, 645-653. https://doi.org/10.2166/wh.2015.194. Rudd, R.E., Kaphingst, K., Colton, T., Gregoire, J., & Hyde, J. (2010). Rewriting public health
information in plain language. Journal of Health Communication, 9, 195-206. https://doi.org/10.1080/10810730490447039.
Spiesman, A.L., Bhat, S.S., Lawson, L., & Rizzo, G.S. (2002). Manager to manger -- Using the CCR to talk to your public. Journal AWWA, 94(7), 28-31.
https://dx.doi.org/10.1002/j.1551-8833.2002.tb09499.x.
Roper Starch. (1999). The national report card on safe drinking water knowledge, attitudes and behaviors. Washington, DC.: Natl. Envir. Education & Training Fdn.
https://nepis.epa.gov/Exe/ZyPURL.cgi?Dockey=400007U5.TXT.
Trax, J.R., & Snyder, H.D. (1998). A three-state pilot project to determine the effectiveness of a consumer confidence report template. Duncan, OK: Rural Water Res. & Education Fdn. USEPA (US Environmental Protection Agency). (1998). Consumer confidence reports: final
rule. Federal Register, 63:160:45512.
USEPA. (2003). Analysis and findings of the Gallup Organization’s drinking water customer satisfaction survey (EPA 816- K-03-005). Washington, DC: Environmental Protection Agency. https://nepis.epa.gov/Exe/ZyPURL.cgi?Dockey=901U0L00.TXT.
USEPA. (2009). Consumer confidence reports rule: a quick reference guide (EPA 816-F-09-009). Retrieved 5 June 2018 from: https://www.epa.gov/sites/production/files/2014-05/documents/guide_qrg_ccr_2011.pdf.
USEPA. (2012). Consumer confidence report (CCR) rule retrospective review summary (EPA 816-S-12-001).Retrieved 5 June 2018 from:
https://www.epa.gov/sites/production/files/2014-05/documents/epa816s12004.pdf. USEPA. (2013a). Fiscal year 2011 drinking water and ground water statistics (EPA
816-R-13-003).
http://wedocs.unep.org/bitstream/handle/20.500.11822/17813/Fiscal_Year_2011_Drinkin g_Water_and_Ground_Wat.pdf?sequence=1&isAllowed=y.
USEPA. (2013b). Memorandum to USEPA Regions I–X. Safe Drinking Water Act – consumer confidence rule delivery options. Retrieved 5 June 2018 from:
https://www.epa.gov/sites/production/files/2015-12/documents/ccrdeliveryoptionsmemo.pdf.
Tables
Table 1. Distribution of Survey Responses by Utility Population Served Utility Population
Size Category
Number of System Respondents
% Respondents* Population Served % of U.S.
Population Served
25-500 2 1% 621 >1%
501-3,300 34 14% 61,249 >1%
3,301-10,000 32 13% 206,422 >1%
10,001-100,000 102 43% 4,397,435 1.4%
>100,000 69 29% 43,606,602 14.1%
Total 239 100% 48,272,529 15.6%
*Remaining respondent (1) is a wholesaler that does not provide the CCR in full directly to customers.
Table 2. Distribution of U.S. Utility Sizes by Population Served Utility Population
Size Category
Number of Systems % of Systems U.S. Population
Served
% of U.S.
Population Served
25-500 28,346 55% 4,763,672 2%
501-3,300 13,737 27% 19,661,787 7%
3,301-10,000 4,936 10% 28,737,564 10%
10,001-100,000 3,802 7% 108,770,014 36%
>100,000 419 1% 137,283,104 46%
Source: US EPA. (2013a). Fiscal Year 2011 Drinking Water and Ground Water Statistics (EPA
816-R-13-003).
Table 3. Utilities’ Methods Used to Track Consumer Engagement or Understanding of the CCR
Method Responses number Responses % *
Record the number of inquiries or comments 84 35%
Record the content of inquiries or comments 57 24%
Conduct consumer surveys or other methods 12 5%
Other 27 11%
Do not track 131 55%
Total number of respondents 238
*Percentages do not add up to 100% because utilities may use more than one method to track consumer engagement or understanding.
Table 4. Utilities’ Methods for Changing or Testing Differences in CCR Language or Format
Method Responses number Responses % *
Change language/wording where applicable 85 36%
Change format of information 66 28%
Change format of figures or pictures 61 26%
Change the amount or type of information 59 25%
Conduct testing on differences in at least one of these aspects 2 1%
Other 13 5%
Do not change or test 132 56%
*Percentages do not add up to 100% because utilities may use more than one method of changing language or format aspects of their CCR.
Table 5. Utilities’ Delivery Methods of the CCR
Use of electronic delivery Responses number Responses %
Have used electronic delivery 168 70%
Had used electronic delivery and have since stopped 5 2%
Have not used electronic delivery but plan to 26 11%
Have not used electronic delivery and do not plan to 40 17%
Table 6. Additions and Changes Utilities Have Made to CCRs Since Changing to Electronic Delivery
Change Made Responses number
Provided More Information 43
More pictures 14
Overall More Visually Appealing 10
Other 8
Total Number of Utilities That Indicated They Have Made Changes Due to Electronic Delivery
53
Table 7. Upper Bound Cost Savings from Current Electronic Delivery of CCRs
Current electronic-delivery upper bound cost savings 2012 Dollars 2018 Dollars
Pre-electronic delivery nationwide CCR cost estimate* $28,174,000 $30,809,000
Percentage estimated cost savings for "Bill providing URL"
methodology* 75% 75%
Percentage of utilities using electronic delivery 70% 70%
Upper bound of current electronic delivery annual cost savings $14,791,000 $16,175,000
*Value derived from Carpenter & Roberson 2013
Table 8. Upper bound cost savings from potential future electronic delivery of CCRs
Potential electronic-delivery upper bound cost savings 2012 Dollars 2018 Dollars
Pre-electronic delivery nationwide CCR cost estimate* $28,174,000 $30,809,000
Percentage estimated cost savings for "Bill providing URL"
methodology* 75% 75%
Percentage of utilities using or considering electronic delivery 81% 81%
Upper bound of potential electronic delivery annual cost savings $17,116,000 $18,716,000
*Value derived from Carpenter & Roberson 2013
Table 9. Required Portions of CCR That Make It More Difficult for Utilities to Communicate Clearly with Consumers
Required Portion of CCR Responses number Responses %*
Contact information 2 1%
Information on public participation opportunities 2 1%
Information about source(s) of water 11 5%
Required definitions (i.e. MCL, MCLG, TT, AL, MRDL,
MRDLG) 60 26%
Information on monitoring for Cryptosporidium, radon, and other contaminants (if detected)
46 20%
Compliance with other drinking water regulations 21 9%
Variance and exemptions (if applicable) 18 8%
Required educational information regarding contaminants in drinking water and bottled water
36 16%
Information to vulnerable populations about Cryptosporidium 33 15%
Statements on nitrate, arsenic, and lead (if applicable) 35 15%
Other requirements 23 10%
No requirements make it more difficult to communicate. 109 48%
Total number of respondents 227
*Percentages do not add up to 100% because there are multiple requirements for the CCR
Table 10. Additional (i.e. not required) Information Utilities Include in CCRs
Information Responses number Responses % *
Explanation of Treatment Process 98 43%
Diagram of Treatment Process 37 16%
A summary statement about the quality of drinking water
147 64%
Information about water conservation 99 43%
Information about costs of water treatment 13 6%
Educational information about area water issues 76 33%
Photos or other diagrams 102 44%
Other 37 16%
Do not include additional information 39 17%
Total number of respondents 230
*Percentages do not add up to 100% because there are multiple requirements for the CCR
Figure 1. Utilities’ Methods of Tracking and Increasing Consumer Engagement, Understanding, and Perceptions of the CCR By Utility Size
0% 10% 20% 30% 40% 50% 60% 70% 80% 90% 100%
501-3,300 3,301-10,000 10,001-100,000 >100,000
PE
RC
EN
TA
G
E
O
F
U
TIL
IT
IE
S
UTILITY SIZE BY POPULATION SERVED Percentage Utilities That Track Consumer Perceptions Percentage of Utilities that Track CCR Engagement
Percentage of Utilities that Evaluate What Information Consumers Want in the CCR Percentage of Utilities that Test On Or Change Aspects of CCR Language or Format Percentage of Utilities that Conduct Publicity and Outreach of the CCR
n=69 n=102
Figure 2. Utilities’ Methods of Tracking and Increasing Consumer Engagement, Understanding, and Perceptions of the CCR By US Census Region
0% 10% 20% 30% 40% 50% 60% 70% 80% 90% 100%
REGION 1 (NORTHEAST) REGION 2 (MIDWEST) REGION 3 (SOUTH) REGION 4 (WEST)
PE
RC
EN
T
O
F
U
TIL
IT
IE
S
U.S. CENSUS BUREAU REGION Percentage of Utilities That Track CCR Engagement Percentage of Utilities that Track Consumer Perceptions
Percentage of Utilities that Evaluate What Information Consumers Want in the CCR Percentage of Utilities that Test On or Change Aspects of CCR Language or Format Percentage of Utilities that Conduct Publicity and Outreach of the CCR
n=77 n=73