CHK1 expression in Gastric Cancer
is modulated by p53 and RB1/E2F1:
implications in chemo/radiotherapy
response
J. Bargiela-Iparraguirre
1,*, L. Prado-Marchal
1,*, M. Fernandez-Fuente
2, A.
Gutierrez-González
1, J. Moreno-Rubio
3,4, M. Muñoz-Fernandez
5, M. Sereno
3, R. Sanchez-Prieto
6,7,
R. Perona
1,8,9& I. Sanchez-Perez
1,7,8,9Radiation has a limited but relevant role in the adjuvant therapy of gastric cancer (GC) patients. Since Chk1 plays a critical function in cellular response to genotoxic agents, we aimed to analyze the role of Chk1 in GC as a biomarker for radiotherapy resistance. We analyzed Chk1 expression in AGS and MKN45 human GC cell lines by RT-QPCR and WB and in a small cohort of human patient’s samples. We demonstrated that Chk1 overexpression specifically increases resistance to radiation in GC cells. Accordingly, abrogation of Chk1 activity with UCN-01 and its expression with shChk1 increased sensitivity to bleomycin and radiation. Furthermore, when we assessed Chk1 expression in human samples, we found a correlation between nuclear Chk1 accumulation and a decrease in progression free survival. Moreover, using a luciferase assay we found that Chk1’s expression is controlled by p53 and RB/E2F1 at the transcriptional level. Additionally, we present preliminary data suggesting a posttranscriptional regulation mechanism, involving miR-195 and miR-503, which are inversely correlated with expression of Chk1 in radioresistant cells. In conclusion, Chk1/microRNA axis is involved in resistance to radiation in GC, and suggests Chk1 as a potential tool for optimal stratification of patients susceptible to receive adjuvant radiotherapy after surgery.
Gastric cancer (GC) is the fourth most common human malignant disease worldwide due to its frequency and high rate of mortality1,2. Classical adjuvant treatment in GC is based on MacDonald´s protocol including a com-bination of 5-Fluoruracil (5-FU) and radiation (IR) in stage IB-IVA patients. This regimen demonstrated an increase of progression free survival (PFS) and overall survival (OS)3,4. However, this combination is usually asso-ciated with increased, severe toxicity3. Thus, identification of those patients more prone to benefit from adjuvant radiation and 5-FU after curative surgery for GC to counteract such toxicity is an unmet need5,6.
Radiation and chemotherapy routinely used to treat cancer do cause a variety of DNA lesions, which in turn activate DNA damage response (DDR)7. Checkpoint Kinase 1 (Chk1), a key effector in DDR, is a multi-functional Ser/Thr kinase protein highly conserved through evolution8 and represents a crucial component in all cell cycle checkpoints. Chk1 activation must be finely regulated to ensure its adequate activity. The major known to date mechanism controlling Chk1 regulation is the phosphorylation of specific residues Ser317 and Ser345 (both in the C-terminal domain), which leads to catalytic activation. These reactions are catalyzed by ATR and ATM kinases7–9. Deregulation of Chk1 expression has been previously described in cancer, i.e. Chk1 is overexpressed7,10–12 and has been correlated with radiotherapy resistance in some cancer types such as ovarian
1Dpto.Bioquímica. Fac. Medicina. Instituto de Investigaciones Biomédicas Madrid CSIC-UAM; Madrid, Spain. 2The
Royal Veterinary College. University of London; London, UK. 3Medical Oncology Department, Infanta Sofía University
Hospital, San Sebastian de los Reyes, Madrid, 28702; Spain. 4IMDEA-Food Institute, CEI UAM+ CSIC, Madrid, Spain. 5Pathology Department, Infanta Sofía University Hospital, San Sebastián de los Reyes, 28702, Madrid. 6Unidad de
Medicina Molecular, laboratorio de Oncología, CRIB/FPCYT C-LM. Universidad de Castilla-La Mancha, Av. Almansa 14, 02006, Albacete, Spain. 7Unidad asociada de Biomedicina UCLM-CSIC, Arturo Duperier 4, Madrid Spain. 8CIBER
for Rare Diseases (CIBERER); Valencia, Spain. 9Biomarkers and Experimental Therapeutics Group; IdiPAZ; University
Hospital La Paz; Madrid, Spain. *These authors contributed equally to this work. Correspondence and requests for
materials should be addressed to I.S.-P. (email: [email protected] or [email protected]) Received: 08 September 2015
Accepted: 26 January 2016 Published: 12 February 2016
www.nature.com/scientificreports/
cancer13, nasopharyngeal carcinoma14 and lung cancer15. Accordingly, inhibition of Chk1 increases sensitivity to chemo-radiotherapy in multiple tumor models16,17. Given this apparent relationship between Chk1 expres-sion and resistance to certain therapies, some groups have made an effort to evaluate Chk1 as a novel target to improve cancer therapy18 in patients that have been previously exposed to ionizing agents. Besides the well known mechanisms regulating both activation and expression of Chk1 that have already been described10,19–23, Chk1 is also regulated at the post-transcriptional level by microRNAs (miRNAs)24,25 which are key regulators of tumor growth and response to chemotherapy26–28. In fact, some studies have already begun to identify miRNAs involved in sensitizing or causing resistance to chemotherapy, thus providing potential new targets and mechanisms as optimized treatment options29–31.
Previous studies from our laboratory suggested that Chk1 levels could be used as a predictive biomarker of therapeutic response in colon cancer32. Furthermore, we demostratred that E1A upregulates Chk1 and this correlates with glioblastoma radiosensitivity33. Here, we prove that Chk1 is overexpressed in a disseminated GC cell line, MKN45. We have shown that the inhibition of Chk1 results in increased IR sensitivity. Accordingly, we observed nuclear accumulation of Chk1, which correlates with a lower PFS period, in a cohort of patients treated with IR. The results we present here, suggest that Chk1 protein levels are controlled at the transcriptional level mainly through RB1/E2F1 and our preliminary data suggest that at the posttranscriptional level they are likely regulated by miRNA-195 and -503. We conclude that Chk1 is responsible for radiation resistance in GC, and suggest Chk1 as a potential biomarker for the optimal stratification of patients susceptible to receive adjuvant radiotherapy after surgery.
Results
Increased Chk1 expression correlates with resistance to genotoxic agents in GC cells.
We stud-ied the sensitivity of the two most common human gastric adenocarcinoma cell lines (AGS and MKN45) to anti-tumoral agents: cisplatin (CDDP), 5-FU, the radiomimetic agent Bleomycin (BLM) and IR. Dose response curves using this set of drugs showed that after 48 hours of treatment, MKN45 cells are more resistant than AGS cells to both BLM or IR treatment (Fig. 1A), with this increased resistance more evident after BLM treatment. To cor-roborate this result we conducted a clonogenic assay, and observed that the percentage of colony formation was higher on MKN45 cells than on AGS after 4 Gy irradiation (i.e: 89,6% vs 48.7% respectively) (Fig. 1B). Similarly, when treated with BLM, AGS cells were unable to form colonies at all (Supplementary Fig. 1A); Furthermore, we also observed morphological changes characteristic of cell death in irradiated AGS cells, which were com-pletely absent in MKN45 cells (Fig. 1B). To support this finding we irradiated cells with 4 and 8 Gy for 24 hours. We observed cleavage of PARP, and also a decrease in the full-length form of this protein in AGS cells in a dose dependent manner. However, in MKN45 we only observed basal levels of PARP with no change in proteolysis. Furthermore, the universal marker of apoptosis, activation of Caspase 3, is also observed in the AGS cell line, with particularly strong activity after 8Gy treatment (Fig. 1B).Given that Chk1 is one of the main effector proteins on the response to IR exposure, we examined the expres-sion levels of Chk1 in MKN45 and AGS cells by RT-QPCR and western blot (WB). Our results showed an increase on Chk1 mRNA and protein levels in both MKN45 and AGS cells when compared to normal tissue. Two differ-ent isoforms of Chk1 have been described34 and our WB analysis indicated that the more abundantly expressed isoform in MKN45 is the classic Chk1 with higher molecular weight (Fig. 1C). We confirmed this result by analyzing the expression of this gene, using public data available on Oncomine database (http//:oncomine.org) (Supplementary Fig. 1B). Our semi-quantitative PCR analysis confirmed the expression of both full-length and short forms of Chk1 in these two cell lines (Supplementary Fig. 1C). Altogether, these results suggest that elevated levels of Chk1 in GC cells correlate with a lack of apoptotic response to IR or BLM treatment.
expression and around a 60% reduction for MKN45 cells (Supplementary Fig. 2B). Taken together, the data pre-sented here suggest that Chk1 depletion results in enhanced sensitivity, lower survival rates following exposure to radiation, and altered G2/and intra-S checkpoint responses to DSBs induced damage.
Transcriptional regulation of Chk1 in GC cells.
To study whether high levels of Chk1 occur due to alter-ations at the transcriptional level, we cloned a fragment of Chk1 corresponding to the 5′ Flanking region of theFigure 1. CHK1 mRNA levels are high in GC cells resistant to radiation (IR) and bleomycin (BLM).
www.nature.com/scientificreports/
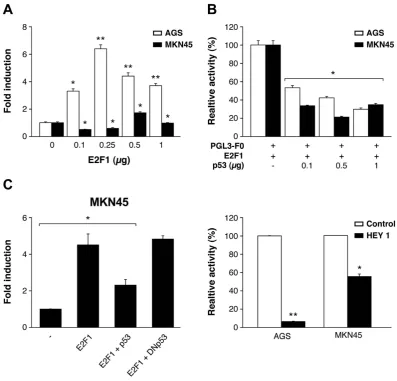
gene, (− 1823 − 284, as predicted by the Transfac tool) which contains the transcription factor (TF) and binds to CHK1’s promoter (Supplementary Fig. 3A), in the pGL3-Basic enhanced luciferase plasmid. We detected lucif-erase activity after transient transfection in AGS and MKN45 cells; this occurred in both cell lines in a DNA- dose dependent manner, confirming that the generated construct is functional (Supplementary Fig. 3B). First, we focused on p53 and E2F1. E2F1 expression in AGS cells reached a 6-fold increase over pGL3-F0; however, only a 2-fold increase was observed in MKN45 cells (Fig. 3A). Next, we analyzed if both E2F1 and p53 cooperate in modulating Chk1 expression in GC cells. We verified that both cells lines are p53 wild type37,38 and also performed a WB in order to evaluate the status of p53 in our specific experimental conditions, and our results indicated that p53 activation is equivalent in both cell lines. We found a transient activation of p53 4 h after IR (8 Gy) which returns to basal levels 24 hours after. We did not observe differences in p53 basal levels either (Supplementary Fig. 3C). To analyze the contribution of E2F1 and p53 in Chk1 expression, we performed an experiment in which cells were co-transfected with E2F1 (250 ng) and pGL3-F0 (200 ng) expression plasmids and increasing doses of the p53 (0–1 μ g) expression vector. Our results showed that p53 was able to inhibit the transcriptional activity induced by E2F1 expression in GC cells, in a dose-dependent manner (Fig. 3C). We also tested the Dominant Negative (DN) form of p53 that was indeed able to revert the p53-dependent down-regulation of Chk1 when co-transfected with E2F1 and pGL3-F0, which further supported the involvement of p53 in Chk1 promoter reg-ulation (Fig. 3D). To confirm that p53 regulates Chk1 promoter in vivo, cells were co-transfected with a plasmid
www.nature.com/scientificreports/
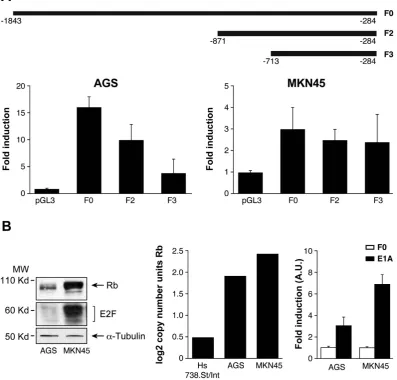
encoding the Hey1 protein, which is an activator of p5339 and pGL3-F0. Hey1 completely repressed the activity of Chk1 promoter after E2F1 expression in AGS cells and strongly inhibited it (50%) in MKN45 cells (Fig. 3D). To verify that these TFs control Chk1’s expression in AGS cells, we quantified Chk1’s mRNA levels under the above conditions. Our results suggest that E2F1 increases Chk1 expression and that activation of p53 reduces it (Supplementary Figure 3D). These results suggest that transcriptional regulation in these cells could be differ-entially modulated in GC adenocarcinoma through changes on E2F1 protein levels. The “in silico” analysis of the promoter sequence, revealed the presence of different E2F1 binding sites; therefore, we performed different deletions of the 5′ UTR (F2) and (F3), taking into account the putative TF binding sites for E2F. F2 and F3 are fragments that contain two and one E2F binding sites respectively (Fig. 4A). We found a drastic decrease in the transcriptional activation in AGS cells dependent on the number of E2F1 binding sites; however, no significant differences were observed in MKN45 cells. This suggests that the two E2F1 binding sites located in the area between − 1843 − 1201 pb (lost in F2 and F3) play a pivotal role in the induction of the promoter activity, espe-cially in the AGS cell line, which suggests that other mechanisms are involved in the regulation of CHK1 mRNA levels in MNK45 cells (Fig. 4A).
To further explore the mechanism involved in Chk1 expression by E2F1 and to gain insight into the differ-ences found in E2F1 regulation between these cell lines, we studied the basal expression of RB1 and E2F1 proteins
in each cell line. Our results indicate that levels of both RB1 and E2F1 are higher in MKN45 than in AGS cells (Fig. 4B). The expression of the RB gene through the Oncomine database (http//:oncomine.org), confirmed our finding of high levels of RB1 mRNA in MKN45 cells (Fig. 4B middle graph). We took advantage of the ability of adenovirus E1a protein to bind and block this tumor suppressor gene RB40,41. Transfection of a plasmid encoding the E1a protein in both cell lines, resulted in a clear increase on the activity of Chk1 promoter, which was more dramatic in MKN45 cells (Fig. 4B- right graph). These results indicate that the lack of transcriptional activation of Chk1 promoter in MKN45 cells and to a lower extent in AGS cells, could be due to effects exerted by the RB1 protein through binding to the TF E2F1.
The above results do not completely justify the high level of CHK1 messenger in MKN45 cells. Therefore, we investigated if the increase on CHK1 mRNA level in MKN45 cells is a result of post-transcriptional regulation. To investigate this possibility, we treated AGS and MKN45 cells with the transcriptional inhibitor Actinomycin D (Act D). CHK1 mRNA level was reduced 9 hours after Act D treatment in AGS cells (0,75-fold). However, in the MNK45 cell line, mRNA was accumulated at the same time (2,66-fold) (Supplementary Fig. 4A). These results suggest that CHK1 mRNA stability is regulated at post-transcriptional level in MKN45 cells.
Therefore, we decided to investigate the expression of microRNAs in samples from human GC cells in order to find miRNA candidates to regulate Chk1 expression. To this end, we analyzed the gene expression dataset GSE3007042, and found that the levels of microRNA predicted by the online software TARGETSCAN for CHK1 were significantly different between cancer and control samples (Supplementary Fig. 4B). From the predicted miRNAs that target CHK1, we investigated the potential role of miR-195 and miR-503 in the regulation of the stability of CHK1 mRNA. miR-195 belongs to the big miR-15 microRNA family. This family has been recently described as radiosensitivity enhancer on breast cancer by targeting CHK143 and miR-503 has been previously shown to target CHK144,45. We then used real-time PCR to detect the expression of miR-195/503 in AGS and MKN45 cell lines. Our results showed that miR-195 and -503 levels were significantly lower (P≤ 0.05) in MKN45 cells than in AGS cells (Supplementary Fig. 4B). Taken together, these data suggest an involvement of miR-195 and -503 in the upregulation of CHK1 mRNA in MKN45 cells.
Prognostic Relevance of Chk1 Expression in gastric tumors.
To assess the clinical significance of these findings, we studied the levels of Chk1 protein in a small cohort of patients. The samples were selected from patients that had received adjuvant therapy (Radiotherapy plus 5-FU) after surgery. The overall features of all 23 patients are summarized in Table 1. No significant association between Chk1 levels and age, sex, stage of the tumor, Lauren and Her2+ expression or PFS was observed in patients with GC (p > 0,05). However, our analy-sis detected 6 cases with positive Chk1 nuclear staining versus 14 cases that did not show any staining for Chk1 (Fig. 5A). Interestingly, we observed that patients with nuclear Chk1 accumulation tended to have shorter PFS than those with negative nuclear Chk1 staining (17,67 months vs 25,21 months; p = 0.059). The Kaplan-Meyer curve showed early differences in PFS between both populations (Fig. 5B). Altogether these results suggest thatGC Characteristic
CHK1 Low CHK1 High
n* (%) (%) X2 P
SEX
Male 19 68,5 31,5 1.709 0.539 Female 4 100 0
AGE (mean) 63,3 74 0.389 STAGE
I 3 100 0 2.841 0.417 II 7 57,1 42,9
III 6 83,3 16,7 IV 1 100 0 LAUREN
Intestinal 8 87,5 12,5 0.410 0.522 Difusse 8 75 25
HER2/erb-b2
Positive 2 50 50 0.647 0.421 Negative 17 70 30
PFS (Months)
≤ 18 5 40 60 4.752 0.063
> 18 11 90 10
Table 1. The association of Chk1 nuclear expression with the clinicopathological characteristics of Gastric Cancer patients. Results from a total of 23 patient samples. Correlation between clinicopathological characteristics and Chk1 nuclear expression was assessed by Chi2 or Fisher exact test and t-test to compare the
www.nature.com/scientificreports/
Chk1 can be considered as a putative biomarker for radiotherapy response in GC patients, since Chk1 protein level correlates with poor clinical outcome in human GC.
Discussion
Combining chemotherapy with radiation improves outcome in GC, but this strategy comes with the price of an increased toxicity rate and furthermore, many of these tumors are resistant to radiation. To overcome this obsta-cle, it is crucial to identify the key determinants of radioresistance, since this will enable us to develop safer and more effective tumor radiosensitizers.
We have previously reported that CDDP-resistance in colorectal cancer cells correlates with high Chk1 lev-els32. Here, we have demonstrated a relationship between Chk1 expression and IR resistance in GC. Our results indicate that in GC cell lines, Chk1 is upregulated and specifically modulates sensitivity to radiation. This upreg-ulation correlates with poor clinical prognosis in our patient cohort and can be explained by acquired resistance to IR. Taking into account that GC is generally diagnosed at advanced stages, it is difficult to recruit a large cohort of patients meeting our inclusion criteria (gastrectomy plus adjuvant therapy based on 5-FU plus IR). However, it is necessary now to reproduce our results in a larger cohort of patients, to confirm the implication of Chk1 on therapy response and also to clarify other clinical and pathological outcomes. Our data indicate that inhibition of Chk1 activity due to treatment with UCN-01, increases sensitivity to both BLM and IR. This evidence points to Chk1 as a good target in GC treatment. Unfortunately, clinical development of UCN-01 has been halted due to unfavorable pharmacology46. However, other inhibitors have been tested such as AZD7762 (a potent and selective ATP-competitive Chk1 kinase inhibitor), which has shown strong chemosensitizing activity when used alongside DNA-damaging agents. This has been evaluated both in in vitro and in vivo model systems47. Increasing evidence indicates that Chk1 inhibitors are able to synergize with antitumoral drugs in an specific molecular context, such as tumors with defects in the DNA damage repair pathway, or those overexpressing specific oncogenes48.
According with data from the literature, transcriptional regulation of Chk1 is controlled through p53 and E2F149,50. In our experimental model radioresistance of MKN45 cells is not dependent on p53, since in both cell lines used in our study, p53 is wild type37. We corroborated that p53 is equally activated and follows the same kinetics in both cell lines after IR treatment. Our luciferase assays demonstrated that p53 regulates negatively the transcriptional activation of Chk1; moreover, we also confirmed that overexpression of p53 by transfection, leads to downregulation of Chk1 mRNA in vitro.
We cloned the Chk1 promoter region which contains different E2F binding sites50. The RB1-E2F1 pathway is crucial for the regulation of cell cycle progression and tumorigenesis. RB1 is a tumor suppressor gene frequently mutated or deleted in cancer, however in GC it is also amplified in an important percentage of samples51. Our results support a definitive role of RB1-E2F1 in the regulation of Chk1 transcription in GC. We suggest that in basal conditions E2F1 is sequestered by RB1, which is then unable to induce the expression of Chk1. This hypoth-esis is supported by our experiment with E1A oncoprotein, which binds and inhibits RB family members by disrupting E2F-RB1 interactions52, thus increasing Chk1 promoter activity, especially in MKN45 cells with higher levels of RB1. In addition, in response to E2F1 overexpression these cells are unable to increase Chk1’s mRNA.
Several studies have shown that both miR-15 and miR-497 families modulate multidrug resistance in GC cells by targeting BCl-253–56. Furthermore, this family of miRNA controls Chk1 protein levels. For instance, over-expression of the miR-15a/b and miR-16 family affects the radiosensititivity of human breast cancer by regulat-ing Chk1 and Wee1 proteins43. On the contrary, it has been shown that downregulation of the miR-15 family
Figure 5. Nuclear Chk1 protein levels correlate with poor clinical outcome in human gastric cancer.
regulates CDDP sensitivity by increasing Chk1 levels44. Other studies have demonstrated that dowregulation of miR-424 contributes to cervical cancer progression via upregulation of its target gene Chk111. Along these lines, our results show a significant downregulation of miR-195 and miR-503 expression in MKN45 radioresistant cells. Accordingly, NSCLC (non small cell lung carcinoma) shows lower miR-195 expression in the tumor than in adjacent tissues, and this lower expression has been associated with poorer overall survival57. However, in addition to our preliminary results, more experiments are needed to specifically confirm the impact of this fam-ily of microRNAs on Chk1’s expression and to define its influence on radioresistance. Nonetheless, the inverse correlation between microRNAs and Chk1 would be a promising parameter to consider in the clinical setting. In this regard, recent evidence confirms our findings in lung cancer57 which supports the universal character of our observations. However, other putative targets of those microRNA should be taken into account, and also their relationship with E2F1-RB58, in order to describe a possible feedback loop that could be regulating each member. In summary, in this study we demonstrate that gastric tumors can be stratified into radiation resistant or sensitive, according to the status of Chk1. Chk1 protein levels could be modified by pRB-E2F1, p53 or miRNAs that seem to regulate its expression Thus, the miR-195/Chk1 axis may be used as a new biomarker tool to pre-dict individual response to adjuvant radiotherapy. We previously described the possibility to sensitize advanced tumoral gastric cancer cells by adjuvant chemotherapy based on paclitaxel and cisplatin59, as an alternative to non-resecable tumors. The data presented here could mark a step forward allowing the design of improved ther-apeutic interventions for GC patients.
Materials and Methods
Cell lines.
AGS and MKN45 human gastric adenocarcinoma cell lines were cultured in F12-Kaings and RPMI mediums respectively (Gibco), and supplemented with FBS (10% for AGS and 20% for MKN45). Cultures were maintained at 37 °C, 5% CO2 and 95% humidity. AGS and MKN45 are wild type for TP5337,38.Cloning.
Genomic DNA was extracted from the colorectal cancer cell line HCT116 and the required sequence (− 1823 –284) was cloned into a pGL3-enhanced luciferase plasmid vector. See Supplementary M&M for details.PCR.
Total RNA was extracted using Tri-Reagent (Life technologies). Gene expression levels were assessed by Q-PCR, by using SYBR green-based chemistries for amplicon detection. For relative quantification (RQ) we used the delta-Ct method. Statistical analyses was performed for each gene by using a paired t-test to compare mean values, where p < 0.05 was considered significant.Reagents and Plasmid Vectors.
Cisplatin, 5-Fluorouracile, Actinomycin D and UCN-01 were pur-chased from Sigma Aldrich. BLM was purpur-chased from Calbiochem. pGL3 Basic and pGEMT easy (Promega), pSG5-HEY1, and pSG5 (Dr. B. Belandia), pCMV-E2F1 (Dra. A. Zubiaga), pcdna-p53DN (Dr. I Palmero), PCEFL-E1A, PEF1-p53 wt and pEF1 Dn (Dr. Sanchez-Prieto).Luciferase activity assay.
Constructs carrying the luciferase gene were cotransfected with 1 ng of Renilla (transfecting control, 1:100) using lipofectamine 2000 (Invitrogen) in 24 well plates following the Manufacter’s instructions. 24 hours after transfection, transcriptional activity was quantified using the Dual-Luciferase®
Reporter (DLR™
) Assay System (Promega) using a Promega luminometer.Cell viability Clonogenic assay.
Viability was determined using a MTS (Promega) staining method, as described60. To assess the effects of irradiation, cells were irradiated with different doses of Gy (0–8 Gy) using a 137Cs source (mark 1, model 30, JL. Shepherd & Associates San Fernando CA; Dose rate to 100 mm diameter sam-ples is ~370 R/minute). 15 days after treatment, colonies containing more than 50 individual cells were counted using a microscope and survival fractions were quantified as described61.IC50 and Combination Index (CI).
IC50 were calculated by using the GraphPad Prism program. We used nonlinear regression to fit the data to the log (inhibitor) vs response (variable slope) curve.Effects of BLM and UCN-01 combination on growth inhibition were analyzed by the Combination Index (CI) equation developed by Chou-Talalay35,62 using the CalcuSyn program (Biosoft, Cambridge, UK). The general equation for the classic isobologram is given by: CI = (D)1/(Dx)1 + (D)2/(Dx)2 where CI < 1 indicates syner-gism; CI = 1 indicates additive effect, and CI > 1 indicates antagonism; (Dx)1 and (Dx)2 in the denominators are the doses (or concentrations) of D1 (drug #1, for example, BLM) and D2 (drug #2, for example, UCN-01) alone that gives x% inhibition, whereas (D)1 and (D)2 in the numerators are the doses of D1 and D2 in combination that also inhibits x% The (Dx)1 and (Dx)2 can be readily calculated from the median-effect equation of Chou Dx = Dm[fa/(1-fa)]1/m where Dx is the median-effect dose, fa is the fraction affected, Dm is the median-effect dose signifying potency and m is the kinetic order signifying the shape of dose-effect curve.
Western blotting.
Twenty μ g of protein per sample were loaded in SDS-PAGE in 10% (for E2F1,Chk1 and p53) or 8% (for Rb or PARP-1) polyacrylamide gels, and then transferred onto nitrocellulose membranes. Antibody dilutions were as follows: Chk1- 1:500 (sc-377231), E2F1- 1:1000 (sc-193), Rb- 1:200 (sc-102), PARP-1- 1:1000 (H-300: sc-25780), Cleaved Caspase-3 (Asp175) Antibody #9661 1:1000, p53 Antibody #9282 1:1000 (Cell signaling) in 5% fat free milk 0’05% TTBS. HA Antibody- 1:2000 ( Boehringer mannheim), Flag antibody- 1:2000 ( Sigma)Cell cycle analysis.
Cell cycle analysis was performed as previously described59. Supplementary M&M forwww.nature.com/scientificreports/
Viral transduction of target cells.
Viral particles for infection were generated according to manufacturing instructions using GIPZ Lentiviral shRNA for CHK1 (Thermo Scientific Open Biosystems). See Supplementary M&M for details.miRNA analysis.
RNA was purified from cultured cells using mirVana™
miRNA Isolation Kit (Ambion; Life Technologies). RT: TaqMan®
MicroRNA Reverse Transcription Kit and TaqMan microRNA specific assays (Catalog #: 4427975 ID: 00104; ID: 000494: ID: 001973) were used to perform the RT and quantitative PCR (RT-qPCR) of triplicate samples. Real-time PCR was performed on an Applied Biosystems Step-one plus PCR (Life Technologies) following the manufacturer’s instructions. Total RNA input was normalized using RNU6B RNA as an endogenous control.Gene expression profile analysis.
The miRNA expression data in a large set of GC patient samples42 was downloaded from the Gene Expression Omnibus (GEO, http://www.ncbi.nlm.nih.gov/geo/) and analyzed using custom R scripts for statistical programming http://www.r-project.org/“. Briefly, we compared probe values in each sample group (“normal”, “pretreatment”, “post-treatment”) using a Student’s t-test and the resulting p-values were adjusted for multiple testing by the Bonferroni method.Patients and tumor samples.
Patients (n = 23) were recruited from the Oncology Department at the Infanta Sofía´s Hospital between 2008 and 2015. We selected those patients diagnosed with GC, who underwent radical surgery and received adjuvant therapy according to the MacDonald´s treatment guidelines (5-FU and radiation). The specimens were collected during tumor resection. Tissue samples were histologically confirmed as tumoral or non-tumoral tissues, and were stored at − 80 °C until analysis. This study was approved by the Clinical Research Ethics Committee “IMDEA alimentacion” (code IMD: PI-010). All procedures were carried out in accordance with the approved guidelines and after informed consent was obtained from all subjects included in the study.Immunohistochemical analysis.
Immunohistochemistry was performed in 3-μ m sections of paraffin-embedded tissues. Samples were deparaffinized and rehydrated in water, after which antigen retrieval was carried out by incubation in EDTA solution. Endogenous peroxidase and non-specific antibody reactivity were blocked with peroxidase blocking reagent (Dako). The sections were then incubated with the Rabbit Monoclonal Antibody against Chk1 (TA300658. Origene Technologies). Detection was carried out by using Envision Plus Detection System (Dako). Negative controls were performed by replacing the primary antibody with goat serum. The slides were finally mounted with DPX mountant for microscopy (VWR Int). Immunohistochemical analysis was performed by the Pathology department’s staff at the same Hospital and the interpretation by a blinded expert pathologist. Chk1 nuclear staining was assessed as a percentage of surface showing positive signal, relative to the percentage of stained cells in the sample per surface area. A semi-quantitative score was assigned, as follows: 0: ≤ 10%; 1: 10–25%; 2: 25–50%; 3: ≥ 50%. Positive staining was therefore considered 1, 2 or 3.References
1. Torre, L. A. et al. Global cancer statistics, 2012. CA Cancer J Clin65, 87–108 (2015). 2. Siegel, R. L., Miller, K. D. & Jemal, A. Cancer statistics, 2015. CA Cancer J Clin65, 5–29 (2015).
3. Macdonald, J. S. et al. Chemoradiotherapy after surgery compared with surgery alone for adenocarcinoma of the stomach or gastroesophageal junction. N Engl J Med345, 725–30 (2001).
4. Toiyama, Y. et al. Administration sequence-dependent antitumor effects of paclitaxel and 5-fluorouracil in the human gastric cancer cell line MKN45. Cancer Chemother Pharmacol57, 368–75 (2006).
5. Wagner, A. D. et al. Chemotherapy for advanced gastric cancer. Cochrane Database Syst Rev, doi: 10.1002/14651858.CD004064.pub3 (2010).
6. Viudez-Berral, A. et al. Current management of gastric cancer. Rev Esp Enferm Dig104, 134–41 (2012).
7. Dai, Y. & Grant, S. New insights into checkpoint kinase 1 in the DNA damage response signaling network. Clin Cancer Res16,
376–83 (2010).
8. Tapia-Alveal, C., Calonge, T. M. & O’Connell, M. J. Regulation of chk1. Cell Div4, 8 (2009).
9. Smits, V. A. & Gillespie, D. A. DNA damage control: regulation and functions of checkpoint kinase 1. FEBS J282, 3681–92 (2015). 10. Verlinden, L. et al. The E2F-regulated gene Chk1 is highly expressed in triple-negative estrogen receptor/progesterone receptor/
HER-2 breast carcinomas. Cancer Res67, 6574–81 (2007).
11. Xu, J. et al. Suppressed miR-424 expression via upregulation of target gene Chk1 contributes to the progression of cervical cancer.
Oncogene32, 976–87 (2013).
12. Cole, K. A. et al. RNAi screen of the protein kinome identifies checkpoint kinase 1 (CHK1) as a therapeutic target in neuroblastoma.
Proc Natl Acad Sci USA108, 3336–41 (2011).
13. Liao, Q. et al. A preliminary study on the radiation-resistance mechanism in ovarian cancer. J Cancer Res Ther9, 22–4 (2013). 14. Wang, W. J. et al. MYC regulation of CHK1 and CHK2 promotes radioresistance in a stem cell-like population of nasopharyngeal
carcinoma cells. Cancer Res73, 1219–31 (2013).
15. Yang, H. et al. Inhibition of checkpoint kinase 1 sensitizes lung cancer brain metastases to radiotherapy. Biochem Biophys Res
Commun406, 53–8 (2011).
16. Morgan, M. A. et al. Mechanism of radiosensitization by the Chk1/2 inhibitor AZD7762 involves abrogation of the G2 checkpoint and inhibition of homologous recombinational DNA repair. Cancer Res70, 4972–81 (2010).
17. Parsels, L. A. et al. Gemcitabine sensitization by checkpoint kinase 1 inhibition correlates with inhibition of a Rad51 DNA damage response in pancreatic cancer cells. Mol Cancer Ther8, 45–54 (2009).
18. McNeely, S., Beckmann, R. & Bence Lin, A. K. CHEK again: revisiting the development of CHK1 inhibitors for cancer therapy.
Pharmacol Ther142, 1–10 (2014).
19. Xu, N. et al. Cdk-mediated phosphorylation of Chk1 is required for efficient activation and full checkpoint proficiency in response to DNA damage. Oncogene31, 1086–94 (2012).
20. Enomoto, M. et al. Novel positive feedback loop between Cdk1 and Chk1 in the nucleus during G2/M transition. J Biol Chem284,
34223–30 (2009).
22. Zhou, J. et al. A kinome screen identifies checkpoint kinase 1 (CHK1) as a sensitizer for RRM1-dependent gemcitabine efficacy.
PLoS One8, e58091 (2013).
23. Yao, H., Yang, Z. & Li, Y. [Expression of checkpoint kinase 1 and polo-like kinase 1 and its clinicopathological significance in benign and malignant lesions of the stomach]. Zhong Nan Da Xue Xue Bao Yi Xue Ban35, 1080–4 (2010).
24. Bartel, D. P. & Chen, C. Z. Micromanagers of gene expression: the potentially widespread influence of metazoan microRNAs. Nat Rev Genet5, 396–400 (2004).
25. Xie, Y. et al. Checkpoint kinase 1 is negatively regulated by miR-497 in hepatocellular carcinoma. Med Oncol31, 844 (2014). 26. Croce, C. M. Causes and consequences of microRNA dysregulation in cancer. Nat Rev Genet10, 704–14 (2009).
27. Bushati, N. & Cohen, S. M. microRNA functions. Annu Rev Cell Dev Biol23, 175–205 (2007). 28. Garzon, R., Calin, G. A. & Croce, C. M. MicroRNAs in Cancer. Annu Rev Med60, 167–79 (2009).
29. Cimmino, A. et al. miR-15 and miR-16 induce apoptosis by targeting BCL2. Proc Natl Acad Sci USA102, 13944–9 (2005). 30. Cittelly, D. M. et al. Downregulation of miR-342 is associated with tamoxifen resistant breast tumors. Mol Cancer9, 317 (2010). 31. Ma, J., Dong, C. & Ji, C. MicroRNA and drug resistance. Cancer Gene Ther17, 523–31 (2010).
32. Peralta-Sastre, A. et al. Checkpoint kinase 1 modulates sensitivity to cisplatin after spindle checkpoint activation in SW620 cells. Int J Biochem Cell Biol42, 318–28 (2010).
33. Valero, M. L. et al. E1a promotes c-Myc-dependent replicative stress: implications in glioblastoma radiosensitization. Cell Cycle13,
52–61 (2014).
34. Pabla, N., Bhatt, K. & Dong, Z. Checkpoint kinase 1 (Chk1)-short is a splice variant and endogenous inhibitor of Chk1 that regulates cell cycle and DNA damage checkpoints. Proc Natl Acad Sci USA109, 197–202 (2012).
35. Chou, T. C. & Talalay, P. Quantitative analysis of dose-effect relationships: the combined effects of multiple drugs or enzyme inhibitors. Adv Enzyme Regul22, 27–55 (1984).
36. Clarke, C. A. & Clarke, P. R. DNA-dependent phosphorylation of Chk1 and Claspin in a human cell-free system. Biochem J388,
705–12 (2005).
37. Nabeya, Y. et al. The mutational status of p53 protein in gastric and esophageal adenocarcinoma cell lines predicts sensitivity to chemotherapeutic agents. Int J Cancer64, 37–46 (1995).
38. Fan, X. M. et al. Inhibition of proteasome function induced apoptosis in gastric cancer. Int J Cancer93, 481–8 (2001).
39. Villaronga, M. A., Lavery, D. N., Bevan, C. L., Llanos, S. & Belandia, B. HEY1 Leu94Met gene polymorphism dramatically modifies its biological functions. Oncogene29, 411–20 (2010).
40. Liu, X. & Marmorstein, R. Structure of the retinoblastoma protein bound to adenovirus E1A reveals the molecular basis for viral oncoprotein inactivation of a tumor suppressor. Genes Dev21, 2711–6 (2007).
41. Chellappan, S. P., Hiebert, S., Mudryj, M., Horowitz, J. M. & Nevins, J. R. The E2F transcription factor is a cellular target for the RB protein. Cell65, 1053–61 (1991).
42. Kim, C. H. et al. miRNA signature associated with outcome of gastric cancer patients following chemotherapy. BMC Med Genomics 4, 79 (2011).
43. Mei, Z. et al. The miR-15 Family Enhances the Radiosensitivity of Breast Cancer Cells by Targeting G2 Checkpoints. Radiat Res183,
196–207 (2015).
44. Pouliot, L. M. et al. Cisplatin sensitivity mediated by WEE1 and CHK1 is mediated by miR-155 and the miR-15 family. Cancer Res 72, 5945–55 (2012).
45. Pouliot, L. M., Shen, D. W., Suzuki, T., Hall, M. D. & Gottesman, M. M. Contributions of microRNA dysregulation to cisplatin resistance in adenocarcinoma cells. Exp Cell Res319, 566–74 (2013).
46. Sausville, E. A. et al. Phase I trial of 72-hour continuous infusion UCN-01 in patients with refractory neoplasms. J Clin Oncol19,
2319–33 (2001).
47. Mitchell, J. B. et al.In vitro and in vivo radiation sensitization of human tumor cells by a novel checkpoint kinase inhibitor, AZD7762.
Clin Cancer Res16, 2076–84 (2010).
48. Maugeri-Sacca, M., Bartucci, M. & De Maria, R. Checkpoint kinase 1 inhibitors for potentiating systemic anticancer therapy. Cancer Treat Rev39, 525–33 (2013).
49. Gottifredi, V., Karni-Schmidt, O., Shieh, S. S. & Prives, C. p53 down-regulates CHK1 through p21 and the retinoblastoma protein.
Mol Cell Biol21, 1066–76 (2001).
50. Carrassa, L., Broggini, M., Vikhanskaya, F. & Damia, G. Characterization of the 5’flanking region of the human Chk1 gene: identification of E2F1 functional sites. Cell Cycle2, 604–9 (2003).
51. Cancer Genome Atlas Research, N. Comprehensive molecular characterization of gastric adenocarcinoma. Nature513, 202–9 (2014).
52. Chellappan, S. et al. Adenovirus E1A, simian virus 40 tumor antigen, and human papillomavirus E7 protein share the capacity to disrupt the interaction between transcription factor E2F and the retinoblastoma gene product. Proc Natl Acad Sci USA89, 4549–53 (1992).
53. Xia, L. et al. miR-15b and miR-16 modulate multidrug resistance by targeting BCL2 in human gastric cancer cells. Int J Cancer123,
372–9 (2008).
54. Zhu, W., Shan, X., Wang, T., Shu, Y. & Liu, P. miR-181b modulates multidrug resistance by targeting BCL2 in human cancer cell lines. Int J Cancer127, 2520–9 (2010).
55. Zhu, W. et al. miR-200bc/429 cluster modulates multidrug resistance of human cancer cell lines by targeting BCL2 and XIAP. Cancer
Chemother Pharmacol69, 723–31 (2012).
56. Zhu, W. et al. miR-497 modulates multidrug resistance of human cancer cell lines by targeting BCL2. Med Oncol29, 384–91 (2012). 57. Liu, B. et al. MiR-195 suppresses non-small cell lung cancer by targeting CHEK1. Oncotarget6, 9445–56 (2015).
58. Mao, A. et al. miR-449a enhances radiosensitivity through modulating pRb/E2F1 in prostate cancer cells. Tumour Biol doi: 10.1007/ s13277-015-4336-8 (2015).
59. Bargiela-Iparraguirre, J. et al. Mad2 and BubR1 modulates tumourigenesis and paclitaxel response in MKN45 gastric cancer cells.
Cell Cycle13, 3590–601 (2014).
60. Gutierrez-Gonzalez, A. et al. Targeting Chk2 improves gastric cancer chemotherapy by impairing DNA damage repair. Apoptosis18,
347–60 (2013).
61. Rafehi, H. et al. Clonogenic assay: adherent cells. J Vis Exp (2011).
62. Ling, X. et al. Synergistic effect of allyl isothiocyanate (AITC) on cisplatin efficacy in vitro and in vivo. Am J Cancer Res5, 2516–30 (2015).
Acknowledgements
www.nature.com/scientificreports/
to Javier Pérez (photography facility), Diego Navarro and Lucia Sanchez (microscopy facility IIBM) for their technical assistance. JBI was supported by a fellowship from Catedra Isaac Costero, funded by Banco Santander-UAM and is a doctoral student from a double doctorate program in Molecular Biosciences (Santander-UAM) and in Biomedical Sciences, (UNAM) and received fellowship CVU:607546 from CONACYT.
Author Contributions
B.-I.J., P.-M.L. and G.-G.A. made the experiments and prepared the figures. M.-R.J., M.-F.M. and S.M. developed the clinical protocol and human sample recruitment. F.-F.M., S.-P.R. and P.R. discuss the results and proof reading of the manuscript. I. S.-P. design and wrote the main manuscript. All authors reviewed the manuscript.
Additional Information
Supplementary information accompanies this paper at http://www.nature.com/srep
Competing financial interests: The authors declare no competing financial interests.