TESIS DOCTORAL
PREDICTION-BASED
TECHNIQUES FOR THE
OPTIMIZATION OF
MOBILE
NETWORKS
Autor: Nicola Bui, University Carlos III of Madrid IMDEA Networks Institute Director: Joerg Widmer, IMDEA Networks Institute
DEPARTAMENTO DE INGENIER´IA TELEM ´ATICA
PH.D. THESIS
PREDICTION-BASED
TECHNIQUES FOR THE
OPTIMIZATION OF
MOBILE
NETWORKS
Author: Nicola Bui, University Carlos III of Madrid IMDEA Networks Institute Director: Joerg Widmer, IMDEA Networks Institute
DEPARTMENT OF TELEMATIC ENGINEERING
A dissertation submitted in partial fulfillment of the requirements for the degree of Doctor of Philosophy
Prepared by
Nicola Bui, University Carlos III of Madrid IMDEA Networks Institute
Under the advice of
Joerg Widmer, IMDEA Networks Institute
Departamento de Ingenier´ıa Telem´atica, Universidad Carlos III de Madrid
Date: Mayo, 2017
Web/contact: [email protected]
PREDICTION-BASEDTECHNIQUES FOR THEOPTIMIZATION OFMOBILENETWORKS
Autor: Nicola Bui, University Carlos III of Madrid IMDEA Networks Institute Director: Joerg Widmer, IMDEA Networks Institute
Firma del tribunal calificador:
Presidente: Prof. Albert Banchs Roca
Vocal: Prof. Guevara Noubir
Secretario: Dr. Lorenza Giupponi
Calificaci´on:
My first and foremost thank goes to my advisor, Joerg Widmer, who has always been there when I needed the most and always believed in me even and in particular when I doubted myself. For this and for his ability to seamlessly alternate between opposite roles such as the rigorous reviewer and the helpful collaborator, I cannot think of a better guide for a PhD student.
My second thought goes to my PhD fellows and colleagues at IMDEA Networks, who never failed to help when I need assistance and was always present to share a coffee along with some very insightful or simpler light-hearted chats.
My last thank goes to my family and my wife, Claudia Boccato, above all. She has been my safe heaven where to return after the bad days and was always there to celebrate my, modest, successes.
Mobile cellular networks are complex system whose behavior is characterized by the superpo-sition of several random phenomena, most of which, related to human activities, such as mobility, communications and network usage. However, when observed in their totality, the many indi-vidual components merge into more deterministic patterns and trends start to be identifiable and predictable.
In this thesis we analyze a recent branch of network optimization that is commonly referred to as anticipatory networking and that entails the combination of prediction solutions and network optimization schemes. The main intuition behind anticipatory networking is that knowing in advance what is going on in the network can help understanding potentially severe problems and mitigate their impact by applying solution when they are still in their initial states. Conversely, network forecast might also indicate a future improvement in the overall network condition (i.e. load reduction or better signal quality reported from users). In such a case, resources can be assigned more sparingly requiring users to rely on buffered information while waiting for the better condition when it will be more convenient to grant more resources.
In the beginning of this thesis we will survey the current anticipatory networking panorama and the many prediction and optimization solutions proposed so far. In the main body of the work, we will propose our novel solutions to the problem, the tools and methodologies we designed to evaluate them and to perform a real world evaluation of our schemes.
By the end of this work it will be clear that not only is anticipatory networking a very promis-ing theoretical framework, but also that it is feasible and it can deliver substantial benefit to current and next generation mobile networks. In fact, with both our theoretical and practical results we show evidences that more than one third of the resources can be saved and even larger gain can be achieved for data rate enhancements.
Acknowledgements IX
Abstract XI
List of Tables XVII
List of Figures XXIII
List of Acronyms XXV
Part I : Introduction 1
1. Summary 3
1.1. Contributions . . . 6
2. Survey of Anticipatory Networking Solutions for Mobile Networks 9 2.1. Context-Based Classification . . . 12
2.1.1. Geographic Context . . . 12
2.1.2. Link Context . . . 17
2.1.3. Traffic Context . . . 23
2.1.4. Social Context . . . 25
2.1.5. Summary . . . 31
2.2. Prediction Methodologies for Anticipatory Networking . . . 32
2.2.1. Time Series Predictive Modeling . . . 32
2.2.2. Similarity-based Classification . . . 34
2.2.3. Regression Analysis . . . 36
2.2.4. Statistical Methods for Probabilistic Forecasting . . . 38
2.2.5. Summary . . . 40
2.3. Optimization Techniques for Anticipatory Networking . . . 43
2.3.1. Convex Optimization . . . 43
2.3.2. Model Predictive Control . . . 45
2.3.3. Markov Decision Process . . . 46
2.3.4. Game theoretic approaches . . . 47
2.3.5. Summary . . . 49
2.4. Issues, Challenges, and Research Directions . . . 49
2.4.1. Context related analyses . . . 50
2.4.2. Anticipation-enabled use cases . . . 52
2.4.3. Open challenges . . . 53
3. Throughput Prediction for Mobile Network Users 57 3.1. Taxonomy of Predictors . . . 57
3.1.1. Mobility Predictors . . . 58
3.1.2. Bandwidth Predictors . . . 59
3.2. Bandwidth Availability Model . . . 60
3.3. Results . . . 63
4. Modeling Throughput Prediction Errors as Gaussian Random Walks 67 4.1. System model . . . 68
4.2. Prediction error model . . . 69
Part II : Resource Allocation Optimization in Mobile Networks 73 5. Resource Optimization under Imperfect Prediction 77 5.1. Related work . . . 77
5.2. System model . . . 78
5.3. Resource allocation optimization with perfect forecast . . . 80
5.4. General forecast model . . . 83
5.4.1. Short term forecast with filters . . . 83
5.4.2. Statistical models and uncertainties . . . 84
5.5. Resource allocation optimization under uncertainties . . . 86
5.6. Results . . . 90
6. Anticipatory Quality-Resource Allocation 97 6.1. Problem definition . . . 98
6.2. Resource Allocation Algorithm . . . 100
6.3. Simulation Results . . . 106
7. Anticipatory Admission Control 111 7.1. Related work . . . 112
7.2. Problem Definition . . . 113
7.4. Simulation Results . . . 121
Part III : Tools and Practical Challenges 127 8. Online Watcher for LTE 131 8.1. Related work . . . 132
8.2. Control Channel Decoding . . . 132
8.3. Online Watcher for LTE (OWL) Architecture . . . 135
8.3.1. Synchronized signal recorder . . . 135
8.3.2. Control channel decoder . . . 135
8.3.3. Fine-tuner . . . 136
8.3.4. Pipeline . . . 137
8.3.5. Verifier . . . 137
8.3.6. OWL release details . . . 137
8.4. Results . . . 138
9. Fine-grained LTE Radio Link Estimation for Mobile Phones 141 9.1. Related work . . . 142
9.2. Setup and Definitions . . . 143
9.3. Burst Transmissions . . . 145
9.3.1. Experiment Description . . . 145
9.3.2. Experiment Results . . . 146
9.4. Isolated Transmissions . . . 152
9.4.1. Experiment Description . . . 152
9.4.2. Experiment Results . . . 153
9.5. Summary . . . 155
Part IV : Practical Evaluation and Conclusions 157 10. Data-driven Evaluation 161 10.1. Related work . . . 162
10.2. Anticipatory Optimization Framework . . . 163
10.2.1. Optimization Problem . . . 163
10.2.2. Prediction Methodology . . . 165
10.2.3. Evaluation Framework . . . 167
10.3. LTE Measurements . . . 169
10.3.1. Campaign description . . . 170
10.3.2. Dataset Analysis . . . 173
11. Conclusions 183
Appendices 187
A. Lightweight Mobile Bandwidth Availability Measurement 189
A.1. Related Work . . . 189
A.2. Mobile Capacity Estimation . . . 190
A.2.1. Capacity Estimation Samples . . . 192
A.2.2. Statistical Processing Of The Samples . . . 194
A.2.3. Capacity Measurement . . . 194
A.3. Simulation Campaign . . . 196
A.4. Measurement Campaign . . . 198
A.5. Results and Discussion . . . 198
2.1. Survey classification and structure . . . 11
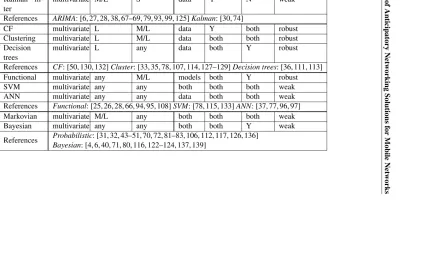
2.2. Context Classification Summary: each context is associated to its most popular applications, prediction techniques, optimization methods and main notable char-acteristics. . . 30
2.3. Selected Prediction Methods: Variables of interest and constraints of modeling. . 42
2.4. Optimization Methods Summary . . . 48
3.1. Prediction Taxonomy . . . 58
3.2. MCS coefficients . . . 60
10.1. Dataset Statistics . . . 170
A.1. Simulation parameters . . . 197
A.2. AverageCU and average optimaltT per technology. . . 201
2.1. Geographic context example: an example of estimated trajectories of 6 mobile users. . . 13 2.2. Link context example: a pathloss map of Berlin downtown obtained from the data
of the MOMENTUM project, where the triangles represent base stations. Pathloss maps are frequently used to predict the evolution of the connection quality in mobile networks. . . 19 2.3. Example of time series: Traffic load (aggregated every 15 minutes) for a week in
March 2015 in Rome, Italy. Data source from Telecom Italia’s Big Data Challenge. 33 2.4. Example of a functional dataset: WiFi traffic in Rome depending on hour of the
day. Data source from Telecom Italia’s Big Data Challenge. . . 36 2.5. Examples of SVM, where different datasets are analyzed according to a linear
(left) and a Gaussian (right) kernel. . . 38
3.1. Bandwidth forecasting examples: category 3, 2 and 1 predictor outputs are shown on the left hand side, in the center and on the right hand side, respectively. . . 61 3.2. Plots of the Signal-to-Interference-plus-Noise Ratio (SINR) Cumulative
Distribu-tion FuncDistribu-tion (CDF)FΓ, given a perfect knowledge ofN = 10(left) or a perfect knowledge ofd= 1.5Km (right). In the former case the standard deviationσd,
of the distance is set as that of the most common localization systems, while in the latterσN ∈ {0,1,3,10}. . . 63
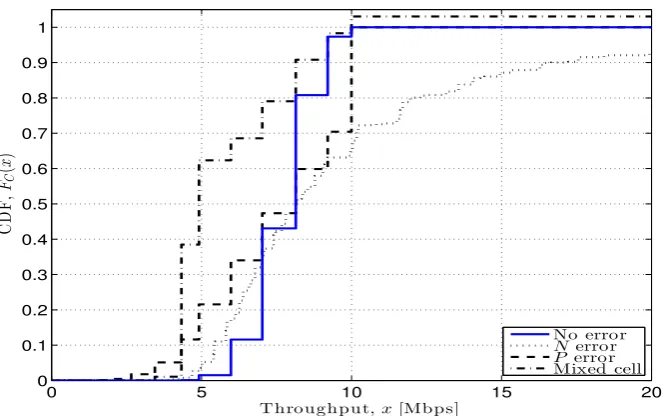
3.3. Plots of the throughput CDFFT, given a perfect knowledge of N = 10 (right
left side) or a perfect knowledge of d = 1.5 Km (right hand side). In former case the standard deviationσd, of the distance is set as that of the most common
localization systems, while in the latter,σN ∈ {0,1,3,10}. . . 64
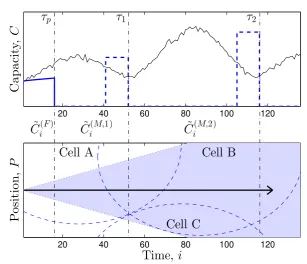
4.1. Capacity availability prediction uncertainties: short term predictors are useful un-til timeTc, while the medium term model is used until slotTe. . . 67
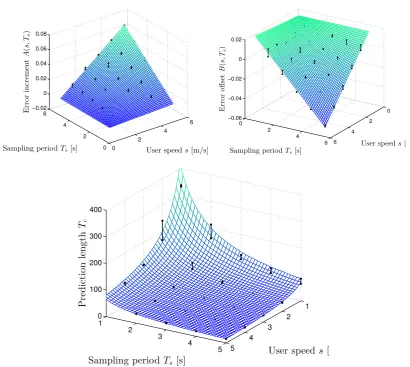
4.2. Comparison between the collected data and the fitted model varying sand Ts.
Starting from the left, the figures show the approximation of theA(left),B (cen-ter) andTc(right) parameters as surfaces and the distance from the surface to the
actual data as lines. . . 70
4.3. On the left a comparison between model and data for differents, Tscouples. On
the right a contour plot of the average distance between the model and the data. . 71
5.1. The shaded area represents how the standard deviation of the short term prediction error increases with increasing prediction distance varying the user speed vand the slot timet. τprepresents the time after whichσ∆≥σC. . . 84
5.2. Examples of the impact of uncertainties on the capacity distribution. . . 85
5.3. Example of the general prediction model and related user position. . . 88
5.4. Comparison among the three main algorithms. . . 90
5.5. Pathloss map of Berlin as measured by the MOMENTUM project. . . 91
5.6. Performance comparison among ICARO, OPT and FULL with vehicular mobil-ity. ξ,ηandζ are plotted on the left, center and right respectively. . . 92
5.7. Performance comparison with pedestrian mobility. . . 93
5.8. OPT(x)performance against prediction horizonxcompared with the other algo-rithms for vehicular (left) and pedestrian mobility (right). . . 94
5.9. Performance gap CDF between ICARO and OPT(x)forx = 60seconds. Cost and buffer under-run time gaps on the left and right respectively. . . 94
6.1. Graphic example of simple SS&S operations: users’ achievable rates, R are shown at the top, the allocationA and the latenessLafter the greedy phase are plotted in the second and third plots from the top respectively. While the fourth and the fifth plot show the optimalAandLafter the swap phase. The improve-ments from G1 to O1 and from G2 to O2 involve a Type 1 and a Type 2 swap respectively. . . 102
6.2. Performance comparison among SS&S, optimal and baseline: the plots show the average lateness, the average total video quality normalized over the average ca-pacity and the gap between the results obtained by SS&S and the optimal varying the number of iterations. . . 108
6.3. Contour plots of the average lateness (left), average total quality (center) and trade off plot (right) between lateness and quality varyingαandβ. . . 109
7.1. An example of achievable ratesri,j (top), assignmentsai,j (center) and obtained ratesai,jri,j(bottom) in a3-user scenario. . . 114
7.2. Three examples of the system quantities: 7.2(a) exemplifies the buffer usage over two subsequent slots; 7.2(b) shows lateness and extra quality outage examples; 7.2(c) illustrates the impact of pre-buffering. . . 115
7.6. Evaluation of the performance of the joint admission control and resource alloca-tion solualloca-tion. . . 125
8.1. Annotated capture of half a frame of a10MHz Long Term Evolution (LTE) sig-nal. The Orthogonal Frequency Division Multiplexing (OFDM) grid spans re-source blocks on thex-axis and subframes on they-axis. We highlighted the syn-chronization sequences (Primary Synchornization Sequence (PSS) and Secondary Synchronization Sequence (SSS)) and the Master Information Block (MIB) in the center of the band. The horizontal lines representing the control channel are high-lighted in white, while the Control Format Indicator (CFI) elements within the control channel are drawn in black. . . 133 8.2. Results of the verifier on the same locations of Figure 8.1: the five rows compare
the reference signal threshold to the average power measured on the Resource Block (RB)s. . . 138 8.3. OWL validation campaign results. On the left plot we show the likelihood (y
-axis) of detecting the fraction of RBs specified on thex-axis computed per frame; the central plot is similar, but measured per frame; the plot on the right illustrates the ratio between the number of decoded RBs of OWL and LTEye. . . 139
9.1. Experiment setup showing devices, connections and software. . . 144 9.2. Communication diagram for downlink burst transmissions. . . 146 9.3. Comparison of the estimator ratios computed on burst by the application. The
small plots on the left show estimator densities: thex-axis is the cell ground truth and they-axis the estimate. . . 147 9.4. Comparison of the estimator ratios computed on burst by the kernel (a) and on
groups (b). The small plots on the left show estimator densities: thex-axis is the cell ground truth and they-axis the estimate. . . 148 9.5. Interarrival time CDFs for short (top) and long (bottom) intervals and the three
phones. . . 149 9.6. Estimator ratios computed on burst in the uplink (left). Estimator ratios against
different burst size. . . 150 9.7. Communication diagram for the downlink isolated transmission. Dimension lines
illustrate data-to-ack latency. . . 152 9.8. Empirical probability density functions of the latencies. . . 154 9.9. Overall comparison among the data rate estimators. All boxplots show the
distri-bution of the estimator ratios from the25thand75thpercentiles. . . 156
10.2. Fig.(a): Cumulative Density Function of the error introduced by interpolating over gaps of varying size. Fig.(b): Prediction examples computed over down-link (top) and updown-link (bottom) traces of the same user using an AutoRegressive Integrated Moving Average (ARIMA) model. The trace and the predictions are sampled every0.5seconds for readability. . . 167 10.3. A comparison between the solutions obtained with perfect and realistic predictors. 169 10.4. Callao area in Madrid downtown. . . 171 10.5. Rastro area, a market area in Madrid center. . . 171 10.6. The area surrounding IMDEA in Leganes. . . 172 10.7. The sniffer and eNodeB locations in Leganes downtown. . . 172 10.8. CDF of the trace duration mapped to the sorted CDF of load and data rate in Callao.173 10.9. Comparison between MCS for active and all users for both downlink and uplink. 174 10.10.Downlink trace variability characterization: on the left the CDF of standard
devi-ation of the MCS used in active traces; on the right the absolute varidevi-ation of the MCS. . . 175 10.11.A35-second portion of the downlink channel of the Callao dataset. Each row of
the top chart shows the MCS evolutions of an active user. The lower chart provide aggregated information of the cell traffic. . . 176 10.12.Variation of the ideal optimizer performance over a full day downlink traffic in
Callao, compared to the cell load. Lines illustrate the moving averages of the parameters, while dots are single results. . . 178 10.13.CDFs of the resource saving obtained by anticipatory networking solutions for
different prediction accuracies. . . 179 10.14.CDFs of the data rate increase obtained by anticipatory networking solutions for
different prediction accuracies. . . 180 10.15.Anticipatory networking performance varying the prediction horizon length (left),
and the buffer size (right). . . 181
A.1. Dispersion of IP packets over the Internet. First, they are sent back-to-back from the server (1). After experiencing dispersion on the Internet, they arrive on the Base Station (BS) (eNodeB) (2). Finally, they are received in groups by the User Equipment (UE) (3). The timelines (1-3) in the figure happen sequentially, one after the other, not in parallel. The horizontal arrows represent a Transport Block (TB) allocated to the recipient UE. . . 191 A.2. Scatterplots ofcWˆ (top row) and histograms ofγWˆ (bottom row) computed for
tT ={1,5,10,30}ms from left to right. When the dispersion time is computed
on windows larger than the TTI,tT > tS, the dispersion time distribution gets
A.3. Left: Ratio∆(tT), varying tT ∈ [2, . . . ,50]ms. The measurements get stable
fromtT > tS = 10ms. Center: Normalized root mean square error εC of the
capacity estimate computed over a fraction f = K/N of continuous samples for varying bin sizes ({0.1s, 0.2s, 0.5s, 1s}). Right: Time plot of the capacity variationCU(t)computed every500ms and its different estimates computed with
f ={10,20,50,100}%. . . 195 A.4. Left: CV(NRMSE)εP of the capacity estimate between ideal arrivals (tP = 0)
and arrivals that suffer from polling (tP 6= 0), for varying bin sizes and minimum
dispersion timestT. Right: Deviation of the sampling estimations (k = 5%) for
various average polling periodstP from the ideal case (k= 100%,tP = 0). . . . 197
A.5. Scatterplot of the average estimate of per user capacityE[ ˜C(K)]computed over
ACK Acknowledgment
ANN Artificial Neural Network
AR AutoRegressive
ARC Admission and Resource Control
ARIMA AutoRegressive Integrated Moving Average
ARMA AutoRegressive Moving Average
ASU Arbitrary Strength Unit
BS Base Station
C-RNTI Cell RNTI
CCN Content Centric Network
CDF Cumulative Distribution Function
CF Collaborative Filtering
CFI Control Format Indicator
ConvOpt Convex Optimization
CRC Cyclic Redundancy Check
CR Cognitive Radio
CSI Channel State Information
CTM Continuous Time Markov
CTMC Continuous Time Markov Chain
D2D device-to-device
DASH Dynamic Adaptive Streaming over HTTP
DCI Downlink Control Information
DiffServ Differentiated Services
DTMC Discrete Time Markov Chain
eCDF empirical Cumulative Distribution Function
ELM Extreme Learning Machine
epdf empirical probability density function
FARIMA AutoRegressive Fractionally Integrated Moving Average
FDD Frequency Division Multiplexing
FTP File Transfer Protocol
GARCH Generalized AutoRegressive Conditionally Heteroskedastic
GP Gaussian Process
GPS Global Positioning System
HMM Hidden Markov Models
HLS HTTP Live Streaming
HSPA High Speed Packet Access
HSDPA High Speed Downlink Packet Access
HTTP Hypertext Transfer Protocol
ID identity
ILP Integer Linear Programming
IP Internet Protocol
KKF Kriged Kalman Filter
KPI Key Performance Indicator
LTE Long Term Evolution
LP Linear Programming
MA Moving Average
MC Markov Chain
MCS Modulation and Coding Scheme
MIB Master Information Block
MILP Mixed-Integer Linear Programming
MNLP Mixed Non-Linear Program
MPC Model Predictive Control
MDP Markov Decision Process
MRA MultiResolution Analysis
MSE Mean Square Error
NIC Networks Interface Card
OFDM Orthogonal Frequency Division Multiplexing
OS Operating System
OWL Online Watcher for LTE
PCI Physical Cell ID
PDCCH Physical Downlink Control Channel
PDSCH Physical Downlink Shared Channel
PF Proportionally Fair
PSS Primary Synchornization Sequence
QoE Quality-of-Experience
QoS Quality-of-Service
RA Resource Allocation
RA-RNTI Random Access RNTI
RAN Radio Access Network
RAR Random Access Response
REM Radio Environment Map
RNTI Radio Network Temporary Identifier
RRC Radio Resource Control
SDR Software Defined Radio
SFN System Frame Number
SINR Signal-to-Interference-plus-Noise Ratio
SSS Secondary Synchronization Sequence
SVM Support Vector Machine
TB Transport Block
TCP Transmission Control Protocol
TLS Transport Layer Security
TTI Transmission Time Interval
UDP User Datagram Protocol
Summary
“Every form of behavior is compatible with determinism. One dynamic system might fall into a basin of attraction and wind up at a fixed point, whereas another exhibits chaotic behavior indefinitely, but both are completely deterministic” [1]. In his provocative essay, Ted Chiang is suggesting that unpredictability is just a consequence of the limitedness of human comprehen-sion. Without going as far as calling mobile networks deterministic phenomena, in this thesis we investigate how to predict them and how to exploit prediction for their optimization.
Anticipatory networking is a recent branch of wireless communications where performance optimization is driven by prediction of the future evolution of the system. In such a way, commu-nication systems can exploit different context information to evaluate the opportunity of making a given decision not only in terms of the current system state, but also accounting for what is going to happen in the system. The main idea is that if we are able to predict the system state evolution and possible disruptive events, we can make better decisions and take actions directed to steer the system so that not only can we mitigate the impact of serious treats, but also we can exploit indicators of forthcoming improvements to adopt more uncompromising policies.
For instance, a common example for disruptive events is the impact of a large crowd meeting at a given location: in such an event a few network cells need to face a much larger traffic than what their usual level is. However, these events are very rarely abrupt. Usually, indicators of such a situation can be seen well in advance: for example, the number of connected users is larger than the average and growing and, if mobility information is available, the density of people in surrounding areas can hint to many persons moving towards the event center. These indicators, together with more direct ones, such as an obvious traffic increase, and more subtle ones, such as twitter messages originated in the area with similar contents, can be combined together to identify a possible network issue. In such a case, the more serious effects of the event can be counteracted by adopting more conservative load balancing policies that refrain from direct additional traffic to the area, or more careful resource allocation and admission control strategies can be selected to avoid outage or, at least, limit it.
Moreover, anticipatory networking does not only focus on large scale disruptive events, but also it considers more nuanced variation in the system conditions both as perceived by the system as a whole and by single users. For instance, the signal quality perceived by a mobile user moving between different cells depends on many factors. The first of which is the pathloss, i.e. the signal degradation due to the distance between the user’s mobile and the base station antenna; then the surrounding environment contributes to it in form of fading, i.e., the attenuation variations due, for instance, to multi-path propagation, and other factors such as how many other users are present and the traffic they may produce. All these parameters can be monitored and, with different level of accuracy, predicted. Therefore, the user’s mobile phone (or some control software on it) can tune its operations according to current and expected requirements and conditions. Alternatively, the optimization can be driven by network operators by tuning the resource allocation of all users connected to the same base station taking into account their individual predictions, their mutual relationships and the conditions of the neighboring cells.
In particular, the most straightforward use case, which is also used to evaluate the solutions proposed in the rest of this thesis, is multimedia streaming. Multimedia streaming is one of the main source of mobile traffic [2] and its characteristics make it the perfect application for antic-ipatory networking evaluation: streaming applications use buffer to avoid outages, they present data requirements variable with time and that may be varied according to the desired quality. An-ticipatory networking solutions can exploit the buffer to decide when to request more resources from the network (i.e. when the signal quality is higher and communication is more efficient) and when to rely on buffered content to avoid consuming resources (i.e. bad signal quality).
In this thesis, we analyze prediction-based techniques for the optimization of mobile net-works, by also addressing practical aspects and providing a thorough evaluation based on both synthetic traces and actual measurements. Prediction-based optimization is one of the most archetypal formulation of anticipatory networking: it makes use of one or more forecasting tech-niques to drive the solution of a given optimization problem. In particular, in this thesis we mainly focus on ARIMA and statistical models for what concerns the prediction part and on convex op-timization, linear programming and heuristics derived from both to solve the optimization part.
The rest of thesis is split into four parts that cover the following aspects of the work: Part I contains introductory material and discusses preliminary topics; Part II contains the main theo-retical results; Part III is dedicated to practical aspects related to the realization of anticipatory networking solutions and Part IV summarizes the overall achievements by illustrating how the proposed techniques perform in real environment and compare them to theoretical bounds; this fi-nal part also provides the conclusions to this thesis. In the following, we provide brief summaries of each of the parts of the thesis together with a selection of the most representative results.
used to control the optimization framework. In addition, two brief handbooks are provided to analyze the possible alternatives in terms of prediction and optimization techniques. Chapter 3 and Chapter 4 present two models to characterize prediction errors when forecasting is applied to estimate the achievable data rate of mobile users. In particular, the former presents a two-part framework to deal with short- and medium- long-term predictions, while the latter proposes a heuristic to estimate the short-term prediction errors based on Gaussian random walks.
The second part of the thesis will present our original optimization solutions and is split into three chapters. Chapter 5 describes our first anticipatory networking technique, which combines an optimal solution to the omniscient resource allocation minimization problem with the two-scale error model of Chapter 3 to account for prediction uncertainty. Chapter 6 extends the optimization problem to the multi-user case and accounts for quality maximization when all the users are served with minimum outage: methods to compute the optimal solution and a fast heuristic are provided. Chapter 7 introduces guaranteed quality of service in the optimization framework: in particular, the proposed solution computes the largest set of users that can be served by the system guaranteeing the specified quality to each of them. This initial solutions are validated on synthetic datasets and show the potential benefits of anticipatory networking solutions: theoretical resource savings quality improvements of about 50% have been measured in our dataset when perfect prediction has been used, while the performance of the heuristic solutions were still improving over the baseline, but worse than the optimal of about20%.
The third part of the thesis describes the tools and methodologies we developed to evalu-ate the practical performance of our solutions. The main tool we designed and developed is a decoder of the LTE control channel and is described in Chapter 8: thanks to a software de-fined radio and our software it is possible to collect uplink and downlink information about LTE scheduling (i.e. modulation and coding scheme used by the different users, their assigned re-source and their actual data rate) on a per millisecond granularity. The tool is publicly available
at: https://git.networks.imdea.org/nicola_bui/imdeaowl. First, we
evalu-ated how effectively mobile phones can estimate the achievable data rate obtainable from an LTE cell. Subsequently, we started collecting a month-worth of data in four locations in Madrid and Leganes on which evaluate our solutions in details. Chapter 9 evaluates how accurate is the esti-mation of mobile phones achievable rate by using data collected with my sniffer. We concluded that accurate and precise measurements can be obtained with mobile phones even in case of short-lived communications (e.g. 50ms or100KBytes). However, different phones present different biases. An additional contribution, which provides more details on a lightweight methodology to estimate achievable data link rates using mobile phone applications is provided in Appendix A.
statistics. After showing the main characteristics of the datasets we applied a comprehensive op-timization framework to evaluate different resource allocation techniques coupled with variable forecasting accuracy. In particular, we evaluated 1) the fraction of saved network resources keep-ing constant the quantity of data offered to each users and 2) the data rate improvement keepkeep-ing constant the quantity of resources assigned to each users. Not only did the analysis on the real datasets validate the theoretical results, but we measured performance improvements even larger than the ones obtained on synthetic traces. This fact is mainly due to the way different users were generated for the synthetic traces: by picking them from the same statistical distribution does not re-create the same level of variety that is present in real datasets. In turn, the differences among users allowed the optimization framework to obtain better results. With average resource sav-ings of about40% and about twice the data rate, we believe anticipatory networking is a feasible solution for current and even more for the networks of the next generation.
1.1.
Contributions
The main body of the thesis comprehends 13 publications, of which 3 are journals (one has just been submitted), 7 are conference papers (one of which is still under review), 1 is a minor workshop and 2 are two demo papers. The ranking specified for conference pa-pers is based on either the CORE2014 or the ERA2010 datasets (see http://portal.
core.edu.auandhttp://www.conferenceranks.com/), while for journals the
Jour-nal Citation Reports (JCR) percentile and quartile is specified (seehttps://jcr.incites.
thomsonreuters.com/). In all the papers where I am not the first author, I specified what
was my contribution to the work. In details,
The prediction error model is published in [4] (conference, first author, rank N/A).
The link between prediction error and Gaussian random walks is published in [5] (workshop paper, first author, rank N/A).
The survey on anticipatory networking techniques is published in [3] (journal, first author, JCR 99.653 - Q1).
The resource allocation solution for single user which accounts for prediction errors is published in [6] (conference, first author, rank A).
The multi-user variable quality heuristic for multi-objective resource allocation is published in [7] (conference, first author, N/A).
The optimization and prediction techniques comprehensive framework is currently under review in [9] (conference, first author, rank A) and is being extended as a journal contribution for [10] (journal, first author, JCR 87.847 - Q1).
The description of the LTE sniffer is published in [11] (conference, first author, N/A).
The work on mobile phone lightweight measurements is published in [12] (confer-ence, second author, rank A) and in [13] (journal, second author, JCR 80.903 - Q1): I mainly contributed to this work providing the methods to estimate the achievable data rate from the packet dispersion rate and how to implement it on the measurements.
Two demo papers has been published as proof-of-concepts of the thesis [14] (confer-ence, second author, rank B) and [15] (confer(confer-ence, third author, rank B): both demos were a joint work with a German group who presented the demonstration.
Besides the core of the thesis, I published3other journals and2other conference papers. In details,
In collaboration with TU Darmstadt I contributed in two works that evaluated the quality-of-service of mobile networks thanks to crowd-sourced data. These works are pub-lished in [16] (conference, third author, rank B) and [17] (journal, third author, JCR 55.903 - Q2)
I contributed to a work on LTE energy saving policies [18] (conference, third au-thor, rank B), which was lead by the Center of Technology and Telecommunications of Catalunya: here I provided baseline policies and I contributed to obtaining the final results.
Survey of Anticipatory Networking
Solutions for Mobile Networks
This chapter investigates anticipatory networking, a recent research direction that supports network optimization through system state prediction. Anticipatory networking is enabled by prediction tools and the recent and huge increase in data availability. In addition, data centers are becoming more and more important in providing services and tools to access and analyze huge amounts of data.
This chapter reviews the recent literature of prediction-based solutions that are proposed for wireless mobile networks. In addition, this survey delves into the following questions: How can prediction support wireless networks? Which type of information is possible to predict and which applications can take advantage of it? Which tools are the best for a given scenario or application? Which scenarios, among the ones envisioned for 5G networks, can benefit the most from anticipatory networking? What is yet to be studied in order for anticipatory networking to be implemented in 5G networks?
A typical anticipatory networking solution is usually characterized by the following three attributes, which also determine the structure of this survey:
Contextdefines the type of information considered to forecast the system evolution.
Predictionspecifies how the system evolution is forecast from the context.
Optimizationdescribes how prediction is exploited to meet the application objectives.
With reference to a typical access control problem, the anticipatory networking solution might exploit the history of Global Positioning System (GPS) information (context) to train an AutoRegressive (AR) model (predictionpart) to predict the future positions of the users and their channel conditions to solve an Integer Linear Programming (ILP) problem (optimizationpart) that maximizes their Quality-of-Experience (QoE).
We split the main body of the anticipatory networking literature into four categories based on the context used to characterize the system state and to determine its evolution: geographic,
in the form of human mobility patterns derived from location-based information; link, coded as channel gain, noise and interference levels obtained from reference signal feedback; traffic, represented by network load, throughput, and occupied physical resource blocks based on higher-layer performance indicators; social, such as user’s behavior, profile, and information derived from user-generated contents and social networks.
In order to determine which techniques are the most suitable to solve a given problem, it is important to analyze the following:
Propertiesof the context:
1)Dimensiondescribes the number of variables predicted by the model, which can be uni-or multivariate.
2)Granularity and precisiondefine the smallest variation of the parameter considered by the context and the accuracy of the data: the lower the granularity, the higher the precision and vice versa. Temporal and spatial granularities are crucial to strike a balance between efficiency and accuracy.
3)Rangecharacterizes the distance (usually time or space) between known data samples and the farthest predicted sample. It is also known as prediction (or optimization) horizon.
Constraintsof the prediction or optimization model:
1)Availability of physical modelstates whether a closed-form expression exists to describe the phenomenon.
2)Linearityexpresses the quality of the functions linking inputs and outputs of a problem. 3)Side informationdetermines if the context depends on auxiliary information.
11 Prediction(Section 2.2) Optimization(Section 2.3)
Context
(Section
2.1)
Geo
Ideal:[21–24] ConvOpta:[22]
Time series:[4, 25–30] MDPb/MPCc:[31, 32] Regression, classification:[33–40] Game theory:[41]
Probabilistic:[31, 32, 42–51] Heuristic:[21, 23, 29, 30, 38, 39, 51]
Link
Ideal:[7, 8, 52–65] ConvOpt:[7, 8, 52–57, 60–66]
Time series:[6, 67–69] MDP/MPC:[70–73]
Regression, classification:[66, 74–79] Game theory:[80]
Probabilistic:[70–73, 81–83] Heuristic:[6, 67–69, 78, 79, 82, 83]
T
raf
fic
Ideal:[84–91] ConvOpt:[85, 87, 91–98]
Time series:[93, 99–105] MDP/MPC:[90, 99, 105, 106] Regression, classification:[94–97, 107–115] Game theory:[116]
Probabilistic:[106, 112, 117] Heuristic:[84, 86, 89, 108, 111, 113, 114]
Social
Ideal:[118–121] ConvOpt:[119, 120, 122–124]
Time series:[125] MDP/MPC:[126]
Regression, classification:[127–133] Game theory:[41, 80, 116, 134, 135]
Probabilistic:[80, 116, 122–124, 126, 136–139] Heuristic:[118, 121, 125, 127–130, 138, 139]
Surveys: [140–159]
Projects: [160–162]
The classification section provide the reader with the link between the different contexts and the solutions adopted to satisfy the given application requirements. Also, this section is meant to illustrate the range of anticipatory networking solutions. The two handbooks that follow have the twofold objective of reviewing the tools adopted in the literature and to analyze them in terms of variables of interest and constraints of the models.
Table 2.1 provides a mapping between the techniques described in Section 2.2 and 2.3 (columns) and the context discussed in Section 2.1 (rows). Each main category is further split into subcategories according to its internal structure. Namely, the prediction category is subdi-vided into ideal (perfect prediction is assumed to be available), time series predictive modeling, similarity-based classification and regression analysis, and probabilistic methods. The optimiza-tion category is split into Convex Optimizaoptimiza-tion (ConvOpt), Markov Decision Process (MDP) and Model Predictive Control (MPC), game theoretic and, heuristic approaches.
After the analytical part, Section 2.4 concludes the survey discussing the impact of anticipa-tory networking on future networks, the envisioned hindrances to its implementation and the next open challenges.
2.1.
Context-Based Classification
This section illustrates the different types of context that can be predicted and exploited. Each context is illustrated by highlighting the most popular prediction techniques as well as the applications enhanced by anticipatory optimization.
2.1.1. Geographic Context
Geographic context refers to the geographic area associated with a specific event or informa-tion. For what concerns wireless communications, the geographic context is usually the mobile user’s location enriched with speed information as well as past and future trajectories. Fig. 2.1 illustrates an example of estimated trajectories of 6 mobile users.
User mobility is shown to have a predictability as high as93%[42], at least for a high-income country with stable social conditions. Similarly, [49] investigates both the maximal predictability and how close to this value practical algorithms can come when applied to a large mobile phone dataset. Those results indicate that human mobility is very far from being random. Therefore, collecting, predicting and exploiting geographic context is of crucial importance.
The rest of this section is organized according by the main focus of the reviewed papers: the two major groups of them deals with pure geographical prediction, and multimedia streaming optimization, respectively.
2.1.1.1. Next location prediction
12 12.2 12.4 12.6 12.8 13
Longitude
41.4 41.6 41.8 42 42.2 42.4
Latitude
Figure 2.1: Geographic context example: an example of estimated trajectories of 6 mobile users.
and topology preserving maps. Nodes’ location is identified with a vector of distances (in hops) from a set of nodes called anchors and a linear predictor is used to estimate the mobile nodes’ future positions. Evaluation is performed on synthetic data and nodes are assumed to move at constant speed. Results show that the proposed method approaches an accuracy above90%for a prediction horizon of some tens of seconds.
A more general approach that exploits Artificial Neural Networks (ANNs) is discussed in [37]. Extreme Learning Machines (ELMs), which do not require any parameter tuning, are used to speed up the learning process. The method is evaluated using synthetic data over different mobil-ity models.
Location information can be extracted from cellular network records. In this way the gran-ularity of the prediction is more coarse, but positioning can be obtained with little extra energy. In particular, [50] aims at predicting a given user location from those of similar users.Collective behavioral patternsand a Markovian predictor are used to compute the next six locations of a user with a one-hour granularity, i.e., a six-hour prediction horizon. Evaluation is done using a real dataset and shows that an accuracy of about70%can be achieved in the first hour, decreasing to40−50%for the sixth hour of prediction.
2.1.1.2. Space and time prediction
Statistical models are often used to describe the prediction of mobility in a combined space-time domain. In [43], the idea is to predict not only the future location a user will reach, but also whenand forhow long the user will stay there. Mobility is modeled as a semi-Markov process to incorporate thesojourntime during which a user remains in a certain location. In particular, the transition probability matrix and the sojourn time distribution are derived from the previous association history. A similar approach is presented in [44], which extends prediction from single to multi-transitions. Both papers provide also some preliminary results on the benefits of the prediction on resource allocation and balancing.
The interdependence between time and space is investigated also in [34] by examining real data collected from smartphones during a two month deployment. Furthermore, [47] shows the benefit of using a location-dependent Markov predictor with respect to a location-independent model based on nonlinear time series analysis. Additionally, it is shown that information on arrival times and periodicity of location visits is needed to provide accurate prediction. A system design, named SmartDC, is presented in [31, 32, 51]. SmartDC comprises a mobility learner, a mobility predictor and an adaptive duty cycling. The proposed location monitoring scheme optimizes the sensing interval for a given energy budget. The system has been implemented and tested in a real environment. Notably, this is also one of the few papers that takes into account the costof prediction, which in this case is evaluated in terms of energy. Namely, the authors detect approximately90% of location changes, while reducing energy consumption at the expense of higher detection delay.
In [45], the authors represent the network coverage and movements using graph theory. The user mobility is modeled using a Continuous Time Markov (CTM) process where the prediction of the next node to be visited depends not only on the current node but also on the previous one (i.e., second-order Markovian predictor). Considering both local as well as global users’ profiles, [46] extends the previous Markovian predictor and improves accuracy by about30%. As pointed out in [48], sojourn times and transition probabilities are inhomogeneous. Thus, an inhomogeneous CTM process is exploited to predict user mobility. Evaluation on a real dataset shows an accuracy of67%for long time scale prediction.
2.1.1.3. Location sequences and trajectories
evaluate first the predictability of the considered data and then show that the proposed nonlinear predictor outperforms both linear and Markov-based predictors. Precision approaches70−90%
for medium scale prediction (5minutes) and decreases to20−40%for long scale (up to8hours). Trajectory analysis and prediction also benefit from exploiting specific constraints such as streets, roads, traffic lights and public transportation routes. In [83] the authors adapt the local Markovian prediction model for a specific coverage area in terms of a set of roads, moving di-rections, and traffic densities. When applying Markov prediction schemes, the authors consider a road compression approach to avoid dealing with a large number of locations, reduce the size of the state space, and minimize the approximation error. A more attractive candidate for trajec-tory prediction is the public transportation system, because of known routes and stops, and the large amount of generated mobile data traffic. In [24], the authors investigate the predictability of mobility and signal variations along public transportation routes, to examine the viability of predictive content delivery. The analysis on a real dataset of a bus route, covering both urban and sub-urban areas, shows that modeling prediction uncertainty is paramount due to the high variability observed, which depends on combined effects of geographical area, time, forecasting window and contextual factors such as signal lights and bus stops.
In order to improve the accuracy of time series techniques, in [26] the authors exploit the movement of friends, people, and, in general, entities, with correlated mobility patterns. By means of multivariate nonlinear time series prediction techniques, they show that forecasting accuracy approaches95%for medium time scale prediction (5to10minutes) and is approximately 50%
for3hour prediction. Confidence bands show a significant improvement when prediction exploits patterns with high correlation. Evaluation is done considering two different real datasets.
Kalman filtering is used to predict the future velocity and moving trends of vehicles and to improve the performance of broadcasting [30] when it comes for continuous trajectories. The main idea is that each node should send the message to be broadcast to the fastest candidate based on its neighbors’ future mobility. Simulation results show modest gains, in terms of percentage of packet delivery and end-to-end delay, with respect to non-predictive methods.
Regression techniques [40] can be used instead of Kalman filters to analyze GPS observa-tions of past trips. A systematic methodology, based on geometrical structures and data-mining techniques, is proposed to extract meaningful information for location patterns. This work char-acterizes the location patterns, i.e., the set of locations visited, for several millions of users using nationwide call data records. The analysis highlights statistical properties of the typical covered area and route, such as its size, average length and spatial correlation.
object. Results are shown using a real dataset provided by the GeoPKDD project [161]. The au-thors show the trade-off between the fraction of predicted trajectories and the accuracy. Both [35] and [36] show similar performance with an accuracy of approximately 40%and medium time scale prediction (order of minutes).
2.1.1.4. Dealing with errors
We analyzed the impact of estimation and prediction errors in [4]. We propose a comprehen-sive overview of several mobility predictors and associated errors and investigate the main error sources and their impact on prediction. Based on this, they propose a stochastic model to predict user throughput that accounts for uncertainty. The method is evaluated using synthetic data while assuming that prediction’s errors have a truncated Gaussian distribution. The joint analysis on the predictability of location and signal strength, which in this case is simply quantified by the stan-dard deviation of the random variable, shown in [24] indicates that location-awareness is a key factor to enable accurate signal strength predictions. Location errors are also considered in [28] where both temporal and spatial correlation are exploited to predict the average channel gain. The proposed method combines an AR model with functional linear regression and relies on location information. Results are derived using real data taken from the MOMENTUM project [160] and show that the proposed method outperforms SVM and AR processes.
2.1.1.5. Mobility-assisted handover optimization
Efficient resource reservation and context transfer procedures during handover are key to pro-vide users with seamless mobility. To guarantee the service continuity for mobile users, the conventional in-advance resource reservation schemes make a bandwidth reservation over all the cells that a mobile host will visit during its active connection. By predicting mobility pattern, it is possible to prepare resources in the most probable cells for the moving users. Using a Markov chain-based pattern prediction scheme, the authors in [83] propose a statistical bandwidth man-agement algorithm to handle proactive resource reservations to reduce bandwidth waste. Along similar lines, [45, 125] investigate mobility prediction schemes, also considering user profiles, time-of-day, and duration characteristics, to improve the handover performance in terms of re-source utilization, handover accuracy, call dropping and call blocking probabilities.
2.1.1.6. Geographically-assisted video optimization
the prediction is performed for the upcoming100meters. The predictive algorithm reduces the number of buffer underruns and provides stable video quality.
Application-layer video optimization based on prediction of user’s mobility and expected ca-pacity, is proposed also in [21, 22, 39]. In [21], the authors minimize a utility function based on system utilization and rebuffering time. For the single user case they propose an online scheme based on partial knowledge, whereas the multiuser case is studied assuming complete future knowledge. In [22], different types of traffic are considered: full buffer, file download and buffered video. Prediction is assumed to be available and accurate over a limited time win-dow. Three different utility functions are compared: maximization of the network throughput, maximization of the minimum user throughput, and minimization of the degradations of buffered video streams. Both works show results using synthetic data and assuming perfect prediction of the future wireless capacity variations over a time window with size ranging from tens to hundreds of seconds. In contrast, [39] introduces a data rate prediction mechanism that exploits mobility information and is used by an enhanced Proportionally Fair (PF) scheduler. The performance gain is evaluated using a real dataset and shows a throughput increase of15%-55%.
Delay tolerant traffic can also benefit from offloading and prefetching as shown in [23]. The authors propose methods to minimize the data transfer over a mobile network by increasing the traffic offloaded to WiFi hotspots. Three different algorithms are proposed for both delay tolerant and delay sensitive traffic. They are evaluated using empirical measurements and assuming errors in the prediction. Results show that offloaded traffic is maximized when using prediction, even when this is affected by errors.
Ageo-predictive streaming systemcalled GTube, is presented in [38]. The application obtains the user’s GPS locations and informs a server which provides the expected connection quality for future locations. The streaming parameters are adjusted accordingly. In particular, two quality adaptation algorithms are presented, where the video quality level is adapted for the upcoming 1 and n steps, respectively, based on the estimated bandwidth. The system is tested using a real dataset and shows that accuracy reaches almost 90% for very short time scale prediction (few seconds), but it decreases very fast approaching zero for medium time scale prediction (few minutes). However, the proposedn-step algorithm improves the stability of the video quality and increases bandwidth utilization.
2.1.2. Link Context
2.1.2.1. Channel parameter prediction
One possible approach to anticipate the evolution of the physical channel state is to predict the specific parameters that characterize it. In general, both large- and small-scale fading is the cause of the variations of the physical channel. Although it might not be possible to predict fast fading, pathloss and shadowing effects have been shown to be predictable and has been the focus of several papers. In [79], the time-varying nonlinear wireless channel model is adopted to pre-dict the channel quality variation anticipating distance and pathloss exponent. The performance evaluation is done using both an indoor and an outdoor testbed. The goodput obtained with the proposed bitrate control scheme can be almost doubled compared to other approaches.
The authors of [77] propose a two-step approach that combines machine learning and di-mensional reduction techniques. Specifically, they propose a new model for generating the input vector, the dimension of which is reduced by applying linear and nonlinear principal component analysis. A trained learning machine is then use to process the reduced vector. The authors com-pare ANNs and SVMs using real measurements and conclude that slightly better results can be achieved using the ANN regressors.
Supporting the temporal prediction with spatial information is proposed in, e.g., [74] to study the evolution of shadow fading. To this extent a Kriged Kalman Filter (KKF) is proposed to track the time varying shadowing using a network of Cognitive Radios (CRs). The prediction is used to anticipate the position of the primary users and the expected interference and, consequently, to maximize the transmission rate of CR networks. Errors with the proposed model approach 2
dB (compared to 10dB obtained with the pathloss based model). A similar objective is aimed at in [72], which formulates the CR throughput optimization problem as an MDP. In particular, the predicted channel availability is used to maximize the throughput and to reduce the time overhead of channel sensing. Predictors robust to channel variations are investigated also in [78]. A clustering method with supervised SVM classification is proposed. The performance is shown for bulk data transport via Transmission Control Protocol (TCP) and it is also shown that the predictive approach outperforms non-predictive ones.
Finally, maps are a popular tool to provide geo-referenced predictions; for instance, algo-rithms to build pathloss maps are proposed in [75]. In this paper, the authors propose two kernel-based adaptive algorithms, namely the adaptive projected subgradient method and the multikernel approach with adaptive model selection. Numerical evaluation is done for both a urban scenario and a campus network scenario, using real measurements. The performance of the algorithms is evaluated assuming perfect knowledge of the users’ trajectories.
2.1.2.2. Combined channel and mobility context
pre-Figure 2.2: Link context example: a pathloss map of Berlin downtown obtained from the data of the MOMENTUM project, where the triangles represent base stations. Pathloss maps are frequently used to predict the evolution of the connection quality in mobile networks.
diction accuracy is approximately 70% for a prediction window of 20 seconds. However, the location information has quite a coarse granularity (of about100m). In terms of bandwidth, the proposed model, evaluated on a real dataset, shows an accuracy within10KB/s for over50%of the evaluation period, and within50KB/s for over80%of the time. In [67], the routing metrics in ad hoc wireless networks is assisted by prediction. In particular, the metrics considered in the paper are the average number of retransmissions needed and the time expected to transmit a data packet. The solution anticipates the future signal strength using linear regression on the history of the link quality measurements. Simulations show that the packet delivery ratio is close to100%, even though it drops to20%using classical methods.
Prediction is often affected by errors, it is, thus, important to account for their magnitude. This has been considered, for instance, in [59, 76], where the impact of location uncertainties is taken into account. Namely, the authors of [76] show that classical Gaussian Process (GP) wrongly predicts the channel gain in presence of errors, while uncertain GP, which explicitly accounts for location uncertainty, outperforms the former in both learning and predicting the received power. Gains are shown also for a simple proactive resource allocation scenario. Similarly, the second paper [58] discusses a proactive scheduling mechanism that exploits the statistical properties of user demand and channel conditions. Furthermore, the model captures the impact of prediction uncertainties and assesses the optimal gain obtained by the proactive resource scheduler. The authors also propose an asymptotically optimal policy that attains the optimal gain rapidly as the prediction window size increases.
optimizer (i.e., when the prediction is done only for the upcoming few seconds) by 10−15%. Resource allocation is also addressed in [39], which extends the standard PF scheduler of 4G networks to account for data rate prediction obtained through adaptive radio maps.
2.1.2.3. Channel-assisted video optimization
In [68], the authors propose an adaptive mobile video streaming framework, which stores video in the cloud and offers to each user a continuous video streaming adapted to the fluctuations of the link quality. The paper proposes a mechanism to predict the potential available bandwidth in the next time window (of a duration of a few seconds) based on the measurements of the link quality done in the previous time window. A prototype implementation of the proposed framework is used to evaluate the performance. This shows that the prediction has a relative error of about10%for very short time windows (a couple of seconds) but becomes relatively poor for larger time windows. The video performance is evaluated in terms of “click-to-play” delay, which is halved with the proposed approach.
Video calls are analyzed in [69], where a cross-layer design for proactive congestion control, named Rebera, is proposed. The system measures the real-time available bandwidth and uses a linear adaptive filter to estimate the future capacity. Furthermore, it ensures that the video sending rate never exceeds the predicted values, thereby preventing self-congestion and reducing delays. Performance results with respect to today’s solutions are given for both a testbed and a real cellular network. In [66], the authors propose a hop-by-hop video quality adaptation scheme at the router level to improve the performance of adaptive video streaming in Content Centric Networks (CCNs). In this context, the routers monitor network conditions by estimating the end-to-end bandwidth and proactively decrease the video quality when network congestion occurs. Performance is evaluated considering a realistic large-scale network topology and it is shown that the proposed solution outperforms state of the art schemes in terms of both playback quality and average delay.
A Markov model is used in [70], where information on both channel and buffer states is combined to optimize mobile video streaming. Both an optimal policy as well as a fast heuristic are proposed. A drive test was conducted to evaluate the performance of the proposed solution. In particular, the authors show the proportional dependency between utility and buffer size, as well as the complexity of the two algorithms. Furthermore, a Markov model is adopted to represent different user’s achievable rates [82] and channel states [73]. The transition matrix is derived empirically to minimize the number of video stalls and their duration over a10-second horizon.
2.1.2.4. Video optimization under uncertainty
the algorithm determines whether to consider or discard the predicted data rate. A similar model for prediction errors is introduced in [61]. In this case, a Linear Programming (LP) formulation is proposed to trade off spectral efficiency and stalling time. The proposed solution shows good gains with respect to the case without prediction, even when errors occur. LP is used also in [62] to minimize the base station airtime with the constraint of no video interruption. In this case, uncertainties are modeled by using a fuzzy approach. Furthermore, in order to keep track of the previous values of the error, a Kalman filter is used. Simulations are run using synthetic data and show the effect of channel variability on video degradation and average airtime. In [63], the qual-ity of video streaming is increased thanks to bandwidth prediction. Both perfect and uncertain prediction are considered and a robust heuristic is proposed to mitigate the effect of prediction errors when adapting the video bitrate. In [64, 65], a predictive resource allocation robust to rate uncertainties is proposed. The authors propose a framework that provides quality guarantees with the objective of minimizing energy consumption. Both optimal gradient-based and real-time guided heuristic solutions are presented. In [64] both Gaussian and Bernstein approximation are used to model rate uncertainties, whereas [65] considers only the former one. Similarly, [164] pro-vides predictive Quality-of-Service (QoS) over wireless ATM networks: given the TDMA nature of these networks, these schemes optimize the number of allocated time slots depending on the characteristics of the stream and the link.
2.1.2.5. Efficiency bounds and approximations for multimedia streaming applications
Other papers ( [7,8,52–57]) analyze resource allocation optimization assuming that the future channel state is perfectly known. Differing on the final objectives, these papers adopt similar methods: they first devise a problem formulation from which an optimal solution can be obtained (using standard optimization techniques), then they propose sub-optimal approaches and on-line algorithms to obtain an approximation of the optimal solution. Furthermore, all these papers lever-age a buffer to counteract the randomness of the channel. For instance, in case a given amount of information has to be gathered within a deadline, the buffer allows the system to optimize (for a given objective function) the resource allocation while meeting the deadline.
The trade-off between streaming interruption time and average quality is investigated in [54, 55] by devising a mixed-integer quadratically constrained problem which computes the optimal download time and quality for video segments. Then, the authors propose a set of heuristics tailored to greedily optimize segment scheduling according to a specific objective function, e.g., maximum quality, minimum streaming interruption, or fairness. Similar objectives are tackled in [7,8] in a lexicographic approach, so that streaming continuity is always prioritized over quality. They first propose a heuristic for the lateness-quality problem that performs almost as good as the MILP formulation. Then, they extend the MILP formulation to include QoS guarantees and they introduce an iterative approximation based on a simpler LP formulation. A further heuristic approach is devised in [57] and accounts for the buffer and channel state prediction. The proposed approach maximizes the streaming quality while guaranteeing that there are no interruptions.
2.1.2.6. Cognitive radio maps
CRs are context-aware wireless devices that adapt their functionalities to changes in the envi-ronment. They have been recently used [165–167] to obtained the so-called Radio Environment Map (REM): a multi-dimensional database containing a wide set of information ranging from regulations to spectrum usage.
For instance, REM are used to predict spectrum availability in CR [165]: the paper exploits cognitive maps to provide contextual information for predictive machine learning approaches such as Hidden Markov Models (HMM), ANN and regression techniques. The construction of these maps is discussed in [166] and the references therein, while their use as enabler for CR networks is analyzed in [167].
In the context of anticipatory networking, REMs are often used as a source of contextual information for the actual prediction technique adopted, rather than as prediction tools them-selves. [168, 169] present two surveys of methodologies and measurement campaigns of spec-trum occupancy. In particular, [168] proposes a cautionary approach to account for measurement uncertainty, while [169] exploits predictors to provide the future channel status. In addition, pre-diction through machine learning approaches is addressed in [170], where different techniques are compared to assess future channel availability.
A similar form of opportunistic spectrum usage goes under the name of white spaces [176]: i.e. channels that are unused at specific location and time. CRs can take advantage of these fre-quencies thanks to dynamic spectrum access. Finally, [177] describes how to exploit CR to realize a complete smart grid scenario; [178] describes how to exploit channel bonding to increase the bandwidth and decrease the delay of CR.
2.1.3. Traffic Context
Although related to the previous context, the papers discussed in this section leverage infor-mation collected from higher layers of the protocol stack. For instance, solutions falling in this category try to predict, among other parameters, the number of active users in the network and the amount of traffic they are going to produce. Similarly, but from the perspective of a single user, the prediction can target the data rate that a streaming application is going to achieve in the near term.
2.1.3.1. Traffic analysis and characterization
Analyzing mobile traffic is fundamental for long-term network optimization and re-configuration. To this end, several pieces of work have addressed such research topics recently.
The work in [109] build regressors for different performance metrics at multiple spatio-temporal granularity for mobile cellular networks. In particular, the authors focus on the char-acterization of per-device throughput, base station throughput and device mobility. A one-week nation-wide cellular network dataset is collected through proprietary traffic inspection tools placed in the operator network and are used to characterize the per-user traffic, cell-aggregate traffic and to perform further spatio-temporal correlation analysis.
A similar scope is addressed by [112] which, on the other hand, focuses more on core network measurements. Flow level mobile device traffic data are collected from a cellular operator’s core network and are used to characterize the IP traffic patterns of mobile cellular devices. More recently, the authors of [110] studied traffic prediction in cloud analytics and prove that optimizing the choice of metrics and parameters can lead to accurate prediction even under high latency.
2.1.3.2. Traffic prediction
maximizes the QoS [84].
Multimedia optimization is the focus in [113]. By predicting throughput, packet loss and transmission delay half a second in advance, the authors propose to dynamically adjust application-level parameters of the reference video streaming or video conferencing services in-cluding the compression ratio of the video codec, the forward error correction code rate and the size of the de-jittering buffer. The authors of [108] propose to use a database of events (con-certs, gatherings, etc.) to improve the quality of the traffic prediction in case of unexpected traffic patterns and in [99], where a general predictive control framework along with Kalman filter is proposed to counteract the impact of network delay and packet loss. The objective of [111] is to build a model for user engagement as a function of performance metrics in the context of video streaming services. The authors use a supervised learning approach based on average bitrate, join time, buffering ratio and buffering to estimate the user engagement. Finally, inter-download time can be modeled [117] and subsequently predicted for quality optimization.
Energy-efficient resource scheduling in mobile radio networks is addressed in [92]. The paper introduces a Mixed Non-Linear Program (MNLP) which returns on a slot basis the optimal allo-cation of resources to users and the optimal users-cell association pattern. The proposed model leverages optimal traffic predictors to obtain the expected traffic conditions in the following slots. Radio resource allocation in mobile radio networks is addressed also in [95] and later by the same authors in [94]; the target is to design a predictive framework to optimally orchestrate the resource allocation and network selection in case one operator owns multiple access networks. The predic-tive framework aims at minimizing the expected time average power consumption while keeping the network (user queues) stable. The core contribution of [96, 97] is the use of deep learning techniques to predict the upcoming video traffic sessions; the prediction outcome is then used to proactively allocate the resources of video servers to these future traffic demands.
2.1.3.3. Throughput prediction
This section considers works predicting or using prediction based on the expected throughput, rather than the traffic prediction. A common characteristic of the work described here is that the spatio-temporal correlation is exploited in the prediction phase of the expected throughp