MULTISLICE CT VIRTUAL ENDOSCOPY IN PRE- AORTIC STENT
GRAFTING: OPTIMIZATION OF SCANNING PROTOCALS
Zhonghua Sun
1, Thanapong Chaichana
2, Wen Jiang
1, Bo Liu
3,
1Department of Imaging and Applied Physics, Curtin University of Technology, Western Australia, Australia 2
Department of Electrical Engineering, King Mongkut’s Institute of Technology Ladkrabang, Thailand 3
University of Traditional Chinese Medicine, China
ABSTRACT
The purpose of this study was to investigate the optimal scanning protocols of multislice CT (MSCT) angiography in pre-aortic stent grafting, visualized on virtual endoscopy (VE). A series of scans were performed on a human aorta phantom with a 16-slice multislice CT scanner with the scanning protocols as follows: section thickness of 1.0/1.5/2.0/3.0 mm, pitch value of 1.0/1.25/1.5, and reconstruction interval of 50% overlap. Signal to noise ratio and standard deviation (SD) of the signal intensity on VE images were measured to determine the image quality in relation to MSCT scanning protocols. Subjective assessment was performed by two observers evaluating the degree of artefacts and the configuration of the renal ostium visualized on VE images. Our results showed that the scanning protocol with a section thickness of 2.0 mm resulted in the highest SNR and lowest SD compared to other protocols (p<0.05). Subjective assessment demonstrated that VE image quality was determined by section thickness, but independent of pitch values. We recommended the scanning protocol of section thickness 2.0 mm, pitch 1.5 with a reconstruction interval of 1.0 mm as the optimal one since it allows optimal visualization of VE images of aortic ostia, fewer artefacts and less radiation dose.
Key words: Computed tomography, virtual endoscopy, image quality, standard deviation, artefacts.
1. INTRODUCTION
Since it was first introduced into clinical practice in 1991, endovascular aortic stent graft repair of abdominal aortic aneurysm (AAA) has been widely accepted as an effective alternative to conventional open surgery, especially in patients with co-morbid medical conditions [1-3]. Unlike conventional open surgical repair, the success of endovascular repair of AAA cannot be ascertained by direct observation and mainly depends on radiological imaging. Helical CT angiography has been regarded as the preferred imaging modality in both pre-stent grafting evaluation and post-pre-stent grafting follow-up
[4, 5]. The recent introduction of multlislice CT (MSCT) has augmented the diagnostic value of CT angiography in aortic stent grafting because of its fast scanning, high spatial resolution and acquisition of nearly isotropic volume data [6].
The role of MSCT angiography in aortic stent grafting has been enhanced by a series of 3D postprocessings, and virtual endoscopy (VE) is a rapidly evolving technology that permits 3D visualization of both intraluminal aortic artery branches and stent wires [7-10]. CT VE has been reported to be valuable in the visualization of encroachment of stent wires to aortic ostia [9-11]. While MSCT is increasingly being installed in medical centres with the number of CT detectors being increased from 4-slice to 16-4-slice and 64-4-slice, MSCT angiography together with subsequent 3D recon-structions will continue to play an important role in planning patients with AAA undergoing endovascular repair. Thus, there is a clear potential for increased radiation doses to patients. Consequently, there is increased attention and necessity to optimize scanning protocol of MSCT angiography with the aim of acquiring acceptable image quality with less radiation dose. Therefore, our purpose in this study was to investigate the optimal scanning protocols in pre-aortic stent grafting, based on visualization of VE images obtained on a 16-slice MSCT scanner.
2. MATERIALS AND METHODS
2.1. Human Aorta Phantom
2.2. MSCT scanning protocols
The scanner used for the study was a Siemens 16-slice CT scanner (Sensation 16; Siemens Medical Systems, Germany). The detector collimation of the scanner is 16x0.75 mm. The rotation time of the CT scanner was 0.5 second and the tube voltage was 120 kVp and tube current was 200 mA for 1.0 mm scanning protocols with pitch of 1.0 and 1.25, and 155 mA for the remaining scanning protocols. A field of view of 94 mm, matrix of 512 x 512 and 180 º linear interpolation algorithms were used to reconstruct the images, resulting in an in-plane resolution of 0.18 X 0.18mm. The phantom was placed on the table of the scanner, parallel to the longitudinal axis. Image data were acquired at section thickness of 1.0 mm, 1.5 mm, 2.0 mm and 3.0 mm, pitch value of 1.0, 1.25 and 1.5, and reconstruction interval of 50% overlap.
After scanning, CT data were burned into CDs and transferred to a separate workstation for image postprocessing. CT volume data were converted from original DICOM (Digital Imaging and Communication in Medicine) images using a commercially available software Analyze V 7.0 (www.Analyzedirect.com, Mayo Clinic, USA) for data processing. A total of 12 data sets were generated. All data sets were reviewed in an unblinded fashion by an experienced radiologist familiar with axial CT and VE images of the abdominal CT scanning (Z S). Effective radiation dose was measured corresponding to each protocol.
2.3. Image analysis-quantitative assessment
Generation of VE images of the renal ostium, superior mesenteric artery and the normal abdominal aorta was obtained from each dataset. A CT threshold value of 300 HU was chosen to remove the contrast medium from the aorta and generation of VE images of the internal surfaces of the phantom was obtained. Detailed description of generating VE images has been described elsewhere [10].
The stair-step artefacts were determined by measuring the pixel intensity on the surfaced rendered VE image. Consistent settings in each image were required for ensuring greater accuracy. Standard deviation (SD) of the pixel values was used to measure the degree of stair-step artefacts observed on VE images. A higher SD indicates more variation in the pixel intensity, therefore demonstrating greater existence of artefacts resulting in poor image quality. Measurements of SD were taken at three anatomic locations, namely superior mesenteric artery (SMA) ostium, right renal ostium and the normal abdominal aorta using a line profile [13].
Similarly, signal to noise ratio (SNR), calculated as the ratio of CT attenuation and SD was measured in the above-mentioned three locations in order to determine the relationship between image quality and scanning protocols.
2.4. Image analysis-subjective assessment
The purpose of the subjective assessment was to determine the optimum MSCT scanning protocols from a clinical perspective. All examinations were evaluated by two independent experienced reviewers (WJ, BL). The reviewers were blinded to the scanning protocols and recorded their assessment of the following two aspects based on a 4-point scale scoring method:
h Clarity of the renal ostium. Score 1 indicates that the renal ostium was not visualized, 2 visualized but distorted, 3 visualized and normal and 4 visualized and perfect appearance;
h Presence and degree of stair-step artefacts. Score 1 indicates marked artefacts, 2 moderate, 3 minimal and 4 no artefacts.
2.5. Statistical analysis
The results were analysed using SPSS 14.0 for Windows (SPSS, Inc, Chicago) to determine the relationship between the SNR, SD, radiation dose and variable scanning parameters (section thickness, pitch and reconstruction interval). A p value < 0.05 was considered to be a statistically significant difference.
Three-factor experimental design was employed. The factors were section thickness, pitch value and reconstruction interval. The SNR and SD of signal intensity were measured at three features, namely SMA, renal ostium, and normal abdominal aorta. There were two determinations of SNR and SD undertaken for each of the 12 cells defined by the factorial design. An analysis of variance of the resulting data, in accordance with the factorial design, was computed for each of the features.
Interobserver agreement for the evaluation of VE images was assessed with the kappa (k) statistics. Degrees of agreement were categorised as follows: k values of 0.00-0.20 were considered to indicate poor agreement; k values of 0.21-0.400, fair agreement; k values of 0.41-0.60, moderate agreement; k values of 0.61-0.80, high agreement; and k values of 0.81-1.00, excellent agreement.
3. RESULTS
3.1. Quantitative assessment of VE image quality
protocols at renal ostium and normal aorta, indicating the highest image noise generated with 1.0 mm section thickness.
MSCT scanning protocols Signal to noise ratio Section
thickness (mm)
Pitch Reconstruction
interval (mm) RRA SMA
Normal aorta
1.0 1.00 0.5 58 50 59
1.0 1.25 0.5 60 51 61
1.0 1.50 0.5 54 52 59
1.5 1.00 0.7 70 68 63
1.5 1.25 0.7 76 66 58
1.5 1.50 0.7 57 64 67
2.0 1.00 1.0 82 69 77
2.0 1.25 1.0 86 72 73
2.0 1.50 1.0 66 64 79
3.0 1.00 1.5 88 102 72
3.0 1.25 1.5 62 63 55
3.0 1.50 1.5 66 75 61
Table 1.SNR measurements in three anatomic locations. SMA-superior mesenteric artery, RRA-right renal artery
Figure 1. SNR measured in the renal artery ostium with variable section thicknesses.
Table 2 shows the SD measured in all of the scanning protocols in the study. It is clearly shown that the mean SD was measured the highest with 1.0 mm scanning protocol, and the lowest with 2.0 mm scanning protocol in the location of SMA, reaching statistically significant difference (p<0.05), as shown in Fig 2. SD was independent of section thickness or pitch value in the other two anatomic locations. Effective radiation dose was higher with 1.0 mm scanning protocol that that with other scanning protocols, although this did not reach statistically significant difference.
MSCT scanning protocols SD
Dose (mSv) Section
thickness (mm)
Pitch Reconstruction
interval (mm) RRA SMA Aorta
1.0 1.00 0.5 5.5 15.1 5.5 15.60
1.0 1.25 0.5 5.5 13.9 5.0 15.60
1.0 1.50 0.5 5.7 13.1 7.1 12.09
1.5 1.00 0.7 6.0 8.2 5.9 12.09
1.5 1.25 0.7 6.6 8.8 6.7 12.09
1.5 1.50 0.7 7.0 9.6 6.8 12.07
2.0 1.00 1.0 7.8 8.2 8.2 12.09
2.0 1.25 1.0 7.6 5.3 7.5 12.07
2.0 1.50 1.0 6.4 8.3 7.0 12.09
3.0 1.00 1.5 6.8 17.8 5.5 12.09
3.0 1.25 1.5 6.8 10.2 5.1 12.07
3.0 1.50 1.5 8.4 11.3 6.2 12.07
Table 2.SD measurements in three anatomic locations. SMA-superior mesenteric artery, RRA-right renal artery
Figure 2. SD measured in SMA ostium with variable section thicknesses.
3.2. Subjective assessment of VE image quality
Table 3 shows that the mean scores from subjective visual assessment of the renal ostium by two reviewers which ranged from to 3.5 to 4. A renal ostium was required to be smooth or perfect configuration to be accepted for clinical diagnosis. Therefore, it was noted that all of the scanning protocols were acceptable. It was also found that visualization of the renal ostium was independent of the section thickness or pitch values
MSCT Scanning protocols Mean scores Section
thickness (mm)
Pitch Reconstruction interval (mm)
Stair-step artefacts
Renal ostium
1.0 1.00 0.5 3 4
1.0 1.25 0.5 3.5 4
1.0 1.50 0.5 3 3.5
1.5 1.00 0.7 2 4
1.5 1.25 0.7 2 3
1.5 1.50 0.7 2 4
2.0 1.00 1.0 2 3
2.0 1.250 1.0 1.5 3
2.0 1.50 1.0 2.5 4
3.0 1.00 1.5 1 3
3.0 1.25 1.5 1 3
3.0 1.50 1.5 1 4
There was excellent agreement between two reviewers in the assessment of VE image quality for evaluation of renal ostium with a kappa value of 0.833, and moderate agreement for assessment of the degree of stair-step artefacts with a kappa value of 0.722.
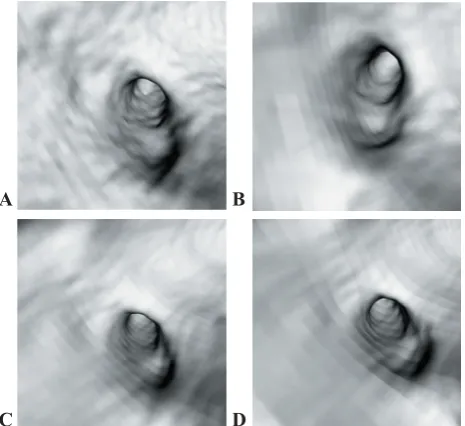
Figures 3-4 show examples of the effect of section thickness and pitch on the visualization of the renal artery ostium with regard to the degree of stair-step artefacts and the configuration of renal ostium. It is clearly demonstrated that image quality observed in the renal artery ostium was affected when the section thickness increased to 3.0 mm as apparent artefacts affected visualization of the ostium, while image quality is irrelevant of pitch values.
A B
C D
Figure 3. VE images were acquired with variable section thickness of 1.0 mm, 1.5 mm, 2.0 mm and 3.0 mm, pitch 1.0 with reconstruction interval of 50% section thickness (A-D). It was noted that renal ostium was normal at all of these images, however, the degree of stair-step artefacts was scored to be minimal or moderate at 1.0, 1.5 and 2.0 mm (A-C), while it became marked while section thickness reached to 3.0 mm (D).
A B C
Figure 4. VE images were acquired with the same section thickness of 2.0 mm, variable pitch values of 1.0, 1.25 and 1.5 (A-C). The renal ostium remained normal at all images, and the stair-step artefact was scored to be moderate by two reviewers at these three images, indicating that image quality was independent of pitch values.
4. DISCUSSION
Helical CT angiography has been widely used as a preferred imaging modality in both pre-and post-aortic stent grafting [4, 5]. MSCT is the latest development in CT technology and is now becoming widely available worldwide. With rapid introduction of 16-slice and 64-slice scanners, the diagnostic performance of MSCT angiography in clinical practice has been significantly increased due to high spatial and temporal resolution compared to earlier 4-slice scanners [14, 15]. MSCT VE is currently being assessed as an additional 3D image method to conventional imaging techniques for pre-operative planning and post-pre-operative follow-up of aortic stent grafts [12, 16]. Few data exist however, on issues regarding MSCT VE acquisition parameters. We consider it important to optimize the MSCT scanning protocol as the examination involves radiation to patients, thus the effect of radiation exposure at MSCT scanning must be taken into account while assessing its diagnostic performance in aortic stent grafting.
is performed with a relatively thick section thickness such as 3 mm, as observed in the current study, VE image quality is compromised due to the increased degree of stair-step artefacts. Therefore, MSCT protocols with thicker slice thickness (>2 mm) should be avoided in imaging of aortic stent grafting.
Although 2D axial images are essential for the assessment of abdominal aortic aneurysm prior to endovascular repair, 3D reconstructions are often required to complement the 2D axial images to provide required information for preoperative planning of endovascular repair of AAA [9, 17]. Currently, 3D MSCT reconstructions have become a part of the clinical protocol and this has been widely used as an effective alternative to conventional angiography for preoperative planning and the post-operative follow-up of aortic stent grafts [17]. Most of the postprocessings are based on multiplanar reformation and maximum-intensity projection, while CT VE is considered to be valuable for vascular surgeons to assess the morphological change of the renal ostium which might be caused by the deployment of suprarenal stents across the renal arteries [8, 9, 11]. A combination of morphological change of renal ostium and presence of stent wires in front of the ostium could lead to the interference with renal artery patency or renal function from a long-term point of view, although this needs to be confirmed in further studies. Another potential area that VE has a role to play is in the postoperative follow-up of fenestrated stent graft, which is a modified technique to treat patients with complicated AAA [18, 19].
The phantom was designed to simulate conditions comparable to in vivo MSCT angiography. The renal arteries are not always parallel to the axial plane and sometimes have an oblique course. In this study, we built the aorta phantom based on real patient data with an infrarenal AAA. The size of the aorta and its branches were the same size as in a real patient. The contrast medium was diluted to the CT attenuation similar to that used in a routine abdominal CT angiography. Therefore, results obtained from the phantom were applicable to clinical studies.
In general, radiation dose is proportional to the tube current, the exposure time, and the square of tube potential. The tube potential can be adjusted to control the radiation dose. Studies have shown that radiation dose can be reduced by reducing tube potential in chest and abdominal CT angiography without significantly compromising signal to noise ratio and contrast to noise ratio [20, 21]. In addition, tube current modulation also allows reduction of radiation dose in chest and abdominal CT scanning [22]. The relatively high radiation dose generated from 1.0 mm scanning protocol in our study could be caused by the high mAs (200) compared to the lower mAs in other protocols (155). However, the effective dose of 12.07 mSv measured in our study is still higher than the mean value (5.3-7.1 mSv) in routine abdominal CT scan which was reported by the UK dose review [23]. Therefore, these factors should be optimized
when carrying out MSCT scanning in order to keep the radiation dose as low as reasonably achievable.
We do acknowledge some limitations in our study. The phantom used for the study was built from a typical patient data, however, there is no blood flow in the phantom which does not really simulate the real environment. Also the wall of the phantom has a higher attenuation (170-200 HU) than that of soft tissues of normal abdominal aorta, which may have caused some streak artefacts on VE images. The study was performed in a static environment with CT attenuation remaining constant throughout the scanning of the phantom, however, in patients scanning, the blood flows inside the aorta creating dynamic environment. Thus, the contrast density varies along the abdominal aorta which may affect image quality. Although the current and previous studies confirmed that thinner collimation does not lead to optimal scanning protocol, this needs to be confirmed on 64-slice scanners since 64-slice scanners have become widely available in clinical centres. Finally, we only chose a small range of section thicknesses (1 mm to 3 mm), and did not include thickness more than 3 mm as we consider that the section thickness more than 3 mm is not routinely used in MSCT angiography performed with the current 16- and 64-slice scanners. Addition of more section thicknesses in the study could make our results more convincing.
5. CONCLUSION
Our results showed that an optimal 16-slice MSCT scanning protocol could be obtained with a section thickness of 2.0 mm, pitch 1.5 and reconstruction interval of 1.0 mm as it allows generation of VE images with fewer artefacts, less radiation dose and acceptable image quality for clinical diagnosis. With the increased application of 16-slice and 64-slice MSCT scanners in clinical practice including the continuing application in aortic stent grafting, our findings are useful for optimization of the MSCT scanning protocol as it provides guidance for clinicians to appropriately utilise the latest imaging technique. Further studies correlating 64-slice with 16-slice MSCT with regard to the optimal scanning protocol in aortic stent grafting deserve to be investigated.
ACKNOWLEDGEMENTS
The authors would like to Mr. Gil Stevenson for his assistance in the statistical analysis of the results.
REFERENCES
[2] P. Cao, F. Verzini, G. Parlani, L. Romano, P. De Rango, V. Pagliuca, and G. Iacono, “Clinical effect of abdominal aortic aneurysm endografting: 7-year concurrent comparison with open repair,” Journal of Vascular Surgery, vol. 40, no. 5, pp. 841-848, Nov. 2004.
[3] M. Prinssen, E.L. Verhoeven, J. Buth J, P.W. Cuypers, M.R. van Sambeek, R. Balm, E. Buskens, and D.E. Grobbee, J.D. Blankensteijn, “A randomized trial comparing conventional and endovascular repair of abdominal aortic aneurysms,”New England Journal of Medici,.vol. 14, no. 351, pp. 1607-1618, Oct. 2004.
[4] I.A.M.J. Broeders, J.D. Blankensteijn, M. Olree, W. Mali, and B.C. Eikelboom, “Preoperative sizing of grafts for transfemoral endovascular aneurysm management: a prospective comparative study of spiral CT angiography, arterial angiography and conventional CT imaging,”Journal of
Endovascular Surgery, vol. 4, pp. 252-261, 1997.
[5] M.D. Armerding, G.D. Rubin, C.F. Beaulieu, S.M. Slorium, E.W. Olcott, S.L. Samuels, M.L. Jorgensen, C.P. Semba, R.Bjr. Jeffrey, and M.D. Dake. “Aortic aneurysmal disease: Assessment of stent-grafted treatment-CT versus conventional angiography,”Radiology,vol. 215, no.1, pp. 138-146, Apr. 2000.
[6] H. Hu, H.D. He, W.D. Foley, and S.H. Fox, “Four multidetector-row helical CT: image quality and volume coverage speed,” Radiology, vol. 215, pp. 55-62, 2000.
[7] E. Neri, C. Bonanomi, and R. Vignali R, “Spiral CT virtual endoscopy of abdominal arteries: clinical applications. Abdominal Imaging” vol. 25, pp. 59-61, 2000.
[8] Z. Sun Z. and H. Zheng, “Effect of suprarenal stent struts on the renal ostia with ostial calcification observed in CT virtual intravascular endoscopy,” European Journal of Vascular
Endovascular Surgery, vol. 8, pp. 534-542, 2004.
[9] Z. Sun Z, J. Winder, B. Kelly, P. Ellis, P. Kennedy P, and D. Hirst, “Diagnostic value of CT virtual intravascular endoscopy in aortic stent grafting,” Journal of Endovascular
Therapy, vol. 11, no. 1, pp. 13-25, Feb. 2004.
[10] Z. Sun Z, J. Winder, B. Kelly, P. Ellis, and D. Hirst, “CT virtual intravascular endoscopy of abdominal aortic aneurysms treated with suprarenal endovascular stent grafting,”Abdominal
Imaging, vol. 28, no. 4, pp. 580-587, Aug. 2003.
[11] Z. Sun, “3D visualization of stent graft migration in transrenal fixation of aortic stent graft: Mid-term follow-up,”
Journal of Endovascular Therapy,vol. 13, no. 1, pp. 85-93, Jan.
2006.
[12] Z. Sun, and C. Ferris, “Optimal scanning protocol of multislice CT virtual intravascular endoscopy in pre-aortic stent grafting: in vitro phantom study,” European Journal of
Radiology, vol. 58, pp. 310-316, 2006.
[13] Z. Sun Z, J. Winder, B. Kelly, P. Ellis, P. Kennedy P, and D. Hirst, “Assessment of VIE image quality using helical CT angiography: in vitro phantom study,” Computerised Medical
Imaging and Graphics, vol. 28, pp. 3-12, 2004.
[14] N.R. Mollet, F. Cademartiri, and G.P. Krestin GP, “Improved diagnostic accuracy with 16-row multislice
computed tomography coronary angiography,” Journal of
American College of Cardiology, vol. 45, pp. 128-132, 2005.
[15] G.L. Raff, M.J Gallagher, and W.W. O’Neill, “Diagnostic accuracy of non-invasive coronary angiography using 64-slice spiral computed tomography,”Journal of American College of
Cardiology, vol. 46, pp. 552-557, 2005.
[16] Z. Sun, and E. Gallagher, “Multislice CT virtual intravascular endoscopy for abdominal aortic aneurysm stent grafts,”Journal of Vascular and Interventional Radiology, vol. 15, pp. 961-970, 2004.
[17] Z. Sun. “3D multislice CT angiography in post-aortic stent grafting: A pictorial essay,”Korean Journal of Radiology,vol. 7, pp. 205-211, Sep. 2006.
[18] B.E. Muhs, E.L. Verhoeven, C.J. Zeebregts, I.F. Tielliu, T.R. Prins, H.J. Verhagen, and J.J. van Den Dungen, “Mid-term results of endovascular aneurysm repair with branched and fenestrated endografts,”Journal of Vascular Surgery, vol. 44, no. 1, pp. 9-15, Jul. 2006.
[19] Z. Sun, Y.B. Allen, S. Nadkarni, R. Wright, D.E. Hartley, and M.M.D. Lawrence-Brown, “CT virtual intravascular endoscopy in the follow-up of fenestrated endovascular grafts,”
Journal of Endovascular Therap,vol. 15, no. 1, pp. 42-51, Jan.
2008.
[20] J.E. Wilderberger, A.H. Mahnken, and T. Schmiz-Rode T, “Individually adapted examination protocos for reduction of radiation exposure in Chest CT,” Investigative Radiology, vol.36, pp. 604-611, 2001.
[21] Wintersperger B, Jakobs T, Herzog P, and et al, “Aorto-iliac multidetector-row CT angiography with low kV setting: improved vessel enhancement and simultaneous reduction of radiation dose,” Eur Radiol, vol. 15, pp. 334-341, 2005.
[22] Tack D, De Maertelaer V, and Gevenois PA, “Dose reduction in multidetector CT using attenuation-based online tube current modulation,”Am J Roentgenol, vol.181, pp. 331-334, 2003.