Article
1
Energy-Based Design Criterion of Dissipative
2
Bracing Systems for Seismic Retrofit of Frame
3
Structures
4
Gloria Terenzi 1*
5
1 Department of Civil and Environmental Engineering, University of Florence, Italy; [email protected]
6
* Correspondence: [email protected]; Tel.: +39-55-275-8887
7
Featured Application: An energy-based sizing criterion is proposed to help designing dissipative
8
bracing systems incorporating fluid viscous spring-dampers for seismic retrofit of frame
9
structures.
10
Abstract: Direct sizing criteria represent useful tools in the design of dissipative bracing systems for
11
the advanced seismic protection of existing frame structures, especially when incorporated dampers
12
feature a markedly non-linear behaviour. An energy-based procedure is proposed herein to this
13
aim, focusing attention on systems including fluid viscous devices. The procedure starts by
14
assuming prefixed reduction factors of the most critical response parameters in current conditions,
15
which are evaluated by means of a conventional elastic finite element analysis. Simple formulas
16
relating the reduction factors to the equivalent viscous damping ratio of the dissipaters, ξeq, are
17
proposed. These formulas allow calculating the ξeq values that guarantee the achievement of target
18
factors. Finally, the energy dissipation capacity of the devices is deduced from ξeq, finalizing their
19
sizing process. A detailed description of the procedure is presented in the article, by distinguishing
20
the cases where the prevailing structural deficiencies are represented by poor strength of the
21
constituting members, from the cases having excessive horizontal displacements. A demonstrative
22
application to the retrofit design of a reinforced concrete gym building is then offered to explicate
23
the steps of the sizing criterion in practice, as well as to evaluate the enhancement of seismic
24
response capacities generated by the installation of the dissipative system.
25
Keywords: energy dissipation; dissipative braces; design criteria; seismic retrofit; frame structures.
26
27
1. Introduction
28
Dissipative bracing systems are increasingly adopted in anti-seismic design of new frame
29
structures, as well as to retrofit existing ones. Several types of technologies have been implemented,
30
capable of supplying supplemental damping and horizontal stiffness in different proportions,
31
depending on the mechanical characteristics of dissipaters and their installation layout. By way of
32
example, metallic yielding devices, like ADAS (Added Damping and Stiffness) components [1-2],
33
typically provide significant contributions in terms of both properties. On the other hand, fluid
34
viscous dissipaters, when mounted at the tip of supporting braces in parallel with the overlying beam
35
axis [3], slightly increase the horizontal stiffness of the structural system, while supplying high
36
additional damping.
37
A further spreading of dissipative bracing technologies in the professional community strongly
38
depends on the availability of simple and intuitive design procedures, especially concerning the
39
preliminary sizing of dissipaters. The first methods offered in literature start from setting the desired
40
damping ratio (i.e. the ratio of the damping coefficient to the critical damping coefficient) in the
41
fundamental mode of vibration of the structure, in the hypothesis that the relevant effective modal
42
mass (EMM) is a predominant portion of the total seismic mass [4-8]. In general, the practical
43
application of these methods consists in examining the response spectra at various damping ratios
44
and choosing the value that allows constraining the maximum “global” response parameters (base
45
shear, top lateral displacements, etc) within targeted acceptable limits. When the devices are
46
characterized by non linear viscous properties, the same objectives can be reached by transforming
47
relevant damping coefficients into equivalent linear viscous coefficients [9-10]. These studies have
48
provided the basis for the design procedures of buildings incorporating passive energy dissipation
49
systems included in ASCE 41-06 [11] and ASCE 7-10 [12] Standards.
50
Along the same conceptual line, some procedures based on the use of normative response
51
spectra scaled by reduction factors corresponding to the damping capacity of the devices have been
52
proposed more recently [13-14], where reference is made to damping ratio values no greater than 0.3.
53
Other approaches use equivalent linear or non-linear static analyses to evaluate the design actions
54
and reduce their effects through added damping [15]. All the above-mentioned procedures are
55
conceived for substantially regular structures. Few solutions are found for problems characterized
56
by significant irregularities in plan and/or in elevation. Among these, a method based on properly
57
calibrated expressions of the damping ratio derived from the results of non-linear dynamic analyses
58
is formulated in [16, 17].
59
An alternative approach is represented by an energy-based design criterion, first proposed for
60
fluid viscous dissipaters [3, 18], and later extended to ADAS elements [19]. This criterion consists in
61
determining the minimum damping coefficients of the devices required to assign them the capability
62
of dissipating a prefixed fraction, β, of the seismic input energy, EI, computed on each story [18, 19]
63
or the entire structure [20]. To facilitate the choice of β, preferable ranges were provided for several
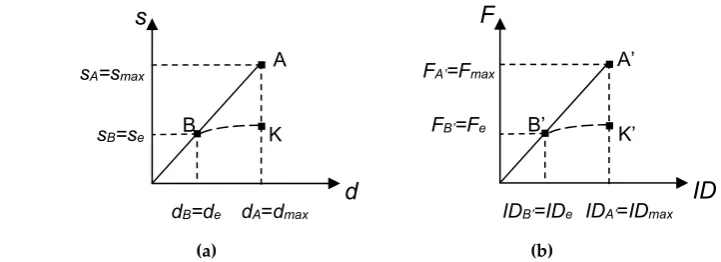
64
different structural types, and checked in relation to the assumed design targets [3, 18-20]. However,
65
as the method requires a preliminary evaluation of the seismic input energy demand on the original
66
structure, a finite element time-history analysis must be carried out first, and EI post-calculated from
67
the results. Although an energy calculation can be performed with the help of commercial finite
68
element programs by means of simple input instructions, professional engineers are not always
69
familiar with this design approach, and may be discouraged from using it.
70
In view of this, a new procedure that bypasses this initial step by directly estimating the
71
minimum damping capacity to be assigned to the dissipaters is proposed in this paper, where
72
attention is focused on the retrofit design of reinforced concrete (RC) structures. The procedure starts
73
by assuming prefixed α reduction factors of the most critical response parameters in current
74
conditions, which are evaluated by means of a conventional elastic finite element analysis. Simple
75
formulas relating the α factors to the equivalent viscous damping ratio of the dissipaters, ξeq, are
76
proposed. These formulas allow calculating the ξeq values guaranteeing the achievement of the target
77
α factors. Finally, the energy dissipation capacity of the devices is deduced from ξeq, finalizing their
78
sizing process.
79
A detailed description of the method is presented in the next Section. A demonstrative
80
application to the retrofit design of a RC gym building is then offered, to explicate relevant steps in
81
practice. Finally, a performance assessment analysis of the structure in original and retrofitted
82
conditions is carried out to evaluate the enhancement of seismic response capacities produced by the
83
2. Design Procedure
85
The design procedure is based on the assumption that for relatively stiff structures, i.e. with
86
fundamental translational vibration period in current conditions, T1cs, below 0.8 s, a substantial
87
improvement of seismic performance can be reached by incorporating a supplemental damping
88
system with limited stiffening capacity. For structures with a greater fundamental translational
89
period, a supplemental stiffness contribution helps control lateral displacements better, which
90
prevents an over-dissipation demand to the damping technology adopted.
91
In the following, attention is focused on the first class of structures, where the retrofit design
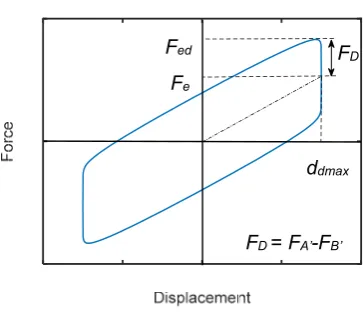
92
objectives can be met by the added damping, with a marginal role of supplemental stiffness. This
93
prompts to select bracing systems that incorporate pressurized FV spring-dampers as protective
94
strategy. Indeed, the spring component of the devices, acting in-series with the steel braces,
95
remarkably constrains the total horizontal translational stiffness of these systems. This results in a
96
moderate contribution (normally below 10%) to the lateral stiffness of the retrofitted structures.
97
The α reduction factors are calibrated on the mechanical characteristics of this type of devices.
98
For dampers adding a non negligible supplemental stiffness, the procedure follows the same steps,
99
but different criteria for the evaluation ofα are
required, which will be detailed in a further step of
100
this research.
101
In view of the practical application of the design method, a distinction is made between the cases
102
where the prevailing structural deficiencies are represented by poor shear or bending moment
103
strength of columns and/or beams — where α is intended as “stress-related” reduction factor, named
104
αs
in the following — and the cases having excessive horizontal displacements, where
αis intended
105
as “deformation-related” reduction factor, αd
.
106
2.1. Structures with Poor Shear or Bending Moment Strength of Constituting Members
107
The basic design objective of supplemental damping-based retrofit interventions is always a
108
significant enhancement of seismic performance as compared to the original structural conditions.
109
When high-damping capacity dissipaters are adopted, like pressurized FV devices, the attainment of
110
the Immediate Occupancy (IO) seismic performance level can be planned up to the maximum
111
considered earthquake (MCE), with reasonable costs and architectural impact. This objective
112
corresponds to keep the response of the structural members within the elastic field, thus replacing
113
the plastic demand in current conditions with the dissipative action of the protective system. The
114
design procedure is based on this target, and articulated in the four steps described below.
115
1. Development of an elastic finite element verification analysis and relevant stress state checks in
116
current conditions.
117
The shear and bending moment-related stress states in columns and beams are calculated by
118
means of an elastic finite element (either modal superposition with response spectrum or
time-119
history) analysis of the structure in current conditions. Then, the maximum stress states are checked
120
by comparison with the corresponding elastic limit values for the two axes in plan of the reference
121
Cartesian coordinate system, X and Y (Z being the vertical axis). The shear and bending moment
122
a c j,
V and Maj,c, where index j refers to the axis (j=X,Y), c denotes the “critical” member(s), and a
124
means that the values are derived from the elastic assessment analysis.
125
2. Evaluation of the target stress reduction factors,αs.
126
This evaluation is carried out by referring to the scheme in Figure 1a, where d, s represent general
127
deformation-related and stress-related parameters for the critical member(s). The objective of the
128
retrofit design consists in reducing the seismic demand in current state calculated by the elastic
129
analysis in step 1 — denoted by point A with coordinates (dA=dmax, sA=smax), where dmax, smax are the
130
maximum d and s computed values — below point B with coordinates (dB=de, sB=se), where de, se are
131
the elastic limit deformation-related and stress-related parameters for the critical member(s),
132
respectively. On the contrary, in a traditional design approach the reduction of the force-related
133
parameter is pursued by exploiting the ductile plastic response of the structural members, by moving
134
the maximum response point from A to K, with coordinates (dA, sB).
135
136
137
138
139
140
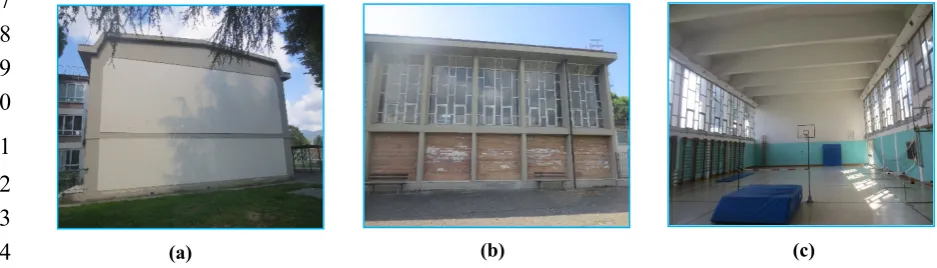
(a) (b)
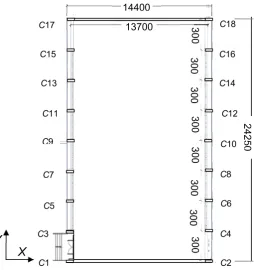
141
Figure 1. Schematic response of the critical structural member (a) and the frame structure storey to which
142
it belongs (b).
143
Hence, the force reduction factor, αs, targeted to reach an elastic response of the critical member
144
(and thus of all remaining members) when passing from original to retrofitted conditions, is given
145
by:
146
B A s
s s
=
α (1)
147
The sA and sB parameters in Figure 1 are detailed below according to the specific lack of strength
148
affecting the structural members in original conditions.
149
2.a. Lack of shear strength.
150
In this hypothesis, sA is the shear force in the critical member, Vj,ac, according with the notation
151
introduced in step 1. Said Vj,ec= sB the elastic limit shear of this member, αs — specified in this
152
hypothesis as αVj— is evaluated as follows:
153
A
B
dB=de dA=dmax
d
s
K
sB=se
sA=smax
FB’=Fe
FA’=Fmax A’
B’
IDB’=IDe IDA’=IDmax
ID
F
e c j a
c j
B A Vj s
V V s s
, ,
=
=
=
αα (2)
154
2.b. Lack of bending moment strength.
155
Similarly to point 2.a, when the critical stress-related parameter sA is the bending moment Maj,c
156
(associated with the concurrent axial force, Nc, if the critical member is a column), said Mej,c= sB the
157
corresponding elastic limit moment, the reduction factor
α
s — denoted with symbol αMj in this158
case — is given by:
159
e c j a c j
B A Mj s
M M s s
, ,
=
=
=
αα (3)
160
2.c. Passage from member to storey (αs→αF).
161
The A→B transition in the most critical member, governed by factor αVj or αMj, implies a
162
similar shift in the response of the frame structure storey to which the member belongs. This is
163
visualized in the graph of Figure 1b, where the storey shear, F, and the inter-storey drift, ID, are
164
assumed as response parameters, and the member response points A and B are replaced by the
165
corresponding storey response points A’, with coordinates (FA’=Fmax, IDA’=IDmax) and B’, with
166
coordinates (FB’=Fe, IDB’=IDe), where indexes “max” and “e” denote the maximum response value and
167
the corresponding elastic limit in this case too. Based on this correlation, the storey response points
168
A’, B’ in Figure 1b are reached when the critical member attains points A, B in Figure 1a. Therefore,
169
the reduction factor at the storey level, αF
:
170
' ' α
B A F
F F
=
(4)171
coincides with αVj or αMj, depending on the lack of strength assessed in the most critical member.
172
3. Correlation of αF
to the dissipated energy,
ED, and the equivalent viscous damping ratio, ξeq, of173
the spring-dampers.
174
The correlation is established consistently with the design objective of reducing storey response
175
from point A’ to point B’, thanks to the incorporation of the protective system. The sizing of the
176
dissipaters is performed first by evaluating their equivalent viscous damping ratio, ξeq, using the
177
general expression:
178
e D eq
E E
4π
=
ξ (5)
where ED is the energy dissipated by the set of FV spring-dampers installed on the storey containing
180
the critical member, and Ee is the strain energy of the system estimated by referring to the global
181
response cycle of the set of devices, schematically drawn in Figure 2. Therein, ddmax is the maximum
182
displacement, FD is the damping force component, Fe is the elastic reaction force, and Fed
=
Fe+
FD183
is the total reaction force.
184
185
186
187
188
189
190
191
192
193
194
Figure 2. Schematic response cycle of the set of FV spring-dampers installed on a storey and parameters
195
for evaluatingξeq.
196
In order to meet the design objective of passing from point A’ to point B’, FD is set as equal to the
197
difference between FA’ and FB’:
198
B' A'
D F F
F
=
− (6)199
In doing so, the reduction of storey response is totally assigned to the dissipative action of the
200
protective system, as planned by this retrofit strategy. Substituting (4) in (6), the following FD
201
expression is obtained:
202
)
1−
=
−
=
−
=
A' B' αF B' B' B' αFD F F F F F
(
F (7)
203
from which it follows:
204
)
(
FD B'
F F
1
−
=
α (8)
205
The Fe elastic force component is set as equal to the elastic limit value of the storey shear, FB’.
206
Therefore, Fed can be alternatively expressed as a function either of FD:
207
1)
1) α −
α +
− (α +
+
=
=
=
=
F F D D F
D D
B' D e ed
( F F F F
F F F
F (9)
208
or of Fe, substituting (8) in (9):
209
e F ed F
F
=
α (10)210
Fed
Fe
FD = FA’-FB’
ddmax
By referring to the response cycle in Figure 2 and relevant parameters, the following expressions
211
of ED and Ee are derived:
212
dmax D D F d
E
=
4 (11)213
2
/ d F
Ee
=
ed dmax (12)214
Substituting (11) and (12) in (5), the following ξeq expression is deduced:
215
2) 4π
4
/ d F
d F
dmax ed
dmax D eq
(
=
ξ
(13)216
Introducing (8) and (9), (13) becomes:
217
F F eq
α − α π
ξ
=
2 ( 1) (14)218
which allows directly quantifying the equivalent viscous damping ratio demanded to obtain the
219
targeted elastic response up to the MCE, simply as a function of the reduction factor αF
. Moreover,
220
by solving (5) to express ED as a function of ξeqand considering (10), the following relation is obtained:
221
dmax F eq e F F
eq dmax ed F
eq e F
D E F d / F d
E (α )
=
4π ξ (α )=
4π( 2)ξ (α )=
2πα ξ (α ) (15)222
4. Evaluation of the energy dissipation capacity of the dissipaters, ED,and selection of the devices
223
with the nearest mechanical characteristics.
224
The basic design objective of reaching an elastic response of the most critical member(s), and
225
thus of relevant storey, implies that the maximum storey drift in retrofitted conditions, IDmax, is
226
constrained below the corresponding elastic limit IDB’=IDe displayed in Figure 1b. IDmax is given by
227
the sum of ddmax and the interstorey drift contribution provided by the braced structure. The latter is
228
normally small, because relatively stiff structures — i.e. with T1cs below about 0.8 s — are dealt with,
229
as mentioned above, and also because the bracing system produces in any case a stiffening effect,
230
although limited by the special installation layout of the FV spring-dampers. In view of this, in order
231
to quickly pre-estimate the energy dissipation capacity of the devices, which is a function of ddmax —
232
other than of FD — ddmax is set as equal to IDe at this stage. Based on this assumption, the energy
233
dissipation capacity to be assigned to the FV devices on the considered storey is drawn from (11):
234
e D D F ID
E
=
4 (16)235
In order to express ED as a function of structure-related terms only, (8) is substituted in (16), and
236
gives:
237
e F
e F
D( F ID
E α )
=
4 (α −1) (17)Relation (15) can be equivalently adopted to this aim:
239
e F eq e F F
D( F ID
E α )
=
2πα ξ(
α)
(18)240
The sizing process of the spring-dampers is concluded — for each storey — by selecting from
241
the manufacturer’s catalogue [21] the device with the nearest energy dissipation capacity to the ED
242
value estimated by (17) or (18), and a stroke approximately equal to IDe.
243
2.2 Structures with Excessive Inter-Storey Drifts
244
The attainment of an elastic structural response up to the MCE is assumed as the basic design
245
objective also when the poorest response capacity is in terms of storey drifts. This is more likely
246
verified in structures with translational period T1cs next to the 0.8 s value approximately fixed as
247
upper limit for the application of the procedure. The design objective is reached by reducing the
248
maximum inter-storey drift computed in current conditions, identified by IDA’=IDmax in Figure 1b, to
249
the corresponding elastic limit IDB’=IDe, i.e. scaling the drift response by a deformation-related
250
reduction factor, αd:
251
e max
B' A' d
ID ID ID
ID
=
=
α (19)
252
When an elastic finite element assessment analysis is carried out on the original structure, αd is
253
proportional to αF
. For cases where an inelastic evaluation analysis is developed, assuming a typical
254
degrading strength and degrading stiffness post-elastic behaviour — like the one qualitatively
255
schematized by curve B’-K’ in Figure 1b — αd significantly differs from αF. Therefore, the expressions
256
of ED and
ξ
eqmust be reformulated as a function of
αd, to allow quickly estimating both quantities257
also for the structures where inter-storey drift is the critical response parameter.
258
Starting from relation (13), the two changes introduced as compared to Section 2.1 consist in
259
assuming ddmax=IDA’–IDB’=IDmax–IDe, and Fed=FK’=FD. The first assumption corresponds to assign the
260
dampers the capacity of absorbing the post-elastic displacement demand of the structure computed
261
in original conditions, so as to meet the design objective of limiting its response to the elastic field,
262
after retrofit. The second assumption derives from the fact that the displacement performance
263
enhancement must be achieved essentially by means of the dissipative capacity of the FV devices, by
264
neglecting at the sizing stage the slight stiffening effects related to their elastic spring function. Then,
265
according to (19), the following ξeq expression is obtained:
266
1) π
2
2) 4π
) (
4
2) 4π
) (
4
− α −
−
α
=
=
=
ξ
de ed
e max D
e ed
B' A' D d
eq (
/ ID (F
ID ID
F /
ID (F
ID ID F
( ) (20)
267
By referring to (13), the corresponding energy dissipation capacity to be assigned to the dampers
268
on the considered storey results as follows:
269
e d eq e d
D( F ( ID
E α )
=
2π ξ α ) (21)Similarly to the case of poor strength of members, the tentative design choice of the device is
271
carried out by referring to the spring-damper with the nearest energy dissipation capacity to ED,
272
estimated by (20), and stroke equal to (IDmax–IDe).
273
3. Geometrical and Structural Characteristics of the Case Study Building
274
The case study examined for a first demonstrative application of the design criterion is the gym
275
in a school in Florence, built in 1971, two external views and an internal view of which are displayed
276
in Figure 3. Figures 4 and 5 show the structural plan and the transversal cross section, respectively.
277
The reference Cartesian coordinate system assumed in the analyses is indicated in Figures 4 and 5
278
too. As highlighted in Figure 4, the plan is rectangular, with sides of 14.4 m in transversal direction,
279
parallel to X, and 24.25 m in longitudinal direction, parallel to Y. The height of the roof top is equal
280
to 9.17 m, whereas the height of the façades, measured on top of the end section of the roof beams, is
281
equal to 8.67 m. The structure is constituted by 9 identical RC frames of two columns each, numbered
282
C1-C2 through C17-C18 in Figure 4, placed at a mutual distance of 3 m. The cross sections of beams
283
and columns and relevant reinforcement details, redrawn from the original structural design
284
drawings, are illustrated in Figure 6.
285
286
287
288
289
290
291
292
293
294
Figure 3. Lateral (a), front (b) and internal (c) views of the building.
295
296
297
298
299
300
301
302
303
304
305
306
307
308
309
310
311
312
313
314
315
316
317
Figure 4. Structural plan of the building (dimensions in millimeters).
318
319
320
321
322
323
324
325
326
327
328
329
330
331
332
Figure 5. Cross section of the building (dimensions in millimeters).
333
334
335
336
337
Z
X
14400
13700 300
300
300
300
300
300
300
300
C6 C12
C2 C10
C8 C14 C16 C18
C4 C5
C11
C1 C9
C7 C13 C15 C17
C3
2425
0
338
339
340
341
342
343
344
345
346
347
348
349
350
351
352
353
Figure 6. Redrawn cross sections of: (a) roof beams – half-span and ends; (b) top longitudinal beams TB –
354
half-span and ends; (c) intermediate longitudinal beams IB; and (d) columns (dimensions in millimeters).
355
Columns have a mutual rectangular section with sides of 700 mm along X and 250 mm along Y.
356
Roof beams have rectangular section with base of 250 mm and height varying from 1030 mm, at the
357
ends, to 1540 mm, at half-span. In longitudinal direction the columns are connected on top by a
358
rectangular beam, named TB in Figure 5, with dimensions 250×400 mm×mm; at a height of 3.17 m by
359
an intermediate beam, named IB, having a polygonal section with base of 700 mm and maximum
360
lateral side of 500 mm; and at the base by a rectangular beam constituting the lateral edge beam of
361
the ground floor, named LEB, with dimensions 200×700 mm×mm. The IB beam, which supports the
362
curtain wall-type glazed portions of the façades, subdivides all columns in two levels along the
363
height.
364
The structure of the roof floor is 160 mm thick and made of 120 mm-high and 100 mm-wide
365
partly prefabricated RC joists, parallel to Y and placed at a mutual distance of 400 mm; clay lug bricks;
366
and a 40 mm thick upper RC slab. The ground floor only differs for the height of the joists, equal to
367
160 mm, which determines a total thickness of 200 mm. The foundation consists of a 400 mm-thick
368
continuous slab, with 1400 mm-high (slab thickness included) and 250 mm-wide transversal rib
369
beams, which connect the column base sections in X direction and support the ground floor.
370
A selective investigation campaign was carried out on materials and structural members,
371
including on-site Son-Reb, pacometric and Vickers-type micro-durometer analyses, and laboratory
372
tests on concrete and steel bar samples. Based on the prescriptions of Italian Standards [22, 23], as
373
well as on professional protocols [24, 25], the tests met the basic knowledge level (named LC1 in [22])
374
for the structural assessment analysis of public buildings in Italy. The corresponding value of the
375
confidence factor, i.e. the additional knowledge level-related safety coefficient to be introduced in
376
stress state checks, is equal to 1.35. The following main properties resulted from the characterization
377
tests: mean cubic compressive strength of concrete equal to 19.6 N/mm2; yield stress and limit stress
378
of steel equal to 417 MPa and 594 MPa, respectively.
379
1550
250
2 bars φ18
stirrups φ8/20
7 bars φ18 250
1030
2 bars φ18
4 bars φ18
400
250
2 bars φ14
400
250
stirrups φ8/20
stirrups φ8/10
stirrups φ8/20
250
700
2 bars φ18
3 bars φ18
stirrups φ8/20
(b)
700
200
300
bars φ16
stirrups φ8/20 200
500
(a) (c) (d)
3 bars φ14
4 bars φ14
4. Verification Analysis in Current Conditions (Step 1 of the Design Procedure)
380
The verification enquiry in current conditions, constituting Step 1 of the design procedure, is
381
articulated in a modal analysis, to calculate the vibration periods and associated modal masses, and
382
a time-history analysis, to assess the seismic performance in terms of stress states and displacements.
383
4.1 Modal Analysis
384
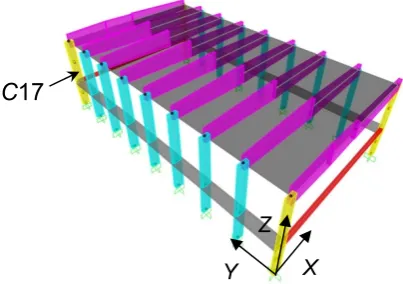
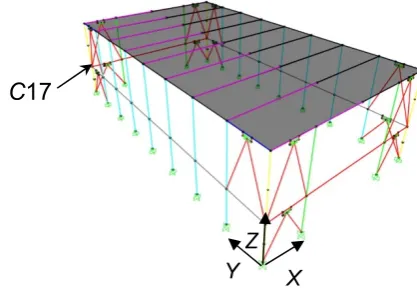
The finite element model of the structure, a perspective view of which is displayed in Figure 7,
385
was generated by SAP2000NL calculus program [26] using frame type elements for all structural
386
members. The modal analysis carried out by the model shows two first horizontal translational
387
modes along X and Y, with vibration periods of 0.89 s (Y) and 0.35 s (X), respectively, and effective
388
modal mass (EMM) equal to 79% along Y and 88.1% along X. The fourth and fifth mode are
389
translational along X and Y too, with periods of 0.26 s (Y) and 0.11 s (X), and EMM equal to 20.9% (Y)
390
and 11.8% (X), which provide summed modal masses with the corresponding first mode-related
391
EMMs nearly equal to 100%, along both axes. The third and sixth mode are purely rotational around
392
the vertical axis Z, with periods of 0.34 s and 0.04 s, and EMM equal to 84.4% and 12.4%, giving a
393
summed modal mass of 96.8%.
394
The modal parameters quantitatively confirm a notably different translational behaviour of the
395
structure along the two directions in plan, as a consequence of the markedly different sides of
396
columns along X and Y, and the much higher flexural stiffness of the roof beams in comparison to
397
the longitudinal beams.
398
399
400
401
402
403
404
405
406
407
408
Figure 7. View and reference coordinate system of the finite element model.
409
4.2 Time-History Verification and Performance Assessment Analysis
410
The performance evaluation enquiry was carried out for the four reference seismic levels fixed
411
in the Italian Standards [23], that is, Frequent Design Earthquake (FDE, with 81% probability of being
412
exceeded over the reference time period VR); Serviceability Design Earthquake (SDE, with 50%/VR
413
probability); Basic Design Earthquake (BDE, with 10%/VR probability); and Maximum Considered
414
Earthquake (MCE, with 5%/VR probability). The VR period is fixed at 75 years, which is obtained by
415
multiplying the nominal structural life VN of 50 years by a coefficient of use Cu equal to 1.5, imposed
416
to structures whose seismic resistance is of importance in view of the consequences associated with
417
their possible collapse, like the case study school gym building. By referring to topographic category
418
T1 (flat surface), and B-type soil, the resulting peak ground accelerations for the four seismic levels
419
referred to the city of Florence are as follows: 0.065 g (FDE), 0.078 g (SDE), 0.181 g (BDE), and 0.227 g
420
C
17
X Y
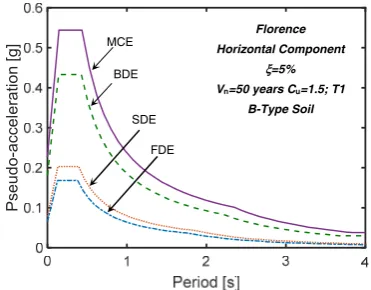
(MCE). Relevant pseudo-acceleration elastic response spectra at linear viscous damping ratio ξ=5%
421
are plotted in Figure 8.
422
423
424
425
426
427
428
429
430
431
432
Figure 8. Normative pseudo-acceleration elastic response spectra for Florence.
433
Time-history analyses were developed by assuming artificial ground motions as inputs,
434
generated in families of seven by SIMQKE-II software [27] from the spectra above. As required by
435
the Italian Standards [22], as well as by several other international seismic Codes and Regulations
436
[11,28], in each time-history analysis the accelerograms were assumed in groups of two simultaneous
437
horizontal components, with the first one selected from the first generated family of seven motions,
438
and the second one selected from the second family.
439
The results of the analyses carried out at the FDE and the SDE are evaluated in terms of
inter-440
level drift ratio (i.e. the ratio of inter-level drift to inter-level height of columns), ILDr, which is
441
equivalent to the inter-storey drift ratio in the presence of a system of continuous intermediate beams,
442
although without a floor. The maximum ILDr values induced by the most severe among the seven
443
groups of input motions, ILDr,max, are as follows: 0.07% (FDE), 0.09% (SDE) in X, and 0.06% (FDE),
444
0.07% (SDE) in Y, on the first level; and 0.13% (FDE), 0.16% (SDE) in X, and 0.53% (FDE), 0.64% (SDE)
445
in Y, on the second level. The drift ratios in X are far below the 0.33% limitation adopted by [23] at
446
the Operational (OP) performance level for frame structures interacting with drift-sensitive
non-447
structural elements, like the masonry infills on the first level and the curtain wall-type windows on
448
the second level, for the main façades of the building, and the infills situated on both levels, for the
449
side façades. The ILDr,max values obtained at the second level in Y are 1.6 times (FDE) and about twice
450
(SDE) the OP-related limit, and also greater than the drift threshold adopted by [23] for the Immediate
451
Occupancy (IO) performance level, equal to 0.5%.
452
The ILDr,max values computed for the second level in Y are equal to 1.36% at the BDE, and 1.69%
453
at the MCE, assessing moderate (BDE) to high (MCE) potential plastic demands on columns — should
454
an inelastic finite element analysis be carried out —, and severe (BDE) to very severe (MCE) damage
455
of infills and curtain-wall windows. Consequently, the performance level attained in terms of
456
displacement response is Life Safety (LS), both for the BDE and the MCE. At the same time, ILDr,max
457
is no greater than 0.18% (BDE) and 0.22% (MCE) on the first level in Y, i.e. only 13% of the second
458
level values. This identifies a cantilever-like response of the structure along Y, with structural and
459
non-structural damage located on the second level. As discussed in the following Sections, this
460
suggests to incorporate the dissipaters on the upper level only, in order to adequately exploit their
461
damping capacity, and limit the cost of the retrofit intervention. In X direction ILDr,max is equal to 0.2%
462
(BDE), 0.25% (MCE) on the first level, and 0.36% (BDE), 0.45% (MCE) on the second level. The
inter-463
Pseudo-accel
eration [g]
Florence Horizontal Component
ξ=5%
Vn=50 years Cu=1.5; T1
B-Type Soil MCE
BDE
SDE
level drift profile depicts a frame-like layout along this axis, which approaches a shear-type shape on
464
the second level, as a consequence of the high flexural stiffness of the roof beams in the X-Z vertical
465
plan (which determines nearly a sliding-clamped constraint condition on the top section of columns).
466
The BDE and MCE-related response was assessed also in terms of stress levels. The shear-related
467
checks are met in both directions and for both levels, up to the MCE. On the other hand, the combined
468
axial force-biaxial bending moment stress state checks are met only for the internal columns (C3
469
through C16, according to the numbering in Figure 4) on the first level at the BDE. The response of
470
corner columns (C1, C2, C17 and C18) at this level, as well as of all columns on the second level is
471
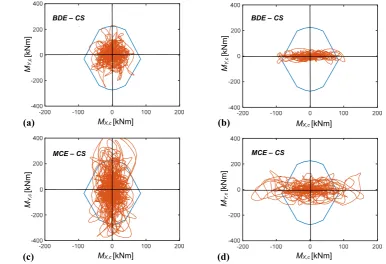
unsafe starting from the BDE. By way of example, the MX,c–MY,c biaxial moment interaction curves
472
(being MX,c, MY,c the bending moments around the X and Y axes) graphed by jointly plotting the two
473
bending moment response historiesobtainedfrom the most demanding among the seven groups of
474
MCE-scaled accelerograms, are plotted in Figure 9 for a corner column, namely C17.The boundary
475
of the MX,c–MY,c elastic interaction domain traced out for the value of the axial force referred to the
476
basic combination of gravity loads, i.e. Nc=104 kN for the corner columns, is also shown in the two
477
graphs. The response curves relevant to the first level highlight maximum MX,c–MY,c combined values
478
slightly exceeding the safe domain boundary, at the BDE, and 1.77 times greater than the
479
corresponding values situated on the boundary, with prevailing contribution of MY,c, at the MCE. The
480
curves traced out for the second level show more marked unsafe conditions at the BDE, as compared
481
to the first level ones, and exceed the boundary by a factor equal to 2.07, at the MCE, but with inverted
482
role of the moments (i.e. with prevailing contribution of MX,c, for the second level).
483
484
485
486
487
488
489
490
491
492
493
494
495
496
497
498
499
500
Figure 9. Current state (CS). MX,c–MY,c biaxial moment interaction curves at the base section of column C17
501
on first level (a, c) and second level (b, d) obtained from the most demanding BDE-scaled (a, b) and
MCE-502
scaled (c, d) group of accelerograms.
503
504
(c)
(b) (a)
(d) MX,c [kNm]
MY
,c
[kNm]
BDE – CS
MX,c [kNm]
MY,c
[kNm]
BDE – CS
MX,c [kNm]
MY,c
[kNm]
MX,c [kNm]
MY,c
[kNm]
5. Dissipative Bracing Retrofit Solution
505
5.1 Characteristics of the Protective System
506
Fluid viscous devices are among the most widely used types of rate-dependent passive energy
507
dampers installed in dissipative bracing technologies worldwide. This is owed to their high damping
508
capacities, stable mechanical properties over time, simple installation procedures, limited
509
architectural and visual impact, competitive costs and, in the case of pressurized elements, inherent
510
self-centering qualities [29-32].
511
Within this class, a special type of pressurized FV devices has been studied for several years by
512
the author and co-authors, focusing attention on their mechanical characterization, the
513
implementation of analytical and numerical models to simulate their dynamic response, the
514
formulation of sizing and design criteria, and the application to several different protective
515
technologies and structural typologies. Concerning their analytical modelling, the time-dependent
516
FD damping and Fne non-linear elastic reaction forces corresponding to the damper and spring
517
functions are effectively simulated by the following expressions [29, 31]:
518
γ
D t csgnx(t) x t
F ( )
=
[ ]( ) (22)519
1/5 5
0 1
2 1 2
) ( 1
) ( ) ( ) ( ) (
+
+
=
−F t x
t x k k t
x k t F
k
ne (23)
520
where t=time variable; c=damping coefficient; sgn(·)=signum function; x(t) =device velocity;
521
|·|=absolute value; γ=fractional exponent, ranging from 0.1 to 0.2; F0=static pre-load force; k1,
522
k2=stiffness of the response branches situated below and beyond F0; and x(t)=device displacement.
523
For the development of the numerical analyses, the finite element model of a FV spring-damper is
524
obtained by combining in parallel a non-linear dashpot and a non-linear spring with reaction forces
525
given by expressions (22) and (23), respectively. Both types of elements are currently incorporated in
526
commercial structural analysis programs, such as the SAP2000NL code used in this study.
527
The installation layout of the springs-dampers in the dissipative bracing system is illustrated by
528
the drawing in Figure 10, referred to the case study building, and corresponding to the basic
529
configuration devised for RC frame buildings. Therein, a pair of interfaced devices is placed in
530
parallel with the connecting beam axis at the tip of each couple of supporting braces. A half-stroke
531
initial position is imposed on site to the pistons of both spring-dampers, so as to obtain symmetrical
532
tension-compression response cycles — like the one traced out in the scheme of Figure 2 — starting
533
from a compressive-only response of the single devices. This position is obtained during the assembly
534
operations by acting on a pair of threaded steel bars crossing the interfacing plate of each device, and
535
connected to two other bored plates, screwed into the external casing of the spring-dampers.
536
542
543
544
545
546
547
548
549
550
551
552
Figure 10. Installation details of the dissipative bracing system in the case study building.
553
5.2 Application of the Design Method to the Case Study Building
554
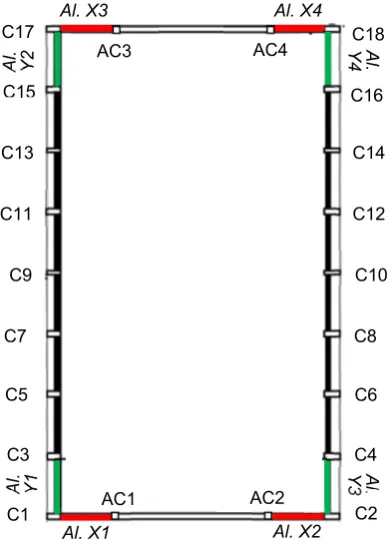
As shown in the building plan in Figure 11, the dissipative braces are placed in four alignments
555
parallel to X (named Al.X1 through Al.X4) and four alignments parallel to Y (Al.Y1–Al.Y4). The
556
latter are constituted by pairs of adjacent columns (C1-C3 — Al.Y1, C15-C17 — Al.Y2, C2-C4 — Al.
557
Y3, C16-C18 — Al.Y4). Concerning the X-parallel alignments, because the beam span is about 11 m
558
long, four additional RC columns with mutual section 250×250 mm×mm, named AC1 through AC4
559
in Figure 11, are built at a distance of 3 m from the corner columns prior to mounting the bracing
560
members.
561
562
563
564
565
566
567
568
569
570
571
572
573
574
575
576
577
578
Figure 11. Positions of the dissipative bracing system alignments in plan.
579
Based on the results of the assessment analysis reported in Section 4, the dissipaters are
580
incorporated on the second level only, since the first level drifts computed in current conditions can
581
produce only a marginal activation even of the smallest FV devices in standard manufacturing.
582
Connectors
Squared profiles 100x100x6
Hinge bar 6 M16 cl.8.8
FV Device
FV Device RC Beam
Threaded steel bar
Out-of-plane protection plate
AC1 AC2
AC3
Al. X3 Al. X4
AC4
Al. Y2
Al.
Y4
Al. Y1
Al.
Y3
C11
C9 C17
C15
C13
C12
C10 C18
C16
C14
C7 C8
C5 C6
C3 C4
C1 C2
Consequently, traditional non dissipative braces are installed on the first level in the same four plus
583
four vertical alignments, so as to provide the necessary structural continuity with the dissipative
584
bracing system placed on the second level, as illustrated in the elevation view of Figure 10, but
585
without adding any further supplemental damping contribution. The application of steps 2 through
586
4 of the design procedure is summarized below for X and Y directions.
587
X direction – Lack of bending moment strength in columns
588
Step 2. The verification analysis in current conditions highlights that the most critical response
589
parameters in X direction are the bending moments around Y (i.e. MY) in the first level columns, with
590
the highest unsafe conditions checked in the four corner columns. By referring to the nomenclature
591
in Section 2.1, the maximum moment MY,accorresponding to the peak response point in Figure 9c,
592
and associated with the concurrent axial force Nc=104 kN mentioned above, is equal to 398.7 kNm.
593
The elastic limit moment MY,ec of the corner columns around the Y axis is equal to 224.8 kNm. Thus,
594
the stress reduction factor αs
=
αMY of the critical members in X direction results as follows:595
77 . 1
= =
α =
α e
c Y, a
c Y, MY s
M M
(24)
596
Passing from the member to the frame structure level (equivalent to the frame structure storey for
597
this case study building), since all columns have the same cross section, αF ratio coincides with αMY:
598
1.77 = α =
αF MY (25)
599
Step 3. Based on this value, the equivalent viscous damping ratio of the set of spring-dampers
600
to be installed on the second level is evaluated by means of relation (14), obtaining:
601
0.277 π
2
( =
α − α α
ξ
=
F F 1) ( ) F
eq (26)
602
Step 4. The EDenergy dissipation capacity of the spring-dampers is calculated by expression (18).
603
The elastic limit values of the level shear Fe (i.e. the sum of the elastic limit shear forces of columns)
604
and the first inter-level drift ILDe (replacing IDe in this case) computed in X direction, named Fe,X and
605
ILDe,1L,X, are equal to 969 kN and 22 mm, respectively. Introducing these values, as well as αF and
606
ξeq(αF) values given by (25) and (26), in (18), the following ED estimate is derived:
607
kJ 65.6 )
( 2π
) α α =
(αF
=
F e,Xξ
eq F e,1L,XD F ILD
E (27)
608
Dividing ED by the number of spring-dampers placed in X, the minimum energy dissipation
609
capacity ED,X,d to be assigned to each of the 8 devices in order to reach the target performance at the
610
MCE results as follows: ED,X,d=8.2 kJ. The spring-damper type with the nearest nominal energy
611
manufacturer’s catalogue [22]: En=9 kJ; stroke smax=±30 mm; damping coefficient c=9.9 kN(s/mm)γ,
613
with γ=0.15; F0=17 kN; and k2=1.74 kN/mm.
614
Y direction – Lack of bending moment strength in columns and excessive inter-level drift
615
Step 2. The critical response parameters in Y direction are represented by the bending moments
616
around X (MX) in the second level columns, with the highest unsafe conditions checked in the four
617
corner columns too, and the second inter-level drifts. The maximum moment MX,ac, corresponding
618
in this case to the peak response point in Figure 9d, is equal to 174.2 kNm, whereas the elastic limit
619
moment MX,e cis equal to 84.2 kNm. Therefore, the stress reduction factor αs
=
αMX of the critical620
members in Y direction is:
621
2.07 = =
α =
α e
c X, a
c X, MX s
M M
(28)
622
and thus:
623
07 . 2 = α =
αF MX (29)
624
The deformation-related reduction factor αd given by (19) is calculated for ILDmax (replacing
625
IDmax) and ILDe (replacing IDe) values computed on the second level in Y direction, named ILDmax,2L,Y,
626
ILDe,2L,Y in the following. ILDmax,2L,Y — corresponding to the ILDr,max value of 1.69% mentioned in
627
Section 4.2 — is equal to 72.7 mm, and ILDe,2L,Y to 36.8 mm, yielding:
628
1.98 = =
e,2L,Y max,2L,Y d
ILD ILD
α (30)
629
Step 3. The equivalent viscous damping ratio is calculated in this case by referring both to αF and
630
αd, using expressions (14) and (20), respectively:
631
33 . 0 (
) =
α − α α
ξ
=
F F F
eq
1)
π 2
( (31)
632
0.624 1)
π 2
= − α = α
ξeq( d) ( d (32)
633
Step 4. Named Fe,Y the elastic limit level shear in Y direction, by applying the ED energy
634
dissipation capacity expressions (18) and (21), the following ED estimates are obtained:
635
kJ 100.8 )
( 2π
)
(αF = αF e,Y
ξ
eq αF e,2L,Y =D ILD
E
F
(33)
636
kJ 9 )
( 2π )
(αd = e,Y
ξ
eq αd e,2L,Y = 2.1D ILD
E
F
(34)637
By comparing ξeq(αF) with ξeq(αd), and ED(αF) with ED(αd), it can be observed that the relevant
639
ratios are rather different. Indeed: ξeq(αd)/ξeq(αF)=1.89, ED(αF)/ED(αd)=1.1. This is due to the fact that,
640
consistently with the general ξeqexpression (5), the damping coefficient depends on Ee, and thus on
641
the elastic properties of the device, which are a function of the maximum displacement and force
642
reached in the time-history response, in addition to the hysteretic response. On the other hand, the
643
dissipated energy ED is only determined by the area covered by the response cycles, which identifies
644
it as a more stable and reliable parameter for the design of the FV devices. ξeqis only a useful synthetic
645
measure of their limit damping capacity.
646
The design process is completed by referring to the largest of the energy values, ED(αF), ED(αd),
647
i.e. ED(αF)=100.8 kJ. Similarly to X direction, the minimum energy dissipation capacity of each of the
648
8 devices placed in Y, ED,Y,d, in order to achieve the target performance at the MCE is obtained by
649
dividing ED(αd) by the number of spring-dampers: ED,Y,d=12.6 kJ. The device with the nearest nominal
650
energy dissipation capacity to ED,Y,d has the following mechanical properties: En=14 kJ; stroke smax=±40
651
mm; damping coefficient c=14.16 kN(s/mm)γ, with γ=0.15; F0=28 kN; and k2=2.1 kN/mm.
652
5.3 Numerical Verification of the Retrofit Solution
653
A perspective view of the model including the dissipative bracing system is displayed in Figure
654
12. The modal analysis carried out in retrofitted conditions confirms the sequence of modes computed
655
in current state, with differences on periods and EMMs lower than 10%, as a consequence of the small
656
stiffening effect of this technology. Periods and EMMs of the two first horizontal translational modes
657
along X and Y pass to 0.83 s (Y) and 0.32 s (X), and to 79.5% (Y) and 88.1% (X); periods and EMMs of
658
the fourth and fifth mode, translational along X and Y, to 0.25 s (Y) and 0.105 s (X), and to 20.3% (Y)
659
and 11.7% (X). Relevant summed modal masses are nearly equal to 100% along both axes, in this case
660
too. The third and sixth mode, rotational around Z, have periods of 0.33 s and 0.037 s, and EMM equal
661
to 84.9% and 13.8%, giving a summed modal mass of 98.7%.
662
663
664
665
666
667
668
669
Figure 12.View of the finite element model incorporating the dissipative bracing system.
670
The results of the time-history verification analyses in rehabilitated configuration are
671
synthesized in Figures 13 through 16, all referred to the response induced by the most demanding of
672
the seven groups of input ground motions scaled at the MCE level. The MXc–MYc interaction curves
673
of the first and second level base sections of column C17, plotted in Figure 9c,d above for the original
674
structure, are duplicated in Fig. 13 in retrofitted conditions. The two graphs show that the dissipative
675
action of the protective system allows confining the interaction curves within the biaxial moment safe
676
C
17
domain, reducing the maximum MYc (Figure 13a) and MXc (Figure 13b) moments nearly by the
677
targeted αMY and αMX factors of 1.77 and 2.07, as given by (24) and (29).
678
679
680
681
682
683
684
685
686
Figure 13. Retrofitted structure (RS). MX,c–MY,c biaxial moment interaction curves at the base section of
687
column C17 on first level (a) and second level (b) obtained from the most demanding MCE-scaled group
688
of accelerograms.
689
The response cycles of the pairs of spring-dampers situated along the diagonally opposite
690
vertical alignments Al.X1, Al.X3, and Al.Y2, Al.Y4 are visualized in Figure 14. The cycles exhibit
691
peak displacements equal to 6.3 mm (Al. X1, Al. X3) and 8.8 mm (Al. Y2, Al. Y4), far below the
692
available stroke limits of ±30 mm (in X) and ±40 mm (in Y) mentioned above. Furthermore, the
693
response of the devicesplaced in Al. X1 and Al. X3 are nearly coincident, and the same occurs for the
694
devices situated in Al. Y2 and Al. Y4, highlighting that torsion effects in plan are virtually null.
695
696
697
698
699
700
701
702
703
704
705
706
707
708
709
710
711
Figure 14.Retrofitted structure (RS). Response cycles of the spring-damper pairs installed in Al. X1 (a), Al. X3
712
(b), Al. Y2 (c) and Al. Y4 (d) vertical alignments obtained from the most demanding MCE-scaled group of
713
accelerograms.
714
M [kNm]
M
[kNm]
M [kNm]
M
[kNm]
MCE – RS
M
[kNm]
C17
First Level
(a) (b)
MY,c
[kNm]
MY,c
[kNm]
C17
Second Level MCE – RS
MX,c [kNm] MX,c [kNm]
(a)
-15 -10 -5 0 5 10 15
Displacement [mm]
-50 0 50
Fo
rce
[kN
]
MCE Al. X3
-15 -10 -5 0 5 10 15
Displacement [mm]
-50 0 50
Fo
rce
[kN
]
MCE
Al. X1 MCE – RS
MCE – RS
Al. X1 Al. X3
(b)
(c) -15 -10 Displacement [mm]-5 0 5 10 15 (d)
-50 0 50
Fo
rce
[kN
]
MCE Al. Y2
Al. Y2 MCE –RS
-15 -10 -5 0 5 10 15
Displacement [mm]
-50 0 50
Fo
rce
[kN
]
MCE Al. Y4
The energy time-histories graphed in Figure 15, where EI and ED denote the total input and dissipated
715
energies, and EI,X, ED,X, EI,Y, ED,Y the relevant portions in X and Y, show ED,X, ED,Y values of 66.9 kJ and 101.9
716
kJ, which differ only by 2% and 1% from the corresponding ED(αF) estimates (27) and (33), respectively.
717
718
719
720
721
722
723
Figure 15.Retrofitted structure (RS). Energy time-histories obtained from the most demanding
MCE-724
scaled group of accelerograms.
725
Furthermore, practically identical values of the ED/EI ratio are found in X and Y, namely: ED,X/EI,X=0.85;
726
ED,X/EI,X=0.855, identifying a well balanced energy dissipation demand in the two directions.
727
The roof top displacement time-histories illustrated in Figure 16 show a reduction factor on the peak values
728
equal to about 2.3 (X) and 2.2 (Y) when passing from current (CS) to retrofitted (RS) conditions. In the most
729
deformable direction Y this corresponds to a drop of the second level drift from 72.7 mm to 33.8 mm, i.e. below
730
the corresponding elastic limit value ILDe,2L,Y=36.8 mm, as targeted in the design.
731
732
733
734
735
736
737
Figure 16.Roof top displacement time-histories obtained from the most demanding MCE-scaled group of
738
accelerograms.
739
5. Conclusions
740
The energy-based design criterion formulated in this study for the seismic retrofit of frame
741
buildings by means of dissipative bracing technologies does not require any preliminary evaluation
742
of the input energy demand on the original structure. At the same time, the most critical response
743
parameters in current conditions — the reduction of which within the boundary of relevant safe
744
domains (in case of lack of strength), or below limits preventing damage to structural and
non-745
structural elements (in case of excessive lateral displacements) — are evaluated by a conventional
746
elastic finite element analysis. Both aspects of the initializing step of the sizing procedure allow
747
simplifying the design of supplemental damping-based retrofit solutions, which can be useful
748
especially for professional engineers not familiar with seismic energy computation and the
749
development of non-linear time-history analyses.
750
The criterion was detailed here for relatively stiff structures, i.e. with fundamental translational
751
vibration period in original conditions below 0.8 s, where the retrofit design objectives can be met by
752
MCE – RS
ED
EI
EI,Y
ED,Y
EI,X
ED,X
0 5 10 15 20 25 30
Time [s]
-80 -60 -40 -20 0 20 40 60 80
Displacement
[
mm]
MCE
OS BS
Y Direction MCE
0 5 10 15 20 25 30
Time [s]
-80 -60 -40 -20 0 20 40 60 80
Displacement
[
mm]
MCE
OS BS
X Direction MCE
RS
RS
added damping, with a marginal role of supplemental stiffness. This prompted to select the bracing
753
systems that incorporate FV spring-dampers as protective devices, because they provide a moderate
754
contribution to the lateral stiffness of the retrofitted structures. However, the procedure can be
755
extended with little modifications to dissipative bracing technologies that significantly increase the
756
translational stiffness too, like the systems including metallic dampers, which will be the subject of a
757
further step of the study.
758
The demonstrative application to the considered case study structure allowed checking the
759
quick sizing characteristics of the design criterion, even when stress state-related and drift-related
760
deficiencies are both found in the original structure (as occurs in Y direction of the gym building).
761
Furthermore, the values of the equivalent damping coefficient ratio calculated as a function of the
762
reduction factors αF, αd relevant to stress states and drifts, using formulas (14) and (20), respectively,
763
resulted to be notably different. On the other hand, a slight difference was found between the
764
corresponding energy dissipation measures, ED(αF) and ED(αd). This identified ED as a more stable
765
and reliable design parameter, as compared to ξeq, consistently with the fact that ED is only determined
766
by the area covered by the response cycles of the dissipaters. This was also confirmed by the fact that
767
the ED values in X and Y computed from the time-history verification analysis were very similar to
768
the ED(αF) estimates.
769
As targeted in the retrofit design, the incorporation of the protective system in the gym building
770
allows reaching an elastic and safe response of all members, as well as constraining the inter-level
771
drifts below the Immediate Occupancy drift limit, up to the MCE, starting from a rather poor
772
performance in original conditions.
773
Acknowledgments: The study reported in this paper was sponsored by the Italian Department of Civil
774
Protection within the ReLUIS-DPC Project 2014/2018, Research Line 6: Isolation and Dissipation. The author
775
gratefully acknowledge this financial support.
776
Conflicts of Interest: The author declares no conflict of interest.
777
References
778
1. Foti, D.; Bozzo, L.; Lopez-Almansa, F. Numerical efficiency assessment of energy dissipators for seismic
779
protection of buildings. Earthquake Engineering and Structural Dynamics, 1998, 27(6), 543-556, DOI:
780
10.1002/(SICI)1096-9845(199806)27:6.
781
2. Aiken, I.D.; Nims, D.K.; Whittaker, A.S.; Kelly, J.M. Testing of passive energy dissipation systems.
782
Earthquake Spectra, 1993, 9(3), 335-370, DOI: 10.1193/1.1585720.
783
3. Sorace, S.; Terenzi, G. Seismic protection of frame structures by fluid viscous damped braces. Journal of
784
Structural Engineering, ASCE, 2008, 134(1), 45-55, DOI: 10.1061/(ASCE)0733-9445(2008)134:1(45).
785
4. Constantinou, M.C.; Symans, M.D. Experimental study of seismic response of buildings with supplemental
786
fluid dampers. Journal of the Structural Design of Tall Buildings, 1993, 2(2), 93–132, DOI:
787
10.1002/tal.4320020203 .
788
5. Ramirez, O.M.; Costantinou, M.C.; Kircher, C.A.; Johnson, M.W.; Chrysostomou, C.Z. Validation of the