http://www.sciencepublishinggroup.com/j/cssp doi: 10.11648/j.cssp.20190801.14
ISSN: 2326-9065 (Print); ISSN: 2326-9073 (Online)
Composite Reliability Index of Practical Distribution
Network with PVDG Integration
Thin Thin Moe
*, Myint Thuzar
Department of Electrical Power Engineering, Mandalay Technological University, Mandalay, Myanmar
Email address:
*
Corresponding author
To cite this article:
Thin Thin Moe, Myint Thuzar. Composite Reliability Index of Practical Distribution Network with PVDG Integration. Science Journal of Circuits, Systems and Signal Processing. Vol. 8, No. 1, 2019, pp. 24-31. doi: 10.11648/j.cssp.20190801.14
Received: July 1, 2019; Accepted: July 23, 2019; Published: August 8, 2019
Abstract:
The benefits of the photovoltaic distributed generation (PVDG) installation in the distribution network include the total system loss reduction, voltage profile improvement and the reliability enhancement of the distribution network by minimizing the interruption and duration time to customers due to the loss of utility or due to the faults in transmission lines/equipments. in this research, the optimal size of PVDG is connected at the optimal location of practical distribution network (town pyone feeder). The multi-state model is used to calculate the probabilities of the solar irradiance data and the output power of PVDG. These probabilities of solar irradiance are applied to assess the reliability of the practical distribution network with PVDG integration. The reliability within the island operation mode of the distribution system with PVDG is presented. Analytical approach is described to assess the impact of PVDG on the system reliability due to the stochastic behavior of PV output power. a composite index organizing the impact of PVDG on the overall reliability of distribution network including interruption frequency, interruption duration and expected energy not supplied is presented. The results show that the integration of PVDG placement in the practical distribution network can improve the reliability and the applying proposed methodology can enable determining PVDG configuration concerning the overall system reliability improvement.Keywords:
Composite Index, Multi-State Model, PVDG, Reliability1. Introduction
The integration of renewable DG units into a conventional distribution system depends on the power output of the DG units, availability of wind speed and solar irradiance based on the specifications of the original equipment manufacturers, repair time, configuration of the network, consumer load demand, etc. The installations of DG in electric power systems have been known to have several impacts on the systems. Those impacts include system losses, voltage regulation, power quality, and protection scheme and system reliability. Distribution system reliability can be defined as the probability of the distribution system to provide continuous power without failure for a specific period of time [1]. It has been reported in the literature that more than 80% of all customer interruptions occur due to failures in the distribution system [2].
Some researchers have been presented on the reliability assessment of distribution system with renewable dg.
Distributed generator placement is presented for loss reduction and reliability improvement [3]. The reliability of a microgrid containing prioritized loads and distributed res through a hybrid analytical-simulation method is described in [4]. Multi-state model of PV output power is researched to study the reliability of the distribution system with renewable energy resources. The island mode of distribution system with dg is researched and the probability of island successful operation is based on the dg model and load model [5]. Reliability evaluation of distribution network with DG is considered the reliability of protective devices affected by superconducting fault current limiter (sfcl)[6]. A new composite index of reliability aspects of integration of dg into the industrial networks is proposed in [7].
A composite index is presented to describe the impact of PVDG on the overall reliability of distribution network including interruption frequency, interruption duration and expected energy not supplied.
The objective of this research is to assess the overall system reliability in the practical distribution network with the impact of PVDG. The rest of this paper is organized as follow. Methodology including photovoltaic output power model and reliability evaluation is explained in section 2. Section 3 demonstrates the case study network and its description while the results and discussion are expressed in section 4. Finally, section 5 concludes this paper.
2. Methodology
In this section, analytical approach is applied to evaluate the reliability of practical distribution network with optimal PVDG. The optimal location and PVDG size is expressed in [8] and is installed in a practical distribution network. PV output power has significantly changes with the solar irradiance data.
2.1. Photovoltaic Output Power Model
The PV output power is uncertain because of the random behavior of solar irradiance. Thus, multi-state model is necessary to reflect the output power level of PVDG. The PV output power depends on solar irradiance and is calculated using the historical data within one year in [10, 11]. The probability of solar irradiance is obtained by counting the number of hours per year for each state of solar irradiance and dividing it by total number of hours per year [12, 15]. The PV output power of solar irradiance can be calculated by using the
multi-state model referred to in [9, 14].
2 bi
sn bi c
std c
bi
PV sn c bi std
std
sn bi std
G
P , 0 G R
G R
G
P P , R G G G
P , G G
× ≤ <
×
= × ≤ <
≥
(1)
Where, PPV is the power output of the solar cell (W); Gbi is
global solar irradiation (W/m2); gstd is the solar irradiation in a
standard environment set as 1000 (W/m2); Rc is a certain
irradiation point set as 150 (W/m2); and Psn is equivalent rated
capacity of PV (W). According to the output power characteristics and the historical solar irradiance, the output power state and corresponding probability of PVDG are expressed in [11].
2.2. Customers Based PV Output Power
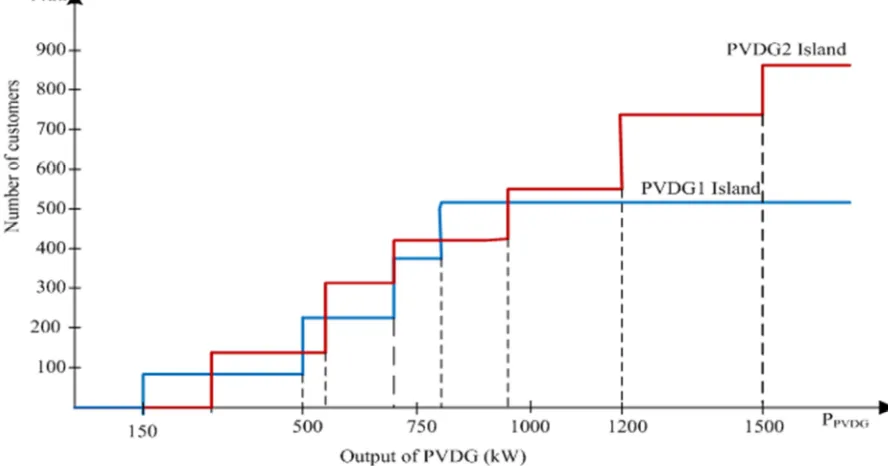
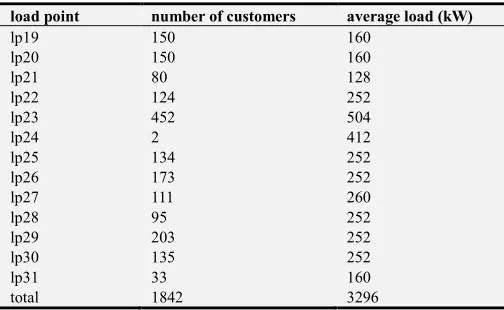
The reliability of the distribution network with PVDG depends on the number of customers which the PV output power can supply each load point. Table 1 describes the customer data and average load within island operation mode. The relationship of the number of customers and PV output power is illustrated in figure 1.
For example, it is assumed that the output of PVDG within island operation mode is 500 kW and then, PVDG can supply reliable electric energy in lp21 and lp22. However, lp20 cannot be supplied all from PVDG in spite of the excess electric energy, i.e., 20 kW.
Table 1. Customer data within island operation mode.
load point number of customers average load (kW)
lp19 150 160
lp20 150 160
lp21 80 128
lp22 124 252
lp23 452 504
lp24 2 412
lp25 134 252
lp26 173 252
lp27 111 260
lp28 95 252
lp29 203 252
lp30 135 252
lp31 33 160
total 1842 3296
2.3. Reliability Evaluation Technique
When a failure occurs in the network, the island operation mode is formed in the distribution system with PVDG. PVDG can supply for the load point within the island, reducing the failure rate and outage time. The reliability indices of the distribution system are an important criterion and basis for measuring system reliability [4-5 and 7], which can be usually divided into two levels: load point reliability indices and system reliability indices. The load point indices of each load point are expressed as;
( )
i i '
s s up
λi =∑λP + −1 P λ (2)
( )
i i '
s s up
Ui=∑UP + −1 P U (3)
Where, psi is the probability of PVDG output power
supplying load point i, λi and Ui are the failure rate and annual
outage time of load point i, respectively. λand U are the failure rate and annual outage time of network components that results in interruption at load point i. λ'up and U’up are the
failure rate and annual outage time of upstream network. Some reliability indices include the system average interruption index (SAIFI), the system average interruption duration index (SAIDI), the customer average interruption duration index (CAIDI) and the expected energy not supplied (EENS) index.These indices can be expressed as follows:
SAIFI interruptions/customer-year Ni
iNi
λ
=
∑
∑
(4)
U Ni i
SAIDI hr/customer-year Ni
∑ =
∑ (5)
SAIDI
CAIDI hr/customer interruption SAIFI
= (6)
EENS L U MWh/year avg(i) i
=∑ (7)
where, Ni is the total number of customers at load point i, Lavg(i)
is the average load connected to the load point i and Ui is the
annual outage time for each load point.
A set of indices representing the impact of PVDG on the reliability is presented in [7]. The impact of PVDG on the system average interruption frequency index (SAIFI) of every load, IGSAIFI is expressed as:
i j j SAIFIij j SAIFI SAIFI IG 100% SAIFI −
= × (8)
where i is an index of PVDG configuration, which is determined by number, site and sizes of connected PVDG, network topology and applied protection scheme, j is a customer point. SAIFIj is average interruption frequency
index at customer point j in the passive network and SAIFIij is
average interruption frequency index at the customer point j in the configuration i of the active network.
The index IGSAIFIij represents the relative increase (positive
value) or decrease (negative value) of the system average interruption frequency index (%) of each customer load point, due to the operation of PVDG [7].
To evaluate an impact of single PVDG or particular PVDG configuration on the system average interruption duration index (SAIDI) of every customer point, an index IGSAIFI is
described as: i j j SAIDIij j SAIDI SAIDI IG 100% SAIDI −
= × (9)
Where, SAIDIj is average interruption duration index at
customer point j in the passive network and SAIDIij is average
interruption duration index at the customer point j in the configuration i of the active network. Due to the operation of PVDG, the relative increase (positive value) or decrease (negative value) of the system average interruption duration index (%) of each customer load point is presented by the index IGSAIFIij.
An index IGCAIDI can be expressed the impact of PVDG on
the customer average interruption duration index (CAIDI). Since CAIDI can be evaluated as the ratio SAIDI/SAIFI, IGCAIDI is not introduced. The impact of each PVDG or PVDG
configuration on the expected energy not supplied (EENS) of each customer point is evaluated as:
i j j EENSij j EENS EENS IG 100% EENS −
= × (10)
where, EENSj is the expected energy not supplied to customer
point j in the passive network (kWh/yr), and EENSij is the
expected energy not supplied to the customer point j in the configuration i of the active network (kWh/yr). The index IGEENSij represents the relative increase (positive value) or
decrease (negative value) of the expected energy not supplied (%) of each customer load point, due to the operation of PVDG.
interruption frequency, interruption duration and expected energy not supplied [7]. To obtain the accurate reliability assessment of the distribution network with PVDG integration, a composite index, IG is proposed as:
N N N
i SAIFIij SAIDIij EENSij
j j j
1
IG IG IG IG
100N
= + +
∑
∑
∑
(11)
The composite index is a sum of average values of positive and negative impacts of PVDG on the three independent reliability indices SAIFI, SAIDI and EENS to the customers due to PVDG operation. A potential of each PVDG or a specific PVDG configuration can be known using the composite index IG for the reliability improvement in the distribution network. The optimal PVDG configuration is the one with the minimum value of index
IG for the reliability improvement in the distribution network.
3. Case Study Network
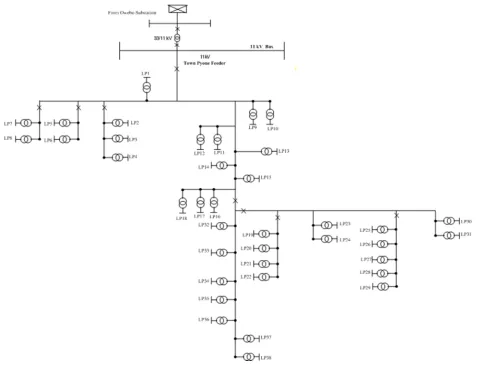
The distribution network is 10 MVA and the total connected load on this system is 9610 kVA. In the practical distribution network, this feeder composed of 38 load points and there are five types of customers including residential, commercial, industrial, government/institution and small user. The total number of customers of town pyone feeder is 3987 [13]. The required data and information for one year from january 2018 to december 2018 are collected from mandalay electricity supply coporation (MESC) [13]. The single line diagram of town pyone feeder from owebo substation is shown in figure 2.
Figure 2. Single line diagram of town pyone feeder.
The requirement data for distribution system reliability parameters such as failure rates, repair times and switching times for transformers, breakers and lines are described in table 2. In this paper, the fuses and disconnects are assumed to be 100% reliable, i.e., the substation is fully reliable.
Table 2. Reliability parameters of practical distribution network.
components total failure rate, λr (f/yr.km) active failure rate, λa (f/yr.km) repair time, r (hr) switching time, s (hr)
transformer (11/0.415 kv) 0.015 0.015 200 1
breakers (11 kv) 0.006 0.004 4 1
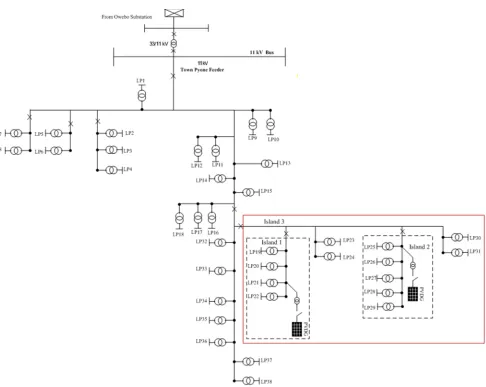
The reliability of the distribution system is assessed by integrating PVDG in the practical distribution network. Figure 3 illustrates the single line diagram of town pyone feeder with PVDG integration.
Figure 3. Single line diagram of twon pyone feeder with PVDG integration. The reliability evaluation is performed on the distribution
network based on the following two configurations: 1. Pssive network (without PVDG)
2. Active network
The installed capacity of PVDG1 and PVDG2 are 1mw and 1.5mw, respectively. The failure rate and average repair time of PVDG are 0.1 f/yr and 18.25 h, respectively.
4. Results and Discussion
In this study, the town pyone feeder is firstly treated as passive radial while in the second, the network is considered as active one, consisting of the optimal placement of PVDG. In this research, analytical technique is applied to get optimal location of PVDG. Newton-raphson power flow solver in matlab r2014 is used to run the load flow and find the optimal location and size of PVDG. In town pyone feeder, the best locations are bus 31 and bus 37 where, the total power losses reduced to 0.457 MW and 0.51 MW, as [8]. PVDG is installed in bus 31 and bus 37. The reliability of each load point is described by considering the island mode operation.
4.1. Passive Network
The system reliability indices within the island operation mode before installing the PVDG are calculated using component reliability data and applying eqs. (4)-(7). Calculated index SAIFI in the basis radial is 0.751int/cust.yr, EENS is 44649 kWh/yr, and the value of SAIDI is 18.56 h/cust.yr, in table 3.
Table 3.Overall system reliability indices of passive network.
town pyone feeder SAIFI SAIDI CAIDI EENS (kWh/yr)
passive radial 0.751 13.94 18.56 44649
4.2. Active Network
island mode, reducing the lp’s failure rate and outage time. The reliability of each load point within the effective area of PV output power is expressed in table 4. The reliability within the island mode is calculated based on the percentage of PV output power.
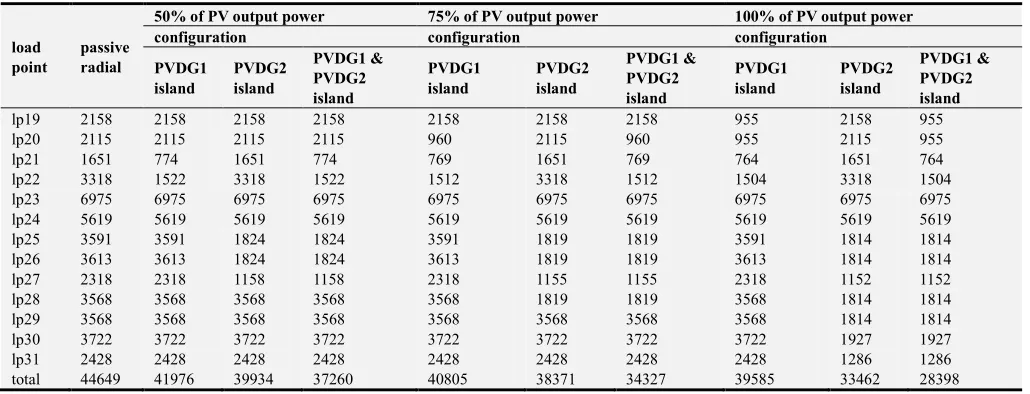
The reliability evaluation is considered in the distribution network with PVDG1 island, PVDG2 island and PVDG1 + PVDG2 island. When PVDG1 is connected to the island 1, the reliability within the effective area has changes due to PVDG output power. The expected energy not supplied (EENS) in all passive radial and three conditions are shown in table 4. In the 100% of the output power in this system, when PVDG1 is connected in the island, EENS is 39585 kWh/yr, which is 11.3% more than in the passive radial. With PVDG2 connected to island mode 2, the value of EENS is 33462 kWh/yr which is the increased of 25% compared to the passive radial. Two
PVDG connected to the system (PVDG1 +PVDG2) increased the EENS for 34% compared to the passive radial. In this configuration, the load point outside the island 2 can be supplied because the output power of PVDG is more than average load within island 2.
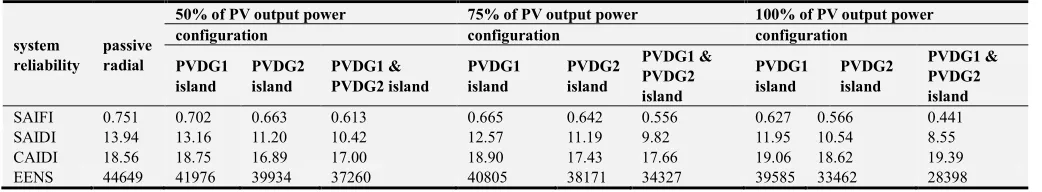
Similarly, the value of SAIFI and SAIDI index within the island operation mode can be expressed for three conditions of PV output power. The reliability indices within island operation mode are described in table 5. In the 100% of PVDG output power, with the PVDG1 connected in the distribution network, the value of index SAIFI is improved for 16.5% (0.627 int./cus.yr. However in the presence of PVDG1, SAIDI is 11.95 h/cus.yr, which is 14.3% more than the passive radial. The reliability study is repeated by installing PVDG2 in the system.
Table 4. Expected energy not supplied (EENS) within island operation mode.
load point
passive radial
50% of PV output power 75% of PV output power 100% of PV output power
configuration configuration configuration
PVDG1 island
PVDG2 island
PVDG1 & PVDG2 island
PVDG1 island
PVDG2 island
PVDG1 & PVDG2 island
PVDG1 island
PVDG2 island
PVDG1 & PVDG2 island
lp19 2158 2158 2158 2158 2158 2158 2158 955 2158 955
lp20 2115 2115 2115 2115 960 2115 960 955 2115 955
lp21 1651 774 1651 774 769 1651 769 764 1651 764
lp22 3318 1522 3318 1522 1512 3318 1512 1504 3318 1504
lp23 6975 6975 6975 6975 6975 6975 6975 6975 6975 6975
lp24 5619 5619 5619 5619 5619 5619 5619 5619 5619 5619
lp25 3591 3591 1824 1824 3591 1819 1819 3591 1814 1814
lp26 3613 3613 1824 1824 3613 1819 1819 3613 1814 1814
lp27 2318 2318 1158 1158 2318 1155 1155 2318 1152 1152
lp28 3568 3568 3568 3568 3568 1819 1819 3568 1814 1814
lp29 3568 3568 3568 3568 3568 3568 3568 3568 1814 1814
lp30 3722 3722 3722 3722 3722 3722 3722 3722 1927 1927
lp31 2428 2428 2428 2428 2428 2428 2428 2428 1286 1286
total 44649 41976 39934 37260 40805 38371 34327 39585 33462 28398
The value of SAIDI is increased by 24%. Besides, the index SAIFI in PVDG2 configuration is 0.566, which the increase of 24% compared to the passive radial. Two PVDGs (PVDG1+PVDG2) connected to the system increased the EENS for 34% and index SAIFI for 41% compared to the passive radial. In this configuration, the two PVDG (PVDG1 + PVDG2) are the most reliable condition compared with the other configuration. Detailed total reliability indices within island operation are presented in table 5 and all reliability indices based on the output power are also improved.
4.3. Overall System Reliability with PVDG Impact
A set of indices is represented for calculation of the impact PVDG on the reliability of the system in each customer point. Indices IGSAIFIij, IGSAIDIij and IGEENSij are obtained in three
configuration, using eqs. (8)-(10), respectively. Under the condition for 100% of PV output power, the calculated indices IGSAIFIij, IGSAIDIij and IGEENSij are presented in tables 6 –8,
respectively. PVDG1 connected to the island significantly decreases the SAIFI, SAIDI and EENS of the load points within the effective area of PV output power. The load points outside the island mode are ineffective reliable. Connecting
PVDG2 in the island 2 decreases the SAIFI, SAIDI and EENS in load points of the island 2. In addition, the surplus of PV output power is supplied the adjacent load points (lp30 and lp31) outside the island 2 and decreases the SAIFI, SAIDI and EENS in load point 30 and load point 31. By connecting two PVDGs (PVDG1 + PVDG2) in the system, the values of SAIFI, SAIDI and EENS are also decreased in the whole system, see table 4. Two PVDGs (PVDG1 +PVDG2) are the most effective configuration and the impact of PVDG on the reliability decreasing the SAIFI, SAIDI and EENS of load point (lp30 and lp31).
Similarly, in the 50% and 75% of PV output power, the indices IGSAIFIij, IGSAIDIij and IGEENSij can be calculated using
table 9 and these indices are changing with the PV output power. The index IG can be described by a sum of increase or decrease of the interruption frequency, interruption duration
and expected energy not supplied to the load points, as shown in tables 6-8.
Table 5. Overall system reliability indices within island operation.
system reliability
passive radial
50% of PV output power 75% of PV output power 100% of PV output power
configuration configuration configuration
PVDG1 island
PVDG2 island
PVDG1 & PVDG2 island
PVDG1 island
PVDG2 island
PVDG1 & PVDG2 island
PVDG1 island
PVDG2 island
PVDG1 & PVDG2 island
SAIFI 0.751 0.702 0.663 0.613 0.665 0.642 0.556 0.627 0.566 0.441
SAIDI 13.94 13.16 11.20 10.42 12.57 11.19 9.82 11.95 10.54 8.55
CAIDI 18.56 18.75 16.89 17.00 18.90 17.43 17.66 19.06 18.62 19.39
EENS 44649 41976 39934 37260 40805 38171 34327 39585 33462 28398
Table 6. PVDG impact on system average interruption frequency, IGSAIFI(%) based the 100% of PV output power. customer j
i configuration lp19 lp20 lp21 lp22 lp23 lp24 lp25 lp26 lp27 lp28 lp29 lp30 lp31
1 PVDG1 -61 -60 -59 -60 0 0 0 0 0 0 0 0 0
2 PVDG2 0 0 0 0 0 0 -52 -52 -52 -51 -51 -49 -46
3 PVDG1+PVDG2 -60 -60 -59 -60 0 0 -52 -52 -52 -51 -51 -49 -46
Table 7. PVDG impact on system average interruption duration, IGSAIDI(%) based the 100% of PV output power. customer j
i configuration lp19 lp20 lp21 lp22 lp23 lp24 lp25 lp26 lp27 lp28 lp29 lp30 lp31
1 PVDG1 -55 -54 -53 -54 0 0 0 0 0 0 0 0 0
2 PVDG2 0 0 0 0 0 0 -49 -49 -50 -49 -49 -48 -47
3 PVDG1+PVDG2 -55 -54 -53 -54 0 0 -49 -49 -50 -49 -49 -48 -47
Table 8. PVDG impact on expected energy not supplied, IGEENS (%) based the 100% of PV output power. customer j
i configuration lp19 lp20 lp21 lp22 lp23 lp24 lp25 lp26 lp27 lp28 lp29 lp30 lp31
1 PVDG1 -55 -54 -53 -54 0 0 0 0 0 0 0 0 0
2 PVDG2 0 0 0 0 0 0 -49 -49 -50 -49 -49 -48 -47
3 PVDG1+PVDG2 -55 -54 -53 -54 0 0 -49 -49 -50 -49 -49 -48.2 -47
In the passive radial, the value of index IG is zero. The negative value of IG is the improvement of the system reliability. The two PVDGs (PVDG1 + PVDG2) configuration is the most reliability indices of the distribution system while the PVDG1 configuration is the worst reliable indices. In addition, the two PVDGs (PVDG1 + PVDG2) are the most
effective as regards the improvement of EENS. The specific PVDG configuration is given using the composite index for the reliability improvement in the distribution network. The optimal PVDG configuration is the most reliability improvement with the minimum value of composite index, IG.
Table 9. Composite reliability index, IG within island operation mode.
configuration IG
50% of PV output power 75% of PV output power 100% of PV output power
PVDG1 -0.25615 -0.50385 -0.51692
PVDG2 -0.34692 -0.46077 -0.79615
PVDG1+PVDG2 -0.60308 -0.88769 -1.31231
According the results from table 9, the two PVDGs (PVDG1 + PVDG2) configuration has the minimum value of composite index, IG and this configuration is the most reliable. A set of index regarding with the impact of PVDG on the interruption frequency, the interruption duration and the expected energy not supplied to the load point within the ineffective area of PV output power is zero. All PVDG configurations decreased the index SAIFI, SAIDI and EENS of all load points within the effective area of PV output power. The indices SAIDI and EENS depend upon the annual outage
time. The impact of PVDG on the SAIDI and EENS of each load point has the same sign; the reliability indices are uniformly affected by the PVDG.
distribution system. Besides, the high internal failure rate and long restoration time of the distribution parameters and PVDG can badly get worse the overall system reliability.
5. Conclusion
The overall system reliability within island operation mode is presented by integrating PVDG in the practical distribution network. A set of indices (IGSAIFIij, IGSAIDIij and IGEENSij)
including the interruption frequency, interruption duration and expected energy not supplied to each load point is reported for assessment of the impact of PVDG on the reliability in the practical distribution network. This paper proposes the analytical approach for finding the composite reliability index on the impact of PVDG. The advantage of the composite index IG comparing to the existing reliability indices is to describe the accurate overall system reliability in the practical distribution network with the impact of PVDG configuration. The composite index, IG summarizes the positive and negative impacts of PVDG on the three reliability indices such as SAIFI, SAIDI and EENS in all load points. The composite index can determine the optimal PVDG configuration regarding the improvement of overall reliability of the system. Accordingly the results, the configuration (PVDG1+ PVDG2) are the most reliability improvement with the minimum value of index IG. It is difficult to predict the reliability of the distribution network of every load point and the system reliability after PVDG connection or disconnection due to the random behavior of PV output power, numerous switching operations on a daily base and the complexity of the distribution network. The proposed methodology is to get the impact of various PVDG configurations on the reliability of the system.
References
[1] R. Billinton and Ronald N. Allan. Peliabilit, Reliability Evaluation of Power System, New York, 1996.
[2] T. Adefarati and R. C. Bansal, “Reliability assessment of distribution system with the integration of renewable distributed generation”, Applied Energy, vol. 185, pp. 158-171, October 2017.
[3] P. Paliwal and N. P. Patidar, “Distributed generator placement for loss reduction and improvement in reliability”, World Academy of Science, Engineering and Technology, vol. 4, no. 9, pp. 1409-1413, 2010.
[4] A. A. Osama, N. Safari and C. Y. Chung, “Reliability assessment of microgrid with renewable generation and prioritized loads”, IEEE Green Energy and Systems Conference (IGSEC)”, pp. 1-6, November 2016.
[5] C. Guoyan et al., “Reliability evaluation of distribution system with distributed generation,” Materials Science and Engineering (ICMMR), pp. 1-8, January 2017.
[6] S-Yul Kim and J-O Kim, ” Reliability evaluation of distribution network with DG considering the reliability of protective devices affected by SFCL”, IEEE Transactions on Applied Superconductivity, vol. 21, pp. 3561-3569, no. 5, October 2011.
[7] R. M. Ciric and N. L. J. Rajakovic, “A new composite index of reliability of supply in the industrial systems with distributed generation”, Electrical Power and Energy Systems, vol. 44, pp. 824-831, September 2012.
[8] Thin Thin Moe and Myint Thuzar, “Reliability enhancement of radial distribution system using optimal placement of PVDG”, Universal academic cluster (UAC), Thailand, pp. 1-6, May, 2019.
[9] Jeongie Park, et al., “A probabilistic reliability evaluation of power system including solar/photovoltaic cell generator”, IEEE Power and Energy Society General Meeting (PES), pp. 1-6, July, 2009.
[10] Thin Thin Moe, Kyaw Myo Lin, “Reliability assessment of distribution network with photovoltaic distributed generation considering multi-state model of PV capacity” International Conference on Science and Engineering (ICSE) 2018 YTU, Yangon, pp. 1-6, December 2018.
[11] Prapon et al., “Assessment of solar energy potentials for the Union of Myanmar”, Silpakorn University, Thailand, September 2009.
[12] A. Aflferidi and R. Karki, “Development of probabilistic reliability models of photovoltaic system topologies for system adequacy evaluation” Applied Sciences, pp. 1-16, February2017.
[13] MESC, “Town Pyone distribution network data from Owebo substation”, Mandalay Area, 2018.
[14] T. Jen-Hao, S. W Luan, D. J. Lee and Y-Q Huang, “Optimal charging/discharging scheduling of battery storage systems for distribution systems interconnected with sizeable PV generation systems,” IEEE Transactions on Power systems, vol. 28, pp. 1-6, November 2012.