Characterizing Conversion Points and Complex
Infrastructure Systems: Creating a System
Representation for Agent-Based Modeling
LIZ VARGA,
1TONCI GRUBIC,
1PHILIP GREENING,
2STEPHEN VARGA,
1FATIH CAMCI,
3AND TOM DOLAN
4 1Complex Systems Research Centre, Cranfield University, UK;2School of Management and Languages, Heriot-Watt University, UK;3Department of Industrial Engineering, Antalya International University,
Turkey; and4International Centre for Infrastructure Futures, Science Technology Engineering and
Pub-lic PoPub-licy, UCL, UK
Received 23 January 2013; accepted 3 March 2014
Infrastructure, which is used to extract, transport, store, and transform resources into products or services to meet our utility needs faces numerous challenges caused by the agency of the various actors in the system. To understand these challenges, we propose it is necessary to move beyond considering each utility system as a distinct silo. In this paper, a conversion points approach is developed to characterize multiutility systems at any scale and for any spe-cific or theoretical location. The story is told of the development of a conversion points approach and its application is examined using an agent-based model. Transport, energy, water, waste, and telecommunications systems are gov-erned and run independently but in practice are highly interdependent. A way to represent all utility systems in an integrated way is described and the benefits of this representation are applied to UK household consumers. VC 2014
Wiley Periodicals, Inc. Complexity 19: 30–43, 2014
Key Words:critical infrastructure; complex system representation; utility conversion; interdependency; agent-based model design
1. INTRODUCTION
‘‘
I
nfrastructure refers to the physical assets underpinning the UK’s networks for transport, energy generation and distribution, electronic communications, solid waste management, water distribution and waste water treat-ment’’ [1]. However, the physical assets create numerousmanagement challenges for all national governments [2,3], and many international bodies such as the European Union and United Nations [4,5]. The UK National Infrastructure Plan [6] identified: Obsolescence, Globalization, Growing Demand, Climate Change, and (unplanned for) Interde-pendence as the five major challenges for future infrastruc-ture provision in the UK. These challenges arise because of the agency of owners, operators, regulators, government, and users and need resolving as effective infrastructure is required by society to provide a basis for economic growth [7], public good and environmental sustainability.
In response to these challenges and to the disciplinary focus of particular utility system technologies, it is neces-sary to move beyond considering each utility as a distinct silo providing a single utility product, an approach that has dominated UK infrastructure thinking since utility privati-zation began in the 1980s. In its place is required an inter-utility, utility services, and future technology perspective, based upon characterizing the whole system as a network of conversion points, each of which can be defined at vari-ous scales. When considered holistically, the interaction between different infrastructure types, infrastructure opera-tors, policy makers and a range of end customers (domes-tic, commercial, industrial, etc.) is a complex system: it is coevolutionary and has emergent properties, both desirable and otherwise. We propose that the principles of complex-ity science and agent-based modeling (ABM) can provide valuable insights into the socio-technical-economic growth of infrastructure systems while providing a means to extend uses of complexity science in national infrastructure which have mostly focussed on identification of vulnerabilities which lead to (usually) cascading failures in interconnected infrastructure networks (e.g., [8]).
Our paper examines the hypothesis that ‘‘by redesigning interutility conversion points in the context of future tech-nology and with a services focus, that transformational improvements can be identified and modeled, and options selected for action which address the efficiency and resil-ience challenges of national infrastructure.’’ We present the development of an approach which focusses on the notion of a conversion point, an abstract component which carries out a conversion, each instance of which connects with some other instances of conversion points to represent the physical, technological, social, and economic aspects of national infrastructure systems. By doing this, our overall goal is to demonstrate that changes to any existing conver-sion point or points for a specific utility product, have con-sequences for other conversion points and systemic properties, such as sustainability, adaptability, and resil-ience. Planned changes, particularly in the context of emerging technologies and a service-user focus, should con-sider the dynamical effects upon the conversion system, to improve economic, environmental, and societal outcomes.
By describing the components of the infrastructure sys-tem using conversion points, we can judge the true scale of resources consumed, production and distribution ineffi-ciencies, and technological opportunities in the system. The effects of changes on resource availability, production capacity, technological innovation, and demand response can be assessed, through application of ABM as a tool to examine how individual conversion points reconfigure within different policy scenarios, such as:
Temporary subsidies to incentivise use of renewable sources and technologies;
Incentives to outsource energy demanding services (heating, washing, cooking, etc.) to third parties;
Caps on consumption of water, heat, and electricity;
Removing so called hidden and ‘‘perverse’’ subsidies and injecting them into more sustainable energy generation technologies;
Taxing nonrenewable, polluting, and carbon inten-sive energy extraction, generation, distribution, and consumption systems and potentiality types (so called tax shifting).
This reconfiguration results in a change to the emer-gent properties of the complex infrastructure system which are captured through the modeling of the interutil-ity conversion points. However, before application of ABM, a flexible conceptual framework for characterization of any infrastructure system is required.
Beginning from the perspective of individual utility conversion points, this paper develops a flexible concep-tual framework applicable to any infrastructure system. There are four stages to the development of the frame-work, (a) identification of the value of a conversion point which is broader than energy conversion, (b) development of a classification typology, (c) development of a process framework for conceptualization of interutility conver-sions, and (d) specification and coding of the agent descriptions which implement the interutility framework.
The conceptualization and modeling offer a number of advantages:
They allow the current state of complex infrastruc-ture systems to be mapped.
They capture waste, capacity limits, institutional and demand responses.
They are applicable at any scale of detail and can be used to facilitate discussion among infrastructure stakeholders to identify:
The least resilient areas of the infrastructure system.
Possible alternative methods for the provision of goods and services required by society.
Areas where action is required to improve infra-structure provision.
Additionally, they provide a system representation [9] from which complex infrastructure systems can be modeled using ABM, to allow simulation of future pol-icy decisions, new technologies and assess the expected impacts of these on the infrastructure system.
2. INFRASTRUCTURE AND CONVERSION POINTS
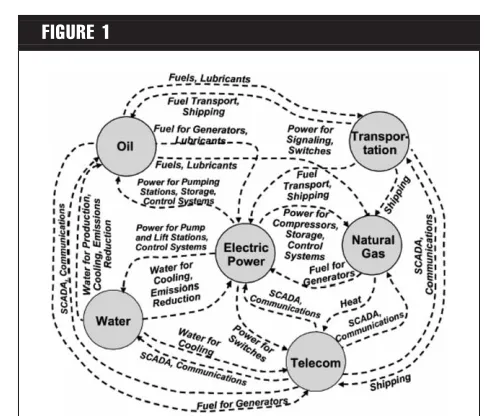
All complex infrastructure systems are comprised of numerous interconnected conversion points. We define a conversion point as ‘‘a plant or device or distribution channel which operates upon one or more utility resource or product, converting them in some way from extraction or capture of a resource through to end user service con-sumption.’’ No two conversion points are the same; each is a unique combination of geographical location, physical assets, technological configuration, production efficien-cies, consumption and demand patterns, and associated institutions. Ref. 3 proposed a conceptual model of the operational interdependencies in infrastructure systems (see Figure 1). In this model, conversion points are implicit in each utility node and in each interconnection.
At each utility node, various suites of technologies are used to convert both renewable and nonrenewable resour-ces into utility products, represented by the nodes ‘‘Oil,’’ ‘‘Electric Power,’’ ‘‘Natural Gas,’’ and ‘‘Water.’’ ‘‘Transporta-tion’’ and ‘‘Telecom’’ are different in that they provide an immediate service—mobility and communicated informa-tion; unlike the others, they are continuous conversion points with a capacity for service provision per distance of infrastructure. Other than for ‘‘Oil,’’ discrete utility-bound distribution systems exist to transport ‘‘Electric Power,’’ ‘‘Natural Gas,’’ and ‘‘Water.’’ Interconnections (the dashed lines in Figure 1) describe the service demands of each utility on other utilities, for example, Water for Cooling Power Generation; Power for Gas Compression. Signifi-cantly, conversion points are also present beyond the boundaries of Figure 1 at the point of consumption.
Another perspective upon integrated infrastructure sys-tems based upon resource life cycle is provided by The European Parliament [10]. Each subsystem, in Figure 2, is a conversion point that occurs at specific geographical loca-tions, making use of assets such as buildings, machinery and materials, using specific technologies, and resources such as gas and water. The representation is of a string of subsystems required to deliver a service from a resource (reading Figure 2 from right to left, respectively). The sub-system for distribution is a node like every other node.
Water can be represented in similar subsystem format: from use of primary resources, their abstraction or blend-ing (e.g., from a reservoir), conversion (multiple steps to remove impurities), distribution through water mains, water conversion (e.g., using a boiler to generate hot water from cold water), and service (e.g., hygiene through show-ering). Waste/sewage and solid waste can equally be rep-resented, but in reverse insomuch as subsystems are driven by the collection of waste. Transportation and Tele-communications are similar in that resources are required for the maintenance and provision of routes (e.g., tarmac
FIGURE 1
Conceptual model of the operational interdependencies between common infrastructure systems (reproduced from Ref. 3).
FIGURE 2
for road surface replacement, and power for telecommuni-cations switches), and services are continuously provided based on the volume demanded by users.
It follows that the national infrastructure can be con-ceptualized as a collection of interacting subsystems, a system of conversion points, which convert resources into service. Therefore, a method to accurately conceptualize conversion points and the interactions between these is an essential tool when taking an holistic overview of any infrastructure system. The following sections present an account of our conceptual development of the notion of conversion points. The outcomes are a simple and refined classification for the conceptualization of infrastructure systems as collections of conversion points.
3. A SIMPLE CONVERSION POINT CLASSIFICATION
Our initial classification of conversion points was into three types: product conversion, distribution conversion, and final consumption conversion. It conflates the life cycle view [10] into a typology which is orthogonal.
3.1. Type 1: Product Conversion
Type 1 is the conversion of one product/resource/ energy carrier into another product/resource/energy car-rier. This type of conversion is undertaken at all utilities, and can be based upon renewable or nonrenewable inputs. For example, the conversion of coal to electricity, the conversion of ‘‘raw’’ water into potable water, the con-version of crude oil into a range of petroleum products, and the conversion of wind energy into electricity. Type 1 conversions involve efficiency losses, the consumption of other utility products, and the possible creation of by-products. The by-products produced from type 1 may be ‘‘desirable,’’ that is, new resources suitable for further con-versions, for example, waste heat from power generation becoming usable heat from Combined Heat and Power plants; or ‘‘undesirable,’’ that is, waste products such as carbon dioxide emissions, nuclear residue, sewage sludge, and so forth.
3.2. Type 2: Distribution Conversion
Type 2 is the relocation of a product/resource/energy carrier. Type 2 conversions can take place either before or after a type 1 conversion, to supply the input to a type 1 conversion (such as coal from a mine to a power station) or distribute outputs from type 1 to the next point of use. Type 2 conversions may be co-ordinated on the national scale such as the national gas grid and the national elec-tricity grid, or be based upon localized assets such as gas or water supply pipes. Type 2 conversions may involve efficiency losses such as leakage or degradation in utility products as a result of transit; and the consumption of
other utility products, for example, electricity to pump water providing distributed potable water.
3.3. Type 3: Final Consumption Conversion
Type 3 is the conversion of a product/resource/energy carrier into a state which can deliver a service. The recipi-ent of the service may be domestic, commercial, indus-trial, or another infrastructure provider. For example, the conversion of petrol or diesel in the combustion engine to create mobility for passengers, or the conversion of elec-tricity into the mechanical energy used by a forklift truck to move goods, or the conversion of gas into heat for cooking food. Type 3 conversions may also involve effi-ciency losses, the consumption of other utility products and the creation of by-products, both ‘‘desirable’’ and ‘‘undesirable,’’ for example, heat created during cooking can reduce space heating demands, and petrol consumed while driving creates carbon monoxide, harmful to health. User behavior is critical to consumption, for example, driving behavior influences distance achieved from each liter of petroleum.
A number of general themes apply across all conver-sion point types such that all converconver-sion points, regardless of classification, can be characterized with regard to five basic rules/properties as follows:
a. A device, appliance, or physical asset at the conver-sion point performs the converconver-sion, essential features include: capacity, efficiency, cost profile, age, reliability.
b. All conversion points are based upon a prevailing technology, typically chosen at the time the conversion point was installed.
c. A proportion of various products/resources/ energy carriers must be provided as an input to any conversion point.
d. A quantity of a desired product/resource/energy carrier will be an output from the conversion point, as well as a proportion of by-products, both ‘‘desirable’’ and ‘‘undesirable.’’
e. The operation of the specific conversion point will depend on the skills and behaviors of the person using or managing the conversion point, that is, some instances of conversion points will be more efficient than others.
It follows, that all conversion points within any com-plex infrastructure system can be defined as type 1, 2, or 3, and assigned a set of behavioral/performance rules linked to the rules a–e. Therefore, the simple classification of conversion points allows each conversion point to be considered as an ‘‘agent’’ following a clearly defined set of performance rules, and the entire complex infrastructure system to be defined as a series of interacting agents.
system, this conceptualization is an oversimplification of the interactions and interdependencies taking place within that system. Therefore, any agent-based model based upon the above may fail to accurately represent the extent of interdependence between agents, and therefore gener-ate erroneous conclusions regarding the emergent proper-ties of any complex infrastructure system.
The primary reason for this shortcoming is a lack of flexibility in the conceptualization. Each agent can be rep-resented as one of the three types: Producer, Distributor, and Consumer, whereas in reality each conversion point/ agent performs multiple actions across these types. For example, a nuclear power plant is primarily a type 1 ‘‘pro-ducer’’ agent, however the smooth functioning of the con-version point also requires type 3 ‘‘consumer’’ behavior; the conceptualization fails to represent this. Similarly, a household is primarily a type 3 ‘‘consumer’’ agent but with increased availability of microgeneration technology can also become a type 1 ‘‘producer’’ agent or prosumer [11]. Any system that fails to represent these subtleties at the conversion point level will produce an incomplete rep-resentation of the infrastructure system.
A number of secondary reasons apply:
First, the simple typology fails to recognize the dynam-ics of the systems and in particular ignores time. It assumes resources can be produced, distributed, and con-sumed instantly. In particular, this highlights the gap in the typology of interim storage, in which peak demand for
electricity can be met by hydro-powered plants which pumped water when electricity was cheap, to provide electricity at peak prices.
Second, the constraints and opportunities of legisla-tion, regulalegisla-tion, policy, and so on, are not explicitly recog-nized. Changes in these exogenous factors will influence the behavior of consumption decisions about resources (e.g., use of shale gas), and will drive new technologies to be developed (e.g., clean coal technologies).
In the following section, the conceptual model is refined to consider each conversion point as a collection of activities.
4. REFINED CONVERSION POINT CLASSIFICATION
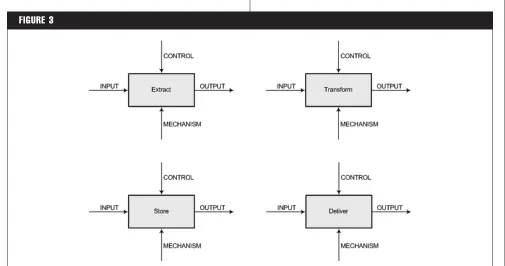
In producing a conceptualization to represent the com-plexity of an entire infrastructure system, it is important to not oversimplify the representation of each conversion point. Therefore, each conversion point should be concep-tualized not as an individual activity, rather as an inte-grated assembly of the key activities undertaken at the conversion point. Based upon this insight, we propose that all activities can be classified into one of four groups and that various combinations of these groups will take place at each conversion point (see Figure 3).
Extract—analogous to a product conversion—it rep-resents the conversion of one product/resource/ energy carrier into a form suitable for transforma-tion into a service.
FIGURE 3
Transform—analogous to a final consumption con-version—it represents the conversion of a product/ resource/energy carrier into a service.
Deliver—analogous to a distribution conversion—it represents the movement of a product/resource/ energy carrier from one location to another.
Store—represents the storage of a product/resource/ energy carrier at a conversion point. This could take the form of an electric battery or a store of a fuel supply prior to an extract activity, for example.
Given that each conversion point is now a collection of activities, it is necessary to define a rule set for each activ-ity within a conversion point. For this reason rules a–e used to govern conversion point behavior in the simple model are replaced by the Input-Control-Output-Mechanism (ICOM) syntax [from 12].
The IDEF0 modeling language (semantics and syntax), and associated rules and techniques, are a standard for developing structured graphical representations of a sys-tem or enterprise. Where, based upon adaptation of the standard for our purposes:
Inputs are the product/resource/energy carrier used in an activity to produce outputs.
Controls are the standards, regulations, and legisla-tion that govern how any activity is performed.
Mechanisms are the resources (technologies, devices, and assets) and skills (human capital) underlying any activity.
Outputs are the product/resource/energy carrier out-put produced through an activity based upon the Input, controls, and mechanisms applied.
This allows all conversion points to be represented as a collection of the activities shown in Figure 3.
IDEF0 was originally developed in the 1970s as part of a U.S. Air Force Integrated Computer Aided Manufacturing program to give a system engineering approach and a structured representation of the functions, activities, or processes within a modeled system or subject area. There-fore, application of elements of the IDEF0 method, in the context of conversion points, can be used to support a concise yet flexible approach to conceptual modeling of complex infrastructure systems. Examples of IDEF0 include: representation of a rubber goods production line to assess reasons for variable product quality; a road con-struction company processes to check standards compli-ance; customer training processes with feedback loops to training development for lessons learnt [13].
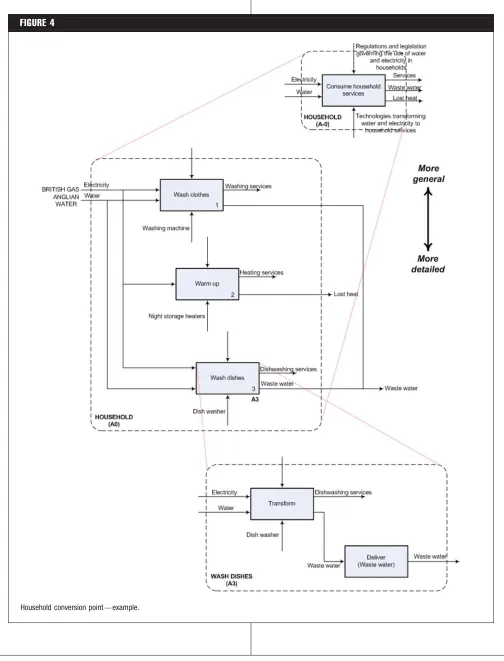
A distinct advantage of using the IDEF0 modeling lan-guage is that it allows each conversion point to be repre-sented at different levels of detail. Figure 4 gives an example for a household conversion point. The top level context diagram (A-0) conceptualizes the inputs required,
and outputs arising from provision of a full suite of house-hold services, as well as the controls (regulation and legis-lation) and mechanisms (technologies) shaping household consumption of services. The second level diagram (A0) identifies each individual service consumed within a household and the ICOM elements linked to each service. In Figure 4, the A0 diagram is indicative rather than defin-itive because other household services can be identified such as cooking or drying clothes. When producing an A0 diagram to represent a conversion point it is important to capture details of all services required at that conversion point. The A3 diagram represents that each service can be broken down into a combination of the four fundamental activities of a conversion point: Extract, Transform, Store, and Deliver, as defined earlier.
Using this method, any infrastructure systems can be viewed as a collection of conversion points; each repre-sented by a top level context diagram (A-0), and can also be broken down into a series of fundamental activities that underpin the services taking place at the conversion point.
4.1. Characterizing Inputs and Outputs as Potentialities
A conceptual model of an infrastructure system must not overlook or oversimplify the interrelationships between key elements of the system, because these elements of the system need to be understood if complexity in the system as a whole is to be understood. This is particularly true if the conceptual framework is to be used as a foundation for creation of an agent-based model of an infrastructure sys-tem. If key interrelationships are not conceptualized accu-rately in the conceptual framework, emergent properties of the system may be missed or inaccurately identified. At present, the proposed refined conceptual framework does not focus on the origin or type of inputs into the four key activities, or make explicit reference to the possibility that waste outputs from one activity have the potential to become inputs into another activity.
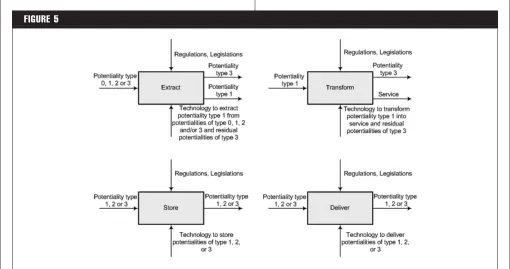
Therefore, inputs and outputs must be considered in more detail. We propose that the inputs and outputs (product/resource/energy carrier) for each of the four key activities at a conversion point (Figure 3) are regarded as potentialities because they have the potential to fulfil a user need through the provision of a service or product. These potentialities can be classified as four types, where type 0 is most desirable:
Type 0: sun energy, biomass, wind, tide energy, wave energy, geothermal;
Type 1: electricity, water, and heat;
Type 2: gas, coal, nuclear; and
Type 3: waste (water, solid, nuclear, heat, carbon dioxide).
FIGURE 4
However, not all potentiality types can be inputs into the four key activities, and potentiality type 0 is never an out-put from any of these activities.
Consideration of potentialities is important because at the micro scale of user demand fulfilment the potentiality used and its associated technology is a significant charac-teristic of the system. For example, the demand for a warm house can be met in a number of different ways, each based upon extraction of the potentiality that resides in one of the four potentiality types. A type 0 example is heating based upon solar panels, a type 1 example is heat-ing based upon electric heaters, a type 2 example is gas heaters, and a type 3 example is the use of wood-burning stove. These examples are intended to be indicative of the numerous ways in which a demand can be fulfilled by dif-ferent potentiality-technology combinations. This level of detail can be lost if the conceptual model is oversimpli-fied. It follows that an oversimplified conceptual model will provide an inadequate foundation for an agent-based model designed to identify emergent properties from interactions in the system.
Additionally, consideration of potentialities makes clear the distinction between the key activities Extract and Trans-form. Extract is used to ‘‘extract’’ potentiality type 1 [water, heat, and electricity (energy), recognized as ‘‘basic’’ human needs] by using any combination of potentialities of types 0, 1, 2, and/or 3. Whereas, Transform activities use water, heat, and electricity (energy) to fulfil immediate user needs (clean clothes, hot meals, cleaning, drinking, etc.)
4.2. User Behavior
Standards, regulations, and legislation are all forms of control which constrain or liberate action at the agent level. Controls are changed infrequently or not at all. Con-trols determine typical user behavior. Liberation of con-trols and rebound effects [14] are examples of triggers which change user behaviors and which need definition.
Mechanisms are the availability of resources and tech-nologies that are required to complete the process. This includes machines and other tools but may also include people with particular skills.
Users at each conversion point will be constrained by controls and mechanisms. Other traits of agents include the location of a user which defines the availability of potentiality (e.g., the amount of sun hours per day or year), wealth, environmental empathy, and relevant skills (or technological know-how).
Controls, mechanisms, and agent traits define how an agent behaves within a particular scenario.
4.3. Summary of Key Points from the Refined Classification
Infrastructure should be regarded as a complex sys-tem comprised of interacting conversion points.
Conversion points are unique geographically located aggregations of four key activities (Extract, Trans-form, Store, and Deliver).
FIGURE 5
A set of rules based upon ICOM syntax (inputs, con-trols, outputs, and mechanisms) can be assigned to all activities at a conversion point.
Dependent on the ICOM elements of the conversion point, the same service can be delivered in a num-ber of different ways.
A change to any of the ICOM elements of an activ-ity, will change the characteristics of a conversion point. A change to any conversion point will have an impact on the infrastructure system. Therefore, infrastructure systems are coevolutionary systems shaped by the interaction of conversion points.
Each conversion point can be represented at a high level A-0 or in more detail A3.
The classification system permits four distinct con-version point groups: households, business custom-ers, industrial customcustom-ers, and infrastructure playcustom-ers, allowing each conversion point to be represented as an agent for inclusion in an ABM.
Even within similar conversion point classes no two conversion points are the same because agent traits make the dynamics and operation of the conversion point unique.
One of the prime benefits of our representation of infrastructure as conversion points is that interde-pendencies are made explicit. This means that our database of conversion points can be interrogated for interdependencies. The identification of spatial interdependency (through shared zones of similar longitude and latitude) is a key opportunity to assess locational risks such as those that might arise from floods or attacks. Technological interdependencies may be identified through the dependence of many or large conversion points using the technology. Resource interdependency is recognized by many or large conversion points using the same resource, such as gas. Governance interdependency can be established through the use of the same controls by many or large conversions.
The next section specifies the ABM framework.
5. ABM FRAMEWORK
It is helpful to build upon an existing typology of agent-based models which has been developed in the context of transition of utility systems. We use the Chappin and Dij-kema [9] framework as their focus is on energy system tran-sitions which require changes in technological components, effecting a change in performance, leading to new policy design and implementation which effect actor behavior, leading to more technological change. The transitions pro-cess embraces innovation of both technical systems and of policies, regulations, R&D, and investment.
Transitions in complex systems are the coevolutionary consequences of multiple aspects including user behaviors
[15]. In all coevolutionary systems, there are three funda-mental needs [16]:
1. to introduce novelty into the system, a mechanism must exist to create variants of existing structures; 2. selection pressures need to be consistent, so new
variants need to be created more frequently than new selection criteria otherwise the evolutionary process would not bring about new trial and error structures that are better adapted;
3. a retention mechanism must be present that trans-mits structures from the present to the future, oth-erwise new developments could not build on previous adaptive achievements.
Chappin and Dijkema [9] define five components to an agent-based model for energy transition: (1) system represen-tation, (2) exogenous scenarios, (3) design of transition assemblage, (4) system evolution, and (5) impact assessment. System representation requires a definition of the agents, components and subsystems which represent that part of the infrastructure system which is to be modeled at an appropriate scale. The system representation is con-ceptual. Each element is implemented into the model for-malizing the identity and rules of each agent and the properties and performances of each object, such as a dis-tribution network. Communications protocols are also defined in the system representation and permit social and physical networks to be described.
Exogenous scenarios are necessary to exclude those parts of the system which are unaffected by the model. Exogenous scenarios are defined by global variables. The addition of each new variable creates an exponential effect on the number of model iterations and so few global vari-ables are preferred. The model itself uses the varivari-ables but does not update them.
Transition assemblages can be modeled with increasing sophistication to suit the needs of the model. Transition assemblages allow controls from the IDEF0 framework to be modeled. If controls themselves become endogenous to the model, then the model will show how policy and regulation might change and thus assesses regulatory adaptability. Mechanisms from the IDEF0 framework such as the availability of particular technologies are also tran-sition variables.
System evolution is a consequence of the behavior of the agents to both exogenous and endogenous parts of the system. Micro and macro validation is necessary to ensure the validity of the model [17].
Impact Assessment is the final stage of the Chappin and Dijkema framework. System level measures need to be established as well as thorough testing strategies and robust analysis of results.
6. AGENT-BASED MODEL FOR CONVERSION POINTS
In developing our understanding of an interutility infrastructure system, we have taken three steps: first, we formed a simple conceptual classification, a typology which represents types (of utility conversion activity) rather than empirical cases [18]; second, we revised the simple classification noting that each utility conversion was not an individual activity but an integrated ensemble of activities which could be unbundled to represent differ-ent scales, noting that resources themselves could be clas-sified into potentialities which were both inputs and outputs of a conversion point, which itself was subject to controls (such as policies) and mechanisms (such as tech-nologies); third, we selected an agent-based model frame-work which allowed us to define scenarios, and which provided a link to mechanisms and controls through the notion of transition variables.
6.1. Conversion Levels
We envision the Utility Conversion model to have three levels:
6.1.1 Level 1: Provision
Infrastructure-type (I-type) agents represent entities involved in energy generation and distribution, solid waste management, water distribution, waste water treatment, transportation, tele-communications, and any other utility conversion. Infrastructure-type agents will be modeled with certain availability and reliability characteristics to capture real-world situations of technology failure. When, for example, an electricity generator fails to produce elec-tricity (or the quantity he is expected to produce) due to some unexpected (or even expected) outage, he will need to purchase replacement energy for his lost output to meet his contractual obligations. This energy may come from another I-type agent within the system or may be bought from outside the boundary of the system (an agent of last resort) which may have further implications on the competitiveness of this agent, for example, The National Grid impose penalties when other agents are required to supply the short-fall.
I-type agents will provide potentialities of type 1 to Consumer-type (Houshold for the purposes of our exam-ple and so H-type) agents who will be represented at the highest level of activity (A-0) with fixed block elements inside. H-type agents will vary in terms of their service needs and their demanded product quantities of gas, water, electricity, waste, mobility, and information. These needs and quantities may change every tick (time-step in the model) based on behavior which reduces demand and information which makes cheaper alternatives preferable. Supply of utility product quantities by I-type agents will change to reflect the uncertainty and differences (mainly in efficiency) between I-type agents. The time unit is
quarterly (length of every tick is three months) which allows us to capture seasonality effects (changes in demand and supply by season). The duration of the total simulation run will be the period 2012–2050. This is taken from the UK’s legally binding policy to reduce CO2
emis-sions by 80% (and arguably 90% to be effective) by 2050 compared to 1990 levels [19].
6.1.2. Level 2: Service
This level will build upon the Provision level by unfold-ing the H-type agents from fixed black box (highest level representation) to a level where their heterogeneous needs and technologies (appliances) used to fulfil those needs will be modeled. This allows H-type agents to propose improvement requests, install and operate different tech-nologies (even becoming producers and/or suppliers of electricity, heat, for other agents, etc.), and even to out-source some of their ‘‘needs’’ (i.e., removing some of their existing blocks entirely) to specific service providers (e.g., washing, cleaning, cooking, etc.).
6.1.3. Level 3: Demand/Behavior
This level builds upon the previous two levels. In addi-tion to funcaddi-tionalities provided by these levels, this level will aim to capture the demand behavior of H-type agents. This level focuses on resource conservation as opposed to resource efficiency [20]. The difference between these two strategies is that resource efficiency aims to improve the ratio between resource related services and resource inputs without compromising the quality of services; while resource conservation aims to reduce resource consump-tion by lowering the quality of resource related services. This may come from capping the amount of resources available to consumers which implies lower quality serv-ices (e.g., changing the degree to which a household: bathes or takes showers, turns off lights, fills dishwashers or washing machines, regulates indoor temperatures or cooks).
6.2. Conversion Subprocesses
The agent-based model has five subprocesses for the Level 1—Provision model: Wiring, Formulating Improve-ment Requests, Deciding ImproveImprove-ments Selecting Tech-nologies and updating the System State.
We expect these subprocesses to become more elabo-rate as we move to Levels 2 and 3.
6.2.1. Subprocess 1: ‘‘Wiring’’ H-type Agents with
I-type Agents
between I-type and H-type agents happen, rather than by representation of hard or physical connection via infra-structure (cables, pylons, gas and water pipes, sewage, etc.). Wiring of H-type agents to the physical landscape of the infrastructure in a geographical landscape is possible when supply and demand needs specific verification. In any event, checks can be made on the availability of particular potentialities in the geographical space of the H-type agent. Real selection and business relationship will be made in conceptual space where I-type agents will be represented with the capacity to supply certain amounts of utilities under certain cost and other (e.g., CO2) conditions, and
H-type agents will be represented with their utility demands (quantity and type) and conditions they are prepared to buy them (e.g., price, ‘‘greenness’’ of source, etc.). Hence, selec-tion of a supplier (an I-type agent) by a consumer (an H-type agent) will be based on their cost/price and ‘‘green-ness’’ attributes of their offer which in turn may reflect a certain ‘‘value, attitude and belief’’ system of a consumer and will be done every tick. Selection frequency may be dependent on many things but we use current legislation which allows utility customers to change their supplier every three months (1 tick).
6.2.2. Subprocess 2: Formulating Improvement
Requests by I-type Agents
Infrastructure agents are motivated to improve to opti-mize their efficiency.
We have envisioned two types of improvement requests that can be placed by an I-type agent1:
Type 1—improve output of a key activity block: this will focus on the match between the output poten-tialities with real demand (e.g., reducing overproduc-tion and/or waste of type 3). If the fitness funcoverproduc-tion concerned only minimizing costs, then minimizing the waste of overproduction may be more important (and consequently shape an agent’s attitude towards improvement request in that direction) than mini-mizing waste potentialities which leave a big carbon footprint (e.g., waste water or nuclear waste) as would be the case where the fitness function con-cerned minimizing the carbon footprint.
Type 2 improve efficiency with which inputs are con-verted into output potentialities:this focuses on
replac-ing or significantly improvreplac-ing a technology input of the block/activity. For example, if the fitness function is about cost minimization, then a technology which is more efficient than one which may be more environ-mentally friendly may be proposed by the agent.
The formulation of improvement requests will be moti-vated and informed by the prevailing fitness function (cost, CO2, and resilience) which will vary by value for
each I-type agent.
There are two further functionalities that need to be defined: (1) life—creating new agents as in the case of Sub-process 1 where the system agent may decide to put, for example, additional energy and water I-type agent to bal-ance demand with supply and (2) death—for unsuccessful agents. The ‘‘market’’ or system agent may also ‘‘step in’’ in situations where economically (or environmentally or resil-ience) ‘‘unhealthy’’ agents exist by proposing they change and adopt a new technology/block which is in line with the prevailing fitness function (e.g., from solar to coal if the fit-ness function is to minimize cost, or vice versa if the fitfit-ness function is to minimize carbon footprint).
6.2.3. Subprocess 3: Collecting, Categorizing, and
deciding on Improvement Requests
The invisible hand of the market [21] will operate through the implementation of a system agent which will consider improvement requests by categorization of requests using cluster analysis into two broad groups by: (1) potentiality (gas, water, and electricity) and (2) key activity type (Extract, Transform, Store, and Deliver). Selection of an improvement request(s) can be decided through system variables, choices might include:
Random selection (from the pool of clustered improvement requests);
Select the most frequent request in the cluster;
Select the least frequent request in the cluster;
Make a proposal that is a combination of all the improvement requests submitted;
Combination of all the above, selecting randomly at each tick.
Once the system agent decides on the new technology release, we need to instruct the model about the time that needs to pass before this release becomes available to I-type agents for adoption since potential solutions may lie in the dynamics of real-world innovations.
6.2.4.
Subprocess
4:
I-type
Agents
Deciding
Whether to Adopt the New Technology Release
At least three approaches can potentially be used by an I-type agent when deciding whether to adopt the new release proposed by the market (the system agent). The approaches are:
1
1. calculate (Euclidian) distance;
2. adoption based on disposition to innovation adop-tion; and
3. adoption based on facility/plant age and future business goals.
The first approach aims to calculate the distance (e.g., Euclidian) between the I-type agent’s improvement request and the new release. The smaller the distance between the two, the more likely the I-type agent is to adopt the release. The second approach is based on Dif-fusion Theory and it aims to establish the I-type agent’s disposition to adopt the new release. The less radical the release, compared to I-type agent’s existing attributes (relative advantage, compatibility, observability, trialabil-ity, and complexity), the more likely the agent will be to adopt it. Finally, the third approach can be defined as a function of existing facility/plant age and future business goals of the I-type agent. Namely, at some point (e.g., when an agent realizes that ‘‘conventional’’ improvements are not delivering the expected benefits/returns or when a stage is reached where things can only deteriorate and get worse) the I-type agent will have to start thinking about what will happen after the plant reaches its useful operat-ing life and needs to be decommissioned, if the agent still wants to be in the business. Therefore, we can model long-term goals of an I-type agent which will shape its attitude toward, both, formulating improvement requests and adoption of new releases. In a way, we can even use the first approach stated above to calculate the distance between the recent release and how it fits with the agent’s long-term goals. Hence, we need to define those goals and equip the agent with the ability to estimate potential future consequences of its current decisions.
6.2.5. Subprocess 5: Update to New System State
Just before the start of each simulation iteration (tick) we can expect some changes in the state of I-type agents. At least three are envisioned here:
Life (creation of a new agent) and death (removal of existing agent) which should have an impact at least on the market representation by means of impacting a number of potential locations to place a new agent;
Adoption of a new release of technology by an exist-ing agent—change in its internal block structures, that is, changes to cost and performance attributes the adoption entails;
Non-linear deterioration of agents’ cost and per-formance attributes as we proceed further in time.
All these changes will affect the cost and performance attributes of I-type agents which will then be used to cal-culate the new levelised electricity generation cost, and its water and gas counterparts to reflect the new state. Once
this is updated, we should be able to see its effects on cost/price of electricity, gas, and water in the new round of selecting I-type agents by H-type agents.
The new overall state of the model is defined by Total resource consumption (of which some is satisfied exter-nally, classified by potentiality), cost (annualized cost of infrastructure in the system), CO2 (via costs), resilience,
and so forth.
6.3 Conversion transitions
Transition Assemblages [9] which formulate policy, reg-ulation, and taxation controls might include:
Existing policies (baseline);
Temporary subsidies to incentivize use of renewable sources (potentialities type 0) and technologies;
Incentives to outsource energy demanding services (heating, washing, cooking, etc.) to third parties;
Cap consumption of water, heat, and electricity;
Removing so called hidden or ‘‘perverse’’ subsidies and injecting them into more sustainable energy generation technologies;
Taxing nonrenewable, polluting, and carbon inten-sive energy extraction, generation, distribution, and consumption systems and potentiality types (so called tax shifting);
Any combination of the above.
6.4 Conversion Scenarios
Scenarios (ibid) may depend on perceptions of growth rates of demand, economy, investment, local-ism, or using existing scenarios identified in interutility research such as [22]. Scenarios may be implemented using
A real-world representation of infrastructure and household type agents in a city or region, or an abstracted representation of the UK population.
Economic growth/contraction patterns over the period of the model.
Infrastructure investment (private and governmental).
The extent of centralization vs. localism.
6.5 Conversion attributes
Every agent or conversion point should be cap-tured in terms of key activities (Extract, Transform, Store, and Deliver) and necessary levels underpinning that conversion point. Apart from this, for each con-version point we also need to represent the following information:
according to their ‘‘themes,’’ e.g., water, gas, electric-ity, waste; disposition to innovation, long-term busi-ness goals, etc.);
Longitude and latitude (location);
Availability of resource potentiality;
Input: Potentiality type(s) and quantity(ies) (for each block/activity);
Technology used by the block (and its cost and per-formance attributes, see below);
Output: Potentiality type and/or service and quantity (for each block/activity);
Cost and performance attributes (for every technol-ogy/key activity block) of I-type agents (at level 1);
Cost and performance attributes could be modeled either on high, medium, and low levels or stochasti-cally which for well-understood technologies can repre-sent variations across sites; while for new technologies the variations may represent the uncertainties.
Disposition to innovation adoption (so called inno-vation Diffusion Theory [23] can be used in Subpro-cess 4 to inform an I-type agent’s decision to adopt a new release. According to the theory adopters can be categorized in five groups: (1) innovators (2.5% of adopters), (2) early adopters (12.5%), (3) early major-ity (35%), (4) late majormajor-ity (35%), and (5) laggards (15%).
7. APPLICATIONS
The model is viable for simulating specific geographical locations, such as towns or cities, or more broadly at national level. Scaling using the IDEF0 framework will apply. Alternative scenarios can be created, for example, the use of carbon capture storage from nonrenewable gen-erators; or capture of local resources such as solar and wind. Resilience and security evaluation can be assessed, as can short-falls in meeting demand (e.g., from a supplier of last resort). Applications are endless as the design is not utility centric, but activity centric and scalable.
An agent-based model2 has been developed using AnyLogic to consider the effects of domestic renewable technology adoption upon UK national infrastructure. In 2011, the UK domestic sector was responsible for 26% of the total energy consumption [24] so an area likely to bring changes to interdependent infrastructures would be a large-scale adoption of household generation technolo-gies such as photo voltaic, solar thermal, or gray water recycling.
Agents (H-types) are connected to the national infra-structure agents (I-types) to meet their service demands, for example, mobility, electrical power. H-type agents can then decide whether to connect to a household genera-tion technologies (a local I-type agent) based on their H-type profile and network connections. Agent behavior is dependent on multiple variables which do not interact linearly and it is through the conversion point ontology that this interaction is realized in the model. When agents replace a service delivered by a national I-type conversion point with a local I-type, they reduce demand for any or all of gasoline, electric power, gas, water sup-ply, and waste disposal from national infrastructure I-type agents. Subprocesses 3 and 4 are not implemented in this model as a predetermined set of up to seven alter-native technologies is available.
The overall consumption of natural resources, elec-tricity consumption, carbon emissions, costs and tech-nology adoption is evaluated after testing and validation of the model. Conclusions are that in the context of cur-rent technology mix used in the UK for the generation of electricity and plans to change that mix in the future, large-scale adoption of household generation technolo-gies can only make things worse when interdependen-cies are fully considered. The characteristics of household generation technologies and/or the mix of UK generation technologies would need to change to iden-tify improvements.
8. SUMMARY
This paper presented an approach to define an agent-based model for interutility infrastructure which has poten-tial to generate insights into policy options and into the coevolution of infrastructure and consumer agents. The Level 1 model is developed albeit without the automatic generation of technologies. The model has implemented the utilities’ conversion point ontology using the ICOM ele-ments. This facilitates a description of the multiple resour-ces used and generated by each utility conversion. We have demonstrated through the application of the utilities’ con-version point ontology that it is possible to redesign interu-tility conversion in the context of future technology and with a services focus. Our results show that for the given household generation technologies and the current mix of UK generation technologies, transformational changes can be identified although they are currently undesirable. Effi-ciencies are measured by losses in the conversion (from resource extraction/capture to service consumption) while resilience is measured by the adoption of household gener-ation technologies. We have thus tested our hypothesis in one detailed case study. Limitations of the modeling include the use of generic I-type agents, omission of decommissioning of infrastructure, and demand for
2
heating. However, the conversion points approach is described fully. Next steps are to apply the model to other situations and to develop code for subprocesses 3 and 4 and levels 2 and 3 as described in section 5.
ACKNOWLEDGMENTS
The authors gratefully acknowledge funding from the Engineering and Physical Sciences Research Council, UK, Grant ref EP/J005649/1.
REFERENCES
1. Institution of Civil Engineers. A National Infrastructure Investment Bank: An ICE Briefing and Discussion Paper. Institution of Civil Engineers: UK, 2009. Available at www.ice.org.uk. Last accessed January 23, 2013.
2. HM Treasury. National Infrastructure Plan, ISBN: 9780108511165; HM Treasury: UK, 2011.
3. Little, R.G. Tending the infrastructure commons: Ensuring the sustainability of our vital public systems. Struct Infrastruct Eng 2005, 1(4), 263–270.
4. European Commission. Promoting a European Framework for Corporate Social Responsibility. European Commission Agency: Brussels, 2001. Available at http://www.csrquest.net/uploadedfiles/ECGPO1.pdf. Last accessed January 23, 2013. 5. Department of Homeland Security. Critical Infrastructure Protection and Resilience Month. Department of Homeland
Secu-rity: Washington, DC, 2012. Available at http://www.dhs.gov/cipr-month-2012. Last accessed January 23, 2013.
6. HM Treasury. National Infrastructure Plan; HM Treasury: UK, 2010. Available at https://www.gov.uk/government/organisa-tions/infrastructure-uk/series/national-infrastructure-plan. Last accessed January 23, 2013.
7. Egert, B.; Kozluk, T.; Sutherland, D. Infrastructure and growth: Empirical evidence. OECD Economics Department Working Papers, Organisation for Economic Co-operation and Development. No. 685. 2009.
8. Amin, M. National infrastructures as complex interactive networks. In: Automation, Control, and Complexity: An Integrated Approach; Samad, T.; Weyrauch, J., Eds.; Wiley: England, 2000; pp 263–286. ISBN 978-0471816546.
9. Chappin, E.J.Ll; Dijkema, G.P.J. Agent-based modeling of energy infrastructure transitions. Int J Crit Infrastruct 2010, 6(2), 106–129.
10. Gram, S. Sustainable Energy Catalogue for European Decision-Makers. European Parliament: Brussels. Report id IP/A/ STOA/SC/2005-179. 2006.
11. Burr, M.T. Fill’er up: Smart grid as quick-E mart. Public Utilities Fortnightly 2010, 148(4), 4–5.
12. National Institute of Standards and Technology. Standard for Integration Definition for Function Modeling (IDEF0). Interna-tional Society of Automation: North Corolina, 1993. Available at http://www.isa.org/Content/Microsites1424/SP77_22,_Power_ Plant_Automation/Home1320/JNS_Review_IDEF0_2009-08-31.doc. Last accessed January 23, 2013.
13. Straker, D. A Toolbook for Quality Improvement and Problem Solving; Prentice Hall, PTR: New Jersey, 1995. 14. Berkhout, P.H.G.; Muskens, J.C.; Velthuijsen, J.W. Defining the rebound effect. Energy Policy 2000, 28(6-7), 425–432.
15. Foxon, T.J. A coevolutionary framework for analysing a transition to a sustainable low carbon economy. Ecol Econ 2011, 70(12), 2258–2267.
16. Murmann, J.P. Knowledge and Competitive Advantage: The Coevolution of Firms, Technology and National Institutions; Cambridge University Press: Cambridge, UK, 2003.
17. Boero, R.; Squazzoni, F. Does empirical embeddedness matter?. Methodological issues on agent-based models for analytical social science. Journal of Artificial Societies and Social Simulation (JASSS) 2005, 8(4).
18. Bailey, K.D. Typologies and Taxonomies: An Introduction to Classification Techniques; Sage: Thousand Oaks, 1994.
19. UK Parliament. Climate Change Act. Office of Public Sector Information (OPSI). The Stationery Office Limited: UK, 2008. Available at http://www.england-legislation.hmso.gov.uk/acts/acts2008a. Last accessed January 23, 2013.
20. Herring, H.; Roy, R. Technological innovation, energy efficient design and the rebound effect. Technovation 2007, 27(4), 194–203.
21. Smith, A. The Wealth of Nations (originally published 1776); Dent: London, 1977.
22. Hall, J.W.; Henriques, J.J.; Hickford, A.J.; Nicholls, R.J., Eds. A Fast Track Analysis of Strategies for Infrastructure Provision in Great Britain: Technical report; Environmental Change Institute, University of Oxford: Oxford, 2012.
23. Rogers, E.M. Diffusion of Innovations; The Free Press: New York, 1995.