Article
Effect of pH on the Formation of Amorphous TiO
2
Complexes and TiO
2
Anatase during Pyrolysis of
TiCl
4
Aqueous Solution
Mai Van Tuan 1,2, Mai Xuan Dung 3, and Duong Ngoc Huyen 1,*
1 School of Engineering Physics, Hanoi University of Science and Technology, No. 1, Daicoviet, Hanoi,
Vietnam; [email protected]
2 Department of Natural Sciences, Electric Power University, 235 Hoang Quoc Viet, Hanoi, Viet Nam;
3 Department of Chemistry, Hanoi Pedagogical University 2, 32 Nguyen Van Linh, Phuc Yen, Vinh Phuc,
Viet Nam; [email protected]
* Correspondence: [email protected]; Tel.: +84-912 153 128
Abstract: The TiO2 nanostructures resulted by pyrolysis of TiCl4 at low temperature of 80 oC are found
to be a mixture of amorphous TiO2 complexes and anatase nanostructure that depends on the pH of
the pyrolysis medium. Anatase nanostructure is predominant at low pH level and gradually converts to amorphous TiO2 complexes with increasing pH level. By means of heat treatment, the TiO2
nanostructures can be recovered from amorphous TiO2 complexes. Amongst of the TiO2
nanostructure recovered from amorphous TiO2 complexes, the anatase nanostructure shows to be the
strongest photocatalyst in decomposition of methylene blue.
Keywords: photocatalyst, amorphous TiO2 complexes, TiO2, anatase nanostructure.
1. Introduction
Titanium dioxide (TiO2), a typical metal oxide with high refractive index, chemical stability, long
durability, and nontoxicity has been widely used for many applications such as white pigments, textiles, papers, cosmetics, medicines, ceramics, etc. As a n-type wide bandgap semiconductor, TiO2
exhibits a unique photoinduced effect that involves photogenerated charge carriers on the material surface that initiate strong redox reaction of adsorbed substances and hydrophilic conversion of itself [1, 2]. The effect offers more potential applications such as splitting hydrogen from water, ultraviolet fillers, photoconductor, photocatalyst, environment cleaning, antibacterial purpose, chemical sensors, dye-sensitized solar cells (DSSC) and so forth [3 - 5].
Under normal condition, TiO2 exists in three main structures: stable rutile, metastable anatase, and
brookite phase. For pure phase it is generally accepted that anatase exhibits a higher photocatalytic activity compared to that of rutile despite of its larger band gap (3.2 eV for anatase vs. 3.0 eV for rutile). Longer lifetime for photo-excited electrons and holes in the indirect band gap of TiO2 anatase
semiconductor is accounted for the feature [6]. On the other hand, TiO2 in the microstructure have
been considered as a poor photocatalyst but in the nanostructured form, due to the quantum confinement the material shows stronger photocatalytic activity when compared to that of the microstructure [7]. The unique photocatalyst of TiO2 nanostructures are size dependent. Therefore,
clarification out the synthesis condition to achieve desirable nanostructures of TiO2 is of important to
diverse photocatalystic applications.
For the synthesis of TiO2 nanostructure, a variety of techniques based on pyrolysis of Ti precursors
such as hydrothermal, solvothermal, sol-gel, direct oxidation, chemical vapor deposition (CVD),
electrodeposition, sonochemical, and microwave method has been used [8]. Pyrolysis offers a simple route to synthesize well-crystalline TiO2 using inexpensive precursors such as TiCl4, TiCl3,
amorphous TiO2, P25, etc. In addition, the pyrolysis modest medium of low temperature and
adjustable time can provide an effective reaction environment for the synthesis of TiO2 with high
purity, good dispersion and controllable crystalline. In a series of experiments made on TiO2
synthesis in acidic medium, say HCl, we have found that the pyrolysis of TiCl4 results in a
nanocrystalline mixture of both the anatase and rutile phase. The TiO2 anatase mainly suspends in
the aqueous solution while the TiO2 rutile predominantly deposits in the sedimentation [9, 10].
Higher HCl concentration enables the agglomeration of small anatase particles forming uniform cluster and enhances the anatase to rutile transition due to the compensation of Cl- for the positive
charge of polyhedral complexes [9]. In addition to the involvement of Cl-, the pH level of pyrolysis
medium is considered to be a critical parameter regulating the anatase fraction and variety of intermediate type of Ti(OH)4 in the form of [Ti(OH)4-n(H2O)2+n]n+ or Ti-complexes. The Ti-complexes
then can decompose into amorphous TiO2 nanostructure, hence hereafter termed as amorphous TiO2
complexes. Based on that consumption, in this attempt NH4OH is used as an additive to adjust pH
of the reaction medium and then clarify pH level’s effects on the formation of amorphous TiO2
complexes as well as of anatase nanostructure during pyrolysis of TiCl4 aqueous solution.
2. Results and Discussion
Experiments show that the additive NH4OH
significantly affects the appearance and
properties of TiO2 nanostructures in the resulting
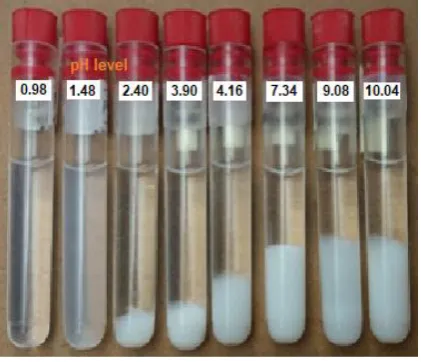
materials. As clearly seen in Figure 1, the resulting aqueous solution is transparent at low pH level but gradually changes to slightly opalescent and then separates into transparent and milky parts when the pH level exceeding 2.40. The separated milky part increases with NH4OH and becomes
unchanged as pH level exceeding 7.34. Depending on the transparent or milky state, the surface morphology of the resulting materials transforms from grain to gelation structure as shown in the SEM images in Figure 2. In the sample with pH of 0.98, the resulting material grains are uniform granular with mean size of around 50-70 nm, that in turn has found to be
clusters of anatase nanoparticles of 4-5 nm in the mean size [9]. However, when the pH level of the reactive medium increases, the resulting material grain increasingly inflates to coagulated clusters of 150-200 nm in size and gradually become jellylike or amorphous structures as shown in Fig. 2 b to Fig. 2d.
Figure 1. The appearance of TiCl4 aqueous solution
Figure 2. SEM images of TiO2 resulting from pyrolysis of TiCl4 in different pH medium at 80 °C: (a) pH = 0.98; (b) pH = 2.45; (c) pH = 10.0 transparent part; (d) pH = 10.0 milky part.
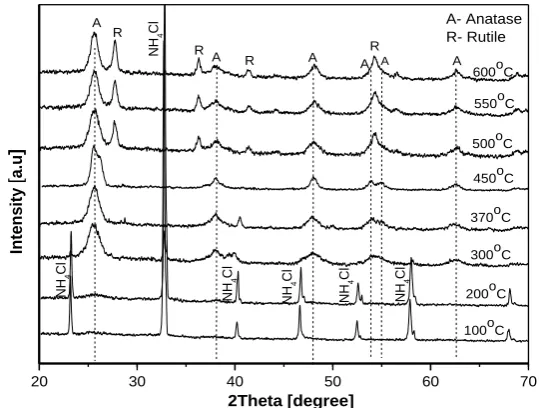
X-ray diffraction spectra in Figure 3 show the evolution of the resulting materials depending on the pH level, i.e, on NH4OH additive. In the sample with pH level of 0.98, the XRD pattern contains
principal peak around 25.29° and the other peaks around 37.80°, 48.05°, 53.89°, 62.68° respectively asigning for the diffraction of anatase structure at (101) and (004), (200), (105), (204) planes (JCPDS no. 00-021-1272). When NH4OH is added, together with the diffraction peaks from anatase the other
sharp diffraction peaks at 22,98°, 32,69°, 40,31°, 46,88°, 52.80°, 58.29°, 68.43° standing for the diffractions at (100), (110), (111), (200), (210), (211), and (220) planes, respectively from NH4Cl crystal
[12]. The disappearance of TiO2 diffraction in XRD pattern is account for the gradual formation of
amorphous TiO2 or generally amorphous TiO2 complexes [13]. Using Scherrer equation, i.e., D =
kλ/βcosθ, where k = 0.94, λ = 0.154 nm and β is FWHM at diffraction angle θ according to (101) peak
to calculate the mean size D of anatase particles, it has found that the mean sizes of anatase particle is almost unchanged around 4.5 nm as shown in Table 1. This size is considered to be the limitation of anatase size in the conversion to amorphous TiO2 complexes.
Figure 3. XRD spectra of TiO2 resulting from pyrolysis of TiCl4 in different pH medium at 80 oC.
Table.1. The mean size of anatase particle rsulted from pyrolysis of TiCl4 in different pH medium at 80 oC.
pH (101) peak FWHM Size (nm) Agent addition
0.98 2,007 4,3 No addition
1,36 1,889 4,5 NH4OH
3,91 1,830 4,7 NH4OH
7,34 1,888 4,5 NH4OH
10.04 - - NH4OH
20 30 40 50 60 70
20 30 40 50 60 70
20 30 40 50 60 70
20 30 40 50 60 70
(2 20 )NH 4 Cl (2 11 )NH 4 Cl (2 10 )NH 4 Cl (2 00 )NH 4 Cl (1 11 )NH 4 Cl (1 00 )NH 4 Cl (2 04 )A (1 05 )A (2 00 )A (0 04 )A (1 01 )A Int ensity [ a.u] PH=0,93 PH=1,36 PH=3,91 PH=7,34 PH=10,04
2 Theta [degree]
(1 10 )NH 4 Cl b)
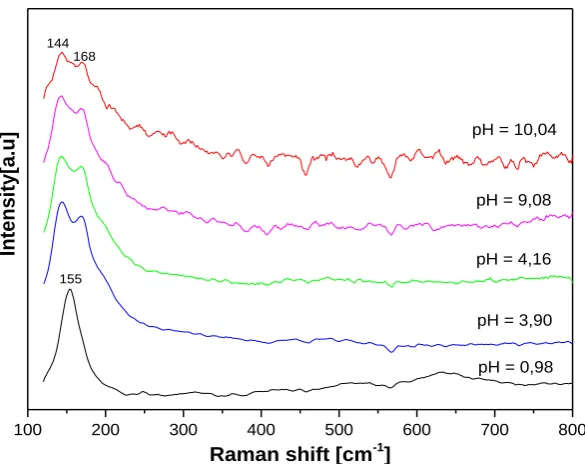
Raman spectra also confirm the present of anatase and NH4Cl in the resulting materials. As shown
in Figure 4, in the starting materials, namely, the sample with pH level of 0,98, the spectrum exhibits vibrational mode around 155 cm-1, 399 cm-1, 513 cm-1 and 634 cm-1 respectively representing the Eg,
B1g, A1g + B1g and Eg modes of anatase structure [14]. The present of NH4Cl in the gives rise to a broad
saddle spectrum of two vibration modes around 168 cm-1 and 144 cm-1 that is asumed to be the
supposition of Egvibration mode of anatase and ν2, ν3and ν4 vibration modes of NH4Cl oscilating
against Cl along [100] direction and oscilating along three orthogonal directions [15].
100 200 300 400 500 600 700 800
In
te
ns
ity
[a
.u
]
Raman shift [cm-1]
pH = 0,98 pH = 3,90 pH = 4,16 pH = 9,08 pH = 10,04
155 144
168
Figure 4. Raman spectra of TiO2 resulting from pyrolysis of TiCl4 in different pH medium at 80 oC.
Figure 5. EDS spectra of sample extracted from the milky a) and transparent b) part extracted from pyrolysis of TiCl4 in a medium with pH = 10.04.
The appearance of transparent, opalescent and separable milky part in the solution is believed to be due to the forming and increasing of amorphous TiO2 or intermediate complexes ([Ti(OH) 4-n(H2O)2+n]n+) in the pyrolysis medium. At low pH level, in the acidic aqueous medium with higher
concentration of hydrogen ions the formation of amorphous TiO2 complexes is negligible, the
resulting materials is crystallized in the form of grain structure with sharp boundary. With increasing pH level, the acidity of the pyrolysis medium decreases while its base increases. With the hydroxide ion increasing the amorphous TiO2 complexes is gradually emerged while the grain structure is
gradually disappeared. Consequently, with the increase in NH4OH additive, the separated milky
fraction in the medium is gradually increased accompanying with the gradual decrease of anatase
diffraction in the XRD spectra. When the pH level exceeding 7.34, the milky part is unchnged, in the transparent part no trace of Ti present but in the milky as shown in the EDS spectra in Figure 5. This indirectly indicates the fact that the milky trace is an indicator of amorphous TiO2 complexes and the
anatase fraction is completely converted into amorphous TiO2 complexes at the pH level of 7.34. Due
to the armophous nature, no diffraction partten of amorphous TiO2 complexes is observed in XRD
spectra.
Figure 6. The appearance of anatase nanoparticle scatteringly embedded in the amorphous TiO2 complexes.
HRTEM image taken from milky sample with pH level of 10.0 as in Figure 6 shows the appearance of tiny nanocrystallites scatteringly embedded in amorphous medium. A lattice spacing of the tiny nanocrystallite around 0.346 nm is identical as the lattice spacing of the (101) plane of TiO2 anatase.
The amorphous surrounding materials is considered to be amorphous TiO2 complexes. The estimated
sizes of TiO2 anatase particle are the same as of those calculated from XRD pattern, around 4.5 nm
that is considered to be the size limitation of anatasse in equilibrium with amorphous TiO2 complexes.
The present of anatase nanoparticles embedded in the amorphous TiO2 complexes is accounted for
the appearance of Eg vibration mode of anatase in Raman spectra in Figure 4.
20 30 40 50 60 70
100oC R
R R
In
te
ns
ity
[
a.u
]
R
A- Anatase R- Rutile
200oC
NH
4
Cl
NH
4
Cl
NH
4
Cl
NH
4
Cl
NH
4
Cl
300oC 370oC 450oC
A A
A A
A
2Theta [degree] A
NH
4
Cl
500oC 550oC 600oC
Under heat treatment at elevated temperature, the XRD and Raman spectra indicate the conversion process from amorphous TiO2 complexes to anatase and then the transition from anatase to rutile. At
heating temperature bellow 200 °C, the XRD pattern in Figure 7 shows only the trace of NH4Cl but
not amorphous TiO2 complexes nor anatase. However, when heating temperature exceeds 200 °C the
anatase diffraction is gradually emerging while NH4Cl diffraction is gradually disappearing in the
XRD patterns. At high temperature, the NH4Cl is decomposed and vaporized in the form of NH3 and
HCl gases while the amorphous TiO2 complexes is partly decomposed and recrystallized in the form
of TiO2 anatase. When the heating temperature exceeds 300 °C, the NH4Cl is completely decomposed
the materials is totally converted into TiO2 nanostructure with predominant anatase. When the
heating temperature exceeds 450 °C the appearance of rutile diffraction in the XRD patterns indicates the onset of the anatase-ruttile transition. Using the Scherer equation, we could calculate the mean size of anatase incresing from arouns 4.5 nm at heating temperature of 200 °C to 8.9 nm at heating temperature of 600 °C as shown in Table 2. For the sample with pH level of 0.98, the anatase is predominant over amorphous TiO2 complexes, the heat treatment is merely the mean to enable the
separation of the anatase nanoparticle from the cluster.
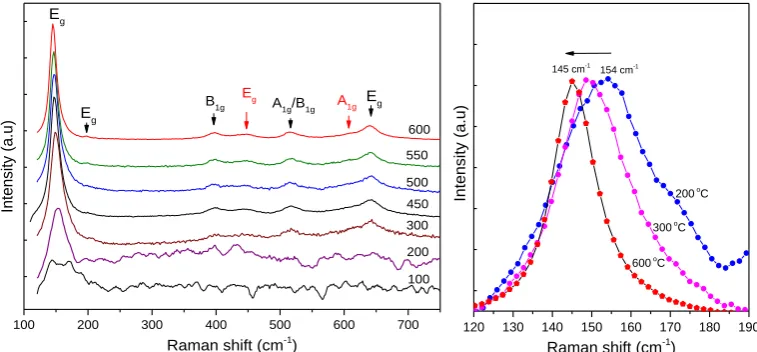
Figure 8. (a) Raman spectra of TiO2 that resulted from pyrolysis of TiCl4 in the medium with pH = 10.04 at 80 °C and then are treated in different temperature; (b) blue shift of Eg vibration mode as the heating temperature increases from 200 °C to 600 °C.
The Raman spectra also confirm the conversion of anatase from the amorphous TiO2 complexes (the
milky part) when it is heat up as can be seen in Figure 8. With baking temperature bellow 200 °C the Raman spectrum is a composition of NH4Cl vibration mode centered around 168 cm-1 and 144 cm-1
and the Eg vibration mode TiO2 anatase at 147 cm-1 [14]. As the heating temperature increases from
200 °C to 600 °C the Eg vibration mode shows a shift in frequency from 154 cm-1 to 145 cm-1 and an
increase in FWHM (see in Table 2). The feature accounts for the increase in size of the TiO2
nanocrystallites.
The formation of TiO2 nanostructures by pyrolysis of TiCl4 in elevated pH medium is explained by
the decomposition, dissolution mechanism [16]. At elevated temperature exceeding 80 °C, TiCl4 is
decomposed into Ti(OH)4 and then into amorphous TiO2 complexes, TiO2 anatase and HCl in the
pyrolysis medium. The component ratio of TiO2 anatase and amorphous TiO2 complexes then is
established by an equilibrium between H+, OH- and Cl- in the medium. In the acidic medium, TiO2
predominantly exists in the form of tiny anatase crystallites whose mean size bellow the size limitation for the anatase to rutile transition [9, 10]. On the other hand, the weaker acidic, stronger basic medium enhances the formation of Ti(OH)4 and then amorphous TiO2 complexes. By addition
of NH4OH to reduce the activity of HCl and increase of basic level in the reaction medium, the anatase
portion is decreased and the amorphous TiO2 complexes are increased in the medium. At low pH
level, anatase fraction is dominant while at high pH level the amorphous TiO2 complexes is dominant.
100 200 300 400 500 600 700
Int
en
sity (a
.u)
Raman shift (cm-1)
Eg A1g
A1g/B1g
Eg
B1g
Eg
100 200 300 450 500 550 600 Eg
120 130 140 150 160 170 180 190
145 cm-1
154 cm-1
600 o
C 300 o
C 200 o
C
Int
en
sity (a
.u)
The amorphous TiO2 complexes can be converted back to the TiO2 anatase nanoparticles by heat
treatment at temperature around 300 °C.
Table.2. The mean size and Eg vibration mode of anatase resulting from annealing amorphous TiO2 complexes.
Baking temp. Crystallite size (nm) Eg mode peak (cm-1) FWHM of Eg mode (cm-1)
200oC 4.5 154 31
300oC 6.2 150 25.8
450oC 6.8 148 18.9
500oC 6.8 148 18.1
550oC 8.3 147 15.9
600oC 8.9 145 14.5
Experiments show that amorphous TiO2 complexes and anatase nanoparticles exhibit strong
photocatalytic activity upon exposure to UV light radiation. Quatitatively, a mixture of 50 ml of 0.25
µmol methylene blue (MB) aqueous solution and 50. 0 mg of amorphous TiO2 complexes or TiO2
anatase nanoparticles is stirred magnetically under dark conditions for 30 min before exposed upon a UV mercury vapor lamp. After a fixed exposure duration, 1.0 ml of the aqueous solution is taken out for UV-Vis characterization. The percentage of MB left in the solution standing for the photocatalytic activity of amorphous TiO2 complexes or TiO2 anatase nanoparticles is calculated by
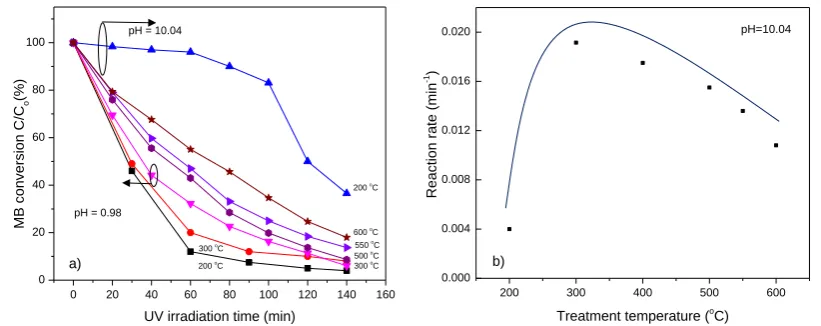
comparison of the relative intensity of MB principal adsorption peak in the UV-Vis spectrum. As shown in Figure 9, the photocatalytic activity of the materials is affected by synthesis condition, i.e, pH level of synthesized medium and the heat treatment following. The rates of photocatalytic oxidation of MB over UV illuminated TiO2 show to be well fitted to the Langmuir–Hinshelwood
(L-H) kinetics model [17] as seen in the plots.
Figure 9. a) Photocatalytic activity of TiO2 synthesized in acidic (pH = 0.98) and basic (pH =10.04) medium . b) Photocatalytic activity of amorphous TiO2 complexes depends on annealing temperature.
When MB concentration is small the L-H equation can be simplified to an apparent first-order:
ln(C0/Ct) = kt or Ct = C0exp (-kt), where C0 is the initial concentration of MB, Ct is the concentration of
the MB at illumination time t, k is a constant standing for the photoctalitic redox or reaction rate. By fitting the MB decomposition curve in Figure 9 a) to the L-H equation the dependence of the reaction rate on the treatment temperature is shown in Figure 9 b). The reason is accounted for the Ti complexes, NH4Cl, TiO2 anatase and ruttile content in the materials. With respect to the predominant
amorphous TiO2 complexes synthesized in the medium with pH = 10.04, the photocatalysis (reaction
0 20 40 60 80 100 120 140 160 0
20 40 60 80 100
a) pH = 0.98
pH = 10.04
500 oC
550 oC
300 oC
200 oC 300 oC
600 o
C 200 oC
MB con
ver
sion
C/C
o
(%)
UV irradiation time (min)
200 300 400 500 600 0.000
0.004 0.008 0.012 0.016 0.020
b)
React
ion
ra
te
(min
-1 )
Treatment temperature (o
rate) of the materials is weak as heating temperature bellow ~200 °C but rapid increases with elevated temperature beond that point. The anatase appears in the materials is accounted for the decomposion of amorphous TiO2 complexes and then recrystallization. At heating temperature around 300 °C,
NH4Cl and amorphous TiO2 complexes are totally decomposed the materials completely turn into
pure anatase as a result the photocatalytic activity of the materials is found to be maximum. Futher increasing the heat temperature, the photocatalytic is reduced due to the growth in size of anatase particle and the appearance rutile fraction from the anatase-rutile transition. As a comparison with the sample of predominant anatase that is synthesized in the medium of pH = 0.98, a lower heating
temperature of around 200 °C is adequate to completely convert the materials to totally pure anatase.
3. Materials and Methods
Titanium tetrachloride (TiCl4) of 99.9 % purity (Sigma Aldrich Chemical Co.) as Ti precursor was
used as received. Ammonium hydroxide solution (NH4OH) of 28 % NH3 (Merck Corp.,) was used as
basic agent to change the pH of pyrolysis medium. The TiO2 synthesis process was straightforward
as follows: TiCl4 was added dropwise into DI water at 5 °C to a concentration of 0.04 M, the pH level
of the solution then was dropped to around 0.98 (starting point). By adding a small amount of NH4OH into the solution the pH level was adjusted and preserved at a point in range of 0.98 to 10.04.
The solution then was poured into test tubes and placed in an oven at 80 °C, the onset point of TiCl4
decomposition. The solution was gradually changed to opalescent suspension indicating that the TiCl4 was thermally decomposed and converted into Ti complexes [Ti(OH)4-n(H2O)2+n]n+ (n is number
of protonated OH ¯ groups) and then TiO2 accompanying with the formation of HCl and NH4Cl [11].
The pyrolysis was carried on about 3.0 h and the power was shut down, the solution was slowly cooled to room temperature. Depending on pH level, the appearance of resulting solution shows either transparent, opalescent or clearly splits into transparent and milky part as seen in Figure 1. For characterization, these parts were separated and dried by vacuum evaporation then were thermally treated in an oven with baking temperature up to 600 °C.
The structure of the resulting materials was determined by D8 Advance Bruker diffractometer using CuKα radiation of 0.154 nm wavelength. The mean size, D of TiO2 crystallites was calculated using
Scherrer equation, i.e., D = kλ/βcosθ, where k = 0.94, λ = 0.154 nm and β is full width at half maximum (FWHM) according to the principal diffracted angle θ, i.e., (101) peak for anatase. Raman spectra were obtained on a LabRAM HR800 (Horiba) using a 632.8 nm excitation laser at a resolution of 1.0 cm-1. TEM images were obtained using a JEOL JEM-2100 Transmission Electron Microscope. SEM
images were conducted on a JEOL JEM-7600F Field Emission Scanning Electron Microscope. The photocatalystic activity of TiO2 nanostrutures was determined by measuring the degradation rate of
methylene blue (MB) under UV light radiation.
4. Conclusion
The pyrolysis of TiCl4 aqueous solution generally results in a mixture of TiO2 anatase nanostructure
and amorphous TiO2 complexes. The ratio of TiO2 anatase nanostructure and amorphous TiO2
complexes can be controlled by changing the pH of the pyrolysis medium. The anatase fraction is predominant at low pH level and gradually declines and completely converts to the amorphous TiO2
complexes at high pH level. By addition of NH4OH to adjust the pH, the pyrolysis of a 0.04M TiCl4
aqueous solution results in a mixture of TiO2 anatase nanostructure and amorphous TiO2 complexes
at pH bellow 7.34 and predominant amorphous TiO2 beyond that point.
The amorphous TiO2 complexes is found to be converted to TiO2 nanostructure by heat treatment.
With annealing temperature around 300 °C, the amorphous TiO2 is completely converted into anatase
nanostructure and gradually transform into rutile at high temperature. Amongst of the TiO2
nanostructure recovered from amorphous TiO2 complexes, the anatase nanostructure shows to be the
Acknowledgments: The authors gratefully acknowledge financial support received in the form of a Basic Research Project Grant in Aid (T2008-PC-123) provided by Hanoi University of Science and Technology (HUST), Vietnam.
Conflicts of Interest: The authors declare no conflict of interest.
References
1. Ulrike Diebold, The surface science of titanium dioxide, Surf. Sci. Rep. 2003, 48, pp.53-229.
2. K. Hashimoto, H. Irie, and A. Fujishima, TiO2 photocatalysis: a historical overview and future prospects, Jpn. J. Appl. Phys. 2005, vol. 44 (12), pp. 8269–8285.
3. K. Nakata and A. Fujishima, TiO2 photocatalysis: design and applications, J. Photochem. Photobiol. C
2012, vol. 13 (3), pp. 169–189.
4. M. Montazer, S. Seifollahzadeh, Enhanced self-cleaning, antibacterial and UV protection properties of nano TiO2 treated textile through enzymatic pretreatment. Photochem Photobiol. 2011, 87, pp. 877–883. 5. A. Fujishima and K. Honda, Electrochemical photolysis of water at a semiconductor electrode, Nature
1972, vol. 238 (5358), pp. 37–38.
6. L. Liu, H. Zhao, J. M. Andino & Y. Li, Photocatalytic CO2 reduction with H2O on TiO2 nanocrystals: Comparison of anatase, rutile, and brookite polymorphs and exploration of surface chemistry. ACS Catal.
2012, 2, pp. 1817–1828.
7. S. M. Gupta and M. Tripathi, A review of TiO2 nanoparticles, Chinese Sci. Bull. 2011, vol. 56 (16), pp. 1639–1657.
8. M. M. Byranvand, A. Nemati Kharat, L. Fatholahi, and Z. Malekshahi Beiranvand, A review on synthesis of nano-TiO2via different methods, J. Nanostruct., 2013, vol. 3, pp. 1–9.
9. N. T. Tung, D. Ng. Huyen, Effect of HCl on the Formation of TiO2 Nanocrystallites, J. Nanomater. 2016, vol. 2016, Article ID 6547271.
10. N. T. Tung, M. X. Dung and D. Ng. Huyen, Simultaneous Synthesis of Anatase Colloidal and Multiple-branched Rutile TiO2 Nanostructures, B. Korean Chem. Soc., 2017, 38(3); p. 401-405.
11. Q. Zhang, L. Gao, Langmuir 2003, 19, 967.; V. Jordan, U. Javornik, J. Plavec, A. Podgornik, A.Recnik, Sci. Rep. 2016, 6, 24216.
12. Downs, R. T., Bartelmehs, K. L., Gibbs, G. V., & Boisen, M. B., Interactive software for calculating and displaying X-ray or neutron powder diffractometer patterns of crystalline materials. Am. Mineral., 1993, 78(9-10), pp. 1104-1107. 13. Mónica Andrea Vargas, Jorge E. Rodríguez-Páez, Amorphous TiO2 nanoparticles: Synthesis and antibacterial capacity, J. Non-Cryst Solids 2017, 459, pp. 192–205.
14. M.N. Iliev, V.G. Hadjiev, A.P. Litvinchuk, Raman and infrared spectra of brookite (TiO2): Experiment and theory, Vib. Spectrosc., 2013, 64, pp. 148–152.
15. R. S. Krishnan, Raman spectrum of ammonium chloride and its variation with temperature, Proceedings of the Indian Academy of Sciences, Section A, 26 (6) (1947) 432-449.
16. S. Dai, Y. Wu, T. Sakai, Z. Du, H. Sakai, and M. Abe, Preparation of highly crystalline TiO2 nanostructures by acid-assisted hydrothermal treatment of hexagonal-structured nanocrystalline titania/cetyltrimethy-ammonium bromide nanoskeleton, Nanoscale Res. Lett. 2010, vol. 5(11), pp. 1829–1835,