Article
Performance Analysis of an Intermediate Temperature
SOE Test Bench Under CO
2-H
2O Feeding Stream
Petronilla Fragiacomo 1,*, Giuseppe De Lorenzo 1 and Orlando Corigliano 1
1 Department of Mechanical, Energy and Management Engineering - University of Calabria Arcavacata di Rende – 87036 Cosenza-Italy
* Correspondence: e-mail address: [email protected]; Tel.: +39 0984 494615
Abstract: Renewable sources and electric distribution network can produce or make available a surplus of electric and thermal energies. The Intermediate Temperature Solid Oxide Electrolyzer (IT-SOE) fed by CO2-steam mixtures can store these electric and thermal energies producing CO-H2
mixtures with high conversion efficiency.
Inside the IT-SOE, the CO2-steam mixtures are converted to CO-H2 mixtures and O2 through the
cathode and anode electrochemical reactions and reverse water gas shift chemical reaction. In this article an IT-SOE stack fed by different types of steam mixtures was tested at different operating temperatures and the stack polarization and electric power curves were detected experimentally. At the highest hydrogen production operating temperature of the stack fed by steam mixtures, the experimental polarization and electric power curves of the stack fed by steam and CO2-steam mixtures were compared.
A simulation model of the IT-SOE system (stack and furnace) fed by CO2-steam mixtures was
formulated ad hoc and implemented in a Matlab environment and experimentally validated. At the highest hydrogen production stack operating temperature, the IT-SOE system thermal equilibrium current was evaluated through the simulation model. Moreover, the influence of this current on the IT-SOE system efficiency and the CO-H2 mixture degree of purity was highlighted.
Keywords: CO/H2 production; intermediate temperature SOEC; SOEC modeling; performance
analysis
1. Introduction
The increase in the use of renewable sources (sun, wind, water, etc.) to replace fossil fuels (petroleum, natural gas and coal), for energy production, aims to reduce greenhouse gas emissions and mitigate climate changes. In 2014, the European Union's production from renewable energy sources has reached 14% of total energy consumption, but this production has to increase much more rapidly in the next few years, if it is expected to reach the target of 20% by 2020 [1].
The electrical power produced from renewable energy sources (RES), in particular, the sun and wind, is random and intermittent. Moreover, there is no perfect temporal and spatial correspondence between the availability of RES (the sun and wind) electric energy and fossil fuels and end-user energy demand. Owing to these problems, electrical systems may not be able to guarantee the required standard of reliability of the electrical system, which, as is well known, is very high and determined by the levels of adequacy [2], safety [3] and resilience [4] that can be achieved. Therefore, the electrical system with RES plants has to be equipped with a variety of accumulation technologies, which contribute to deliver different types of service (power and voltage regulation) and contribute to satisfying the electric needs with very different time horizons. Specifically, the time horizon varies in the range of a few milliseconds (ultra-capacitors), days and/or months (Power to Fuel technologies, P2F [5]), by hours (batteries).
One of the possible P2F technologies involves using part of the electric energy surplus within the electrical system, which integrates RES plants, to produce hydrogen through electrolysis. The
hydrogen produced can be adequately stored and converted into electric energy through fuel cells at times when the energy demand is high or can fuel "carbon free" and sustainable mobility systems [6-10].
In this context, Solid Oxide Electrolytic Cells (SOEs) are able to convert steam and/or carbon dioxide and air into gas rich in hydrogen and/or carbon monoxide and oxygen-rich air with no environmental impact and with a lower electric energy consumption produced from RES.
In the literature there are not many articles about fuel production through SOE [11-21], that represents a new, emerging and promising research field.
Mougin et al. [11] Diethelm et al. [12] Alenazey et al. [13], Kotisaari et al. [14] Chen et al. [15] carried out experimental tests for detecting the polarization curves, durability tests and thermal cycling tests on different types of SOE stacks, which operate at intermediate temperatures ranging from 600 to 850 °C and are fed by steam and hydrogen mixtures and air (steam electrolysis) and / or steam, hydrogen and carbon dioxide mixtures and air (co-electrolysis of steam and carbon dioxide).
Cinti et al. [16] conducted experimental tests on an SOE fed by steam at the cathode inlet and fuel instead of air to the anode inlet, verifying a reduction in the electrical energy required to produce a certain amount of hydrogen, until the fuel percentage utilization factor was not less than 100%. García-Camprubí et al. [17] have developed and have experimentally validated a stationary simulation model of a reversible solid oxide fuel cell fed by steam and hydrogen mixtures for the estimation of its polarization curves, when it operates both as a fuel cell and as an electrolyzer. Gomez and Hotza [18] analyzed the state of the art of SOFC/SOE and of their main components: anode, cathode and electrolyte, including an analysis of their production technologies. Milewski et al. [19] analyzed and evaluated the efficiencies of some possible configurations of an integrated SOE/SOFC system fed by water for the accumulation / delivery of electric energy, Peters et al. [20] studied different configurations and operating conditions of SOE system fed by steam mixtures in order to evaluate different efficiencies of hydrogen production, and AlZaharani and Dincer [21] have developed a simulation model of SOE system fed by steam mixtures in order to conduct an energy and exergy analyses of the same system in different operating conditions.
In this article, experimental activity on an SOE short stack (400 Wel) was carried out and this activity was completed and assisted by a numerical modeling activity of the same device.
In particular, the authors have experimentally tested the SOE stack, which operated at intermediate temperatures (IT) ranging from 650 to 750 °C and was fed by various gaseous mixtures of steam, carbon dioxide and hydrogen at the cathode inlet and by air at the anode inlet, for the detection of its polarization and electrical power curves.
With respect to the above-cited authors [11-21], who did an experimental activity or numerical modeling activity on SOE short stack, the authors of this article completed the experimental activity on SOE 6-cells short stack, operating both in electrolysis mode and co-electrolysis mode, with the numerical simulation activity through a stationary simulation model of the SOE system (stack and furnace), which was ad hoc formulated and implemented in Matlab language and validated with the experimental data which the same authors acquired at the SOE test bench.
The outputs of the SOE stack simulation model are in addition to the polarization curves, anode and cathode exhaust gases compositions at varying the supplied current also the trends of thermal power and efficiency of SOE system. The operating temperature, which guarantees the highest hydrogen production, was chosen among those experimentally investigated. In addition, the same simulation model is able to estimate the value of the stack current, for which the SOE system operates in thermal equilibrium condition, and it highlights how this current influences both the SOE system efficiency and the degree of purity of the fuel produced.
2. Numerical simulation model
cell, consisting of an anode (A), a cathode (C) and an electrolyte (E), and it is fed by a power supply. In Figure 1, the power supply is represented as a real continuous voltage generator.
Figure 1. Simplified lay-out of IT-SOEC system fed by H2 and/or CO2 rich gas and air
- Chemical reactions
At the SOE cathode, which is fed by a gaseous mixture rich in steam and/or carbon dioxide, electrochemical reactions (1.1) and (1.2) take place:
𝐻 𝑂 + 2𝑒 → 𝐻 + 𝑂 (1.1)
𝐶𝑂 + 2𝑒 → 𝐶𝑂 + 𝑂 (1.2)
and the Reverse Water Gas Shift (RWGS) chemical reaction (1.3):
𝐻 + 𝐶𝑂 ↔ 𝐶𝑂 + 𝐻 𝑂 (1.3)
At the anode the electrochemical reaction (2) takes place:
𝑂 → 𝑂 + 2𝑒 (2)
The SOE total chemical reactions producing H2, CO and O2 are (3) and (4):
𝐻 𝑂 → 𝐻 + 𝑂 (3)
𝐶𝑂 → 𝐶𝑂 + 𝑂 (4)
- Electrolyzer
𝐹 , 𝐾 − 1 𝛼 + (−𝐾 𝐹 , − 𝐾 𝐹 , + −𝐾 𝐹 , + 𝐾 𝐹 , − 𝐹 , − 𝐹 ,
+𝐹 , − 𝐹 , )𝐹 , 𝛼 + 𝐾 𝐹 , 𝐹 , +
+𝐾 𝐹 , 𝐹 , − 𝐾 𝐹 , 𝐹 , − 𝐾 𝐹 , 𝐹 , +
−𝐹 , 𝐹 , + 𝐹 , 𝐹 , − 𝐹 , 𝐹 , + 𝐹 , 𝐹 , = 0
(5.1)
𝛼 = ,
, , (5.2)
𝑞 = ,
, (5.3)
𝐹 , + 𝐹 , = (5.4)
Equation (5.1) governs the chemical equilibrium of the RWGS chemical reaction, equation (5.2) defines the conversion degree of the RWGS chemical reaction, equation (5.3) defines the parameter q, which represents the ratio between the molar flows of CO2 and H2O consumed by cathode
electrochemical reactions (1.1) and (1.2),
𝐹
, and𝐹
, , while equation (5.4) governs the totalelectrochemical consumption of CO2 and H2O.
In the equations (5.1), (5.2), (5.3) and (5.4):
𝐾 is the equilibrium constant of the RWGS chemical reaction (1.3), calculated at the SOE average operating temperature, 𝑇;
𝐹 , is the molar flow of CO2 converted to CO at the cathode through the RWGS chemical reaction (1.3) expressed in mol s-1;
𝐹 , and 𝐹 , are the molar flows of CO2 and H2O consumed by cathode electrochemical reactions (1.1) and (1.2) expressed in mol s-1.
𝐹 , , 𝐹 , , 𝐹 , , 𝐹 , are the molar flows of CO2, CO, H2, H2O at the cathode inlet expressed in mol s-1;
𝛼 is the RWGS chemical reaction degree.
𝑞 is the ratio between the CO and H2 molar flows electrochemically consumed at the cathode;
𝑗, 𝐴 and 𝐹𝑎 are respectively the current density and the active area of the electrolytic cell and the Faraday constant expressed in A cm-2, cm2 and C mol-1.
In this article the authors set the value of q on the basis of their experimental data acquired at the SOE test bench and on the basis of Diethelm et al. experimental observation [12] that: “the steam splitting is the predominant electrochemical reaction, whereas CO2 dissociation occurs principally through the
reverse water-gas-shift reaction”.
The molar flows of the chemical species in the cathode exhaust gas (H2O, CO, CO2, H2, N2) are
calculated using equations (5.5):
𝐹, , − 𝐹, , = ∑ ( . ),( . ),( . ) 𝜈, ∙ 𝐹
𝑤𝑖𝑡ℎ 𝑖 = 𝐻 𝑂, 𝐶𝑂, 𝐶𝑂 , 𝐻 , 𝑁 𝑎𝑛𝑑 𝐹( . )= 𝐹 , , 𝐹( . )= 𝐹 , , 𝐹( . )= 𝐹 ,
where
𝜈
, is the stoichiometric coefficient of the ith chemical species in the jth chemical reaction,which is positive or negative in cases where the same chemical species is respectively a product or reagent in the jth chemical reaction.
At the anode, the main equation is (6.1):
𝐹 , = 0.5 ∙ (6.1)
Where 𝐹 , is the molar flow of oxygen produced at the anode expressed in mol sec-1.
If technical air consisting of O2 and N2 is considered as the anode feeding gas (to simplify), the O2 and
N2 molar flows at the anode outlet,
𝐹
, , and𝐹
, , , are calculated by equations (6.2):𝐹, , − 𝐹, , = 𝜈,( )∙ 𝐹( )
𝑤𝑖𝑡ℎ 𝐹( )= 𝐹 , 𝑎𝑛𝑑 𝑖 = 𝑂 , 𝑁
(6.2)
2.1. Energy analisys of the system
Considering at the cathode inlet a gaseous mixture consisting mainly of steam and carbon dioxide, the real voltage to be applied to the same electrolytic cell,
𝑉
, is calculated by equation (7):𝑉 = 𝑉 + (𝑅 + 𝑅 ) ∙ 𝑗 (7)
where:
𝑉 is the Nernst voltage of the electrolytic cell expressed in V;
𝑅 is the ohmic and contact resistance of the electrolytic cell expressed in cm2;
𝑅 is the polarization resistance of the electrolytic cell expressed in cm2;
𝑅 and 𝑅 were calculated considering the experimental data acquired by the authors.
The electrical power required by the SOE stack, consisting of a number, 𝑛 , of electrolytic cells, 𝑃 , , is calculated by the equation (8):
𝑃 , = 𝑉 ∙ 𝐼 = 𝑛 ∙ 𝑉 ∙ 𝑗 ∙ 𝐴 (8)
The electric power required by the power supply,
𝑃
, , expressed in W is calculated by equation(9):
𝑃 , = ,
, (9) where
𝜂
, is the electrical efficiency of the power supply.𝑃 , = 𝑃 , , − 𝑃 , , =
= −𝐹 , , ∙ 𝑇 ∙ ∆𝑆 → − 𝐹 , , ∙ 𝑇 ∙ ∆𝑆 → + +𝑛 ∙ 𝑅 + 𝑅 ∙ 𝑗 ∙ 𝐴 +
−𝐹 , , ∙ ∆𝐻
(10)
where:
𝑃
, , is the thermal power generated by irreversibility, Ohm and contact overvoltage andpolarization phenomena in the stack expressed in W;
𝑃
, , is the thermal power absorbed by the RWGS chemical reaction in the stack expressed inW;
𝐹 , , , 𝐹 , , are the molar flows of steam and carbon dioxide electrochemically consumed in the stack expressed in mol s-1;
𝑇 and 𝑛 are the electrolytic cell operating temperature expressed in K and the number of electrolytic cells in the stack;
∆𝑆 → and ∆𝑆 → are the molar entropy variations referred to chemical reactions (3) and (4) expressed in J mol-1 K-1 ;
𝐹 , , is the molar flow of carbon dioxide consumed by RWGS chemical reaction in the stack expressed in mol s-1;
∆𝐻 is the molar enthalpy variation referred to RWGS chemical reaction expressed in J mol-1.
The thermal power required to heat the feeding gases at the stack inlet,
𝑃
, , , , expressed in W, is calculated by equation (11):𝑃 , , , = 𝑛 ∙
𝑚̇ , , ∙ ∫ 𝑐 , , , (𝑇)𝑑𝑇 +
, ,
+𝑚̇ , , ∙ ∫ , , 𝑐 , , , (𝑇)𝑑𝑇
(11)
where:
𝑚̇ , , and 𝑚̇ , , are the mass flows of the gas mixtures and of the air at the cathode and anode inlets expressed in kg s-1;
𝑇 , , and 𝑇 , , are the temperatures at the cathode and anode inlets expressed in K;
𝑐 , , , (𝑇) and 𝑐 , , , (𝑇) are the constant pressure specific heats of the gas mixtures and of the air at the cathode and anode inlets expressed in J kg-1 K-1
If the SOE system is in thermal equilibrium, the operating condition (12) must be verified:
𝑃 , , = 𝑃 , , , − 𝑃 , − 𝑃 = 0 (12)
where 𝑃 is the thermal power produced by furnace expressed in W.
This condition expresses the equality of the thermal powers (𝑃 , + 𝑃 ) and 𝑃 , , ,. The net production efficiency of the SOE system is calculated through equation (13):
𝜂 , =
̇ ∙ ̇ ∙
, , , , , ∙ ,
,
(13)
𝑚̇ and 𝑚̇ are the mass flows of hydrogen and carbon monoxide produced expresses in kg s-1;
𝐿𝐻𝑉 and 𝐿𝐻𝑉 are the lower heating values of hydrogen and carbon monoxide expressed in J kg -1;
𝑃 , , is the total additional thermal power (> 0) required by the SOE system (SOE stack and furnace) expressed in W;
𝑃 , , is the thermal power required to produce the steam at the stack inlet starting from water at a temperature equal to 25 °C at the SOE system inlet expressed in W;
𝜂 , ⁄𝜂 , is the ratio between the electrical and thermal reference efficiencies, which is used to convert the thermal power 𝑃 , , > 0 + 𝑃 , , in equivalent electrical power.
The values of
𝜂
, and𝜂
, are set equal to two reference values, 0.38 (electrical efficiency ofa thermoelectric plant) and 0.9 (thermal efficiency of a steam generator)
Since the SOE stack operates at atmospheric pressure the electric power required to compress the feeding gases is neglected.
3. Experimental activity
The experimental activity on Solid Electrolytic Cells was carried out on an experimental station installed at the Department of Mechanical, Energy and Management Engineering in the University of Calabria.
3.1. Experimental Station
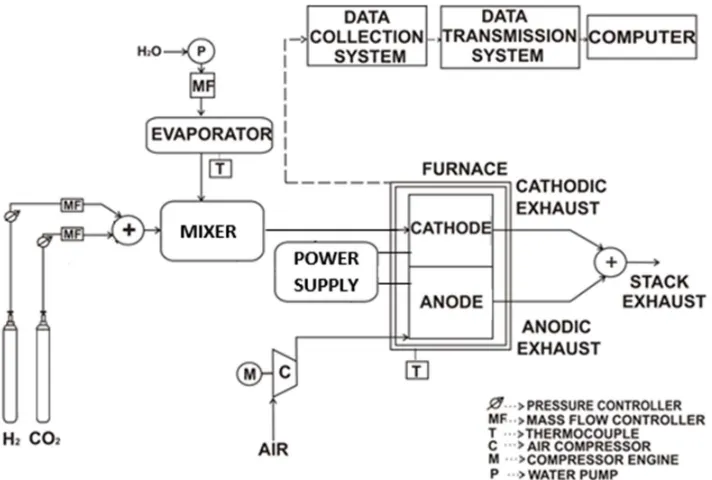
The experimental station consists of a storage in gas cylinders, of a gas distribution and supply system, of a network of sensors for detecting gas leaks in the working environment, a distribution and dispensing system of demineralized water, of the SOE stack test bench equipped with an electric furnace to control the stack operating temperature and with a power supply and of a data collection, transmission and processing system (Figure 2).
The test bench is able to test the short stack, which can be fed by gas mixtures containing H2, steam,
CO2 and air. The gas flows and the water flow are regulated by specific mass flow controllers in the
system. In addition, the test bench is equipped with a data logger to record the time trend of the main operating parameters.
The short stack consists of six cells. Each cell is cathode supported and is designed to work at intermediate temperature. The stack operating temperature can be varied by setting the electric furnace temperature. Air and fuel pressures at the stack inlet are equal to atmospheric pressure. The main characteristics of the single electrolytic cell are shown in Table 1.
Gas storage and the gas distribution and supply system are part of the fuel cells testing laboratory, which have already been described in more detail in [22].
Table 1. Electrolytic cell components features
Layer Composition Thickness / µm
Cathode Ni/8YSZ 240 ± 20
Electrolyte 8YSZ 8 ± 2
Bilayer anode GDC/LSCF 50 ± 10
Cell active area / cm2 80
3.2. Experimental Tests
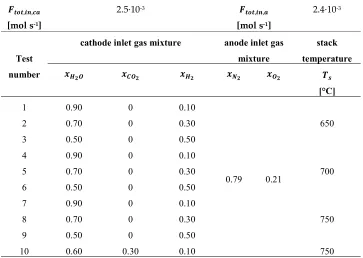
During the experimental test campaign, the total molar flows, the compositions of the gas mixtures at the SOE stack cathodes and anodes inlets and the operating temperatures of the same stack are shown in Table 2. The total molar flows, 𝐹 , , and 𝐹 , , are respectively 2.5-10-3 mol s-1 and 2.4 10-3 mol s-1 for all ten tests conducted.
Table 2. Main parameters of experimental tests on SOE stack fed by steam, H2 and/or CO2 gas mixtures
𝑭𝒕𝒐𝒕,𝒊𝒏,𝒄𝒂 [mol s-1]
2.5·10-3 𝑭
𝒕𝒐𝒕,𝒊𝒏,𝒂 [mol s-1]
2.4·10-3
Test number
cathode inlet gas mixture anode inlet gas
mixture
stack temperature
𝒙𝑯𝟐𝑶 𝒙𝑪𝑶𝟐 𝒙𝑯𝟐 𝒙𝑵𝟐 𝒙𝑶𝟐 𝑻𝒔 [°C]
1 0.90 0 0.10
0.79 0.21
650
2 0.70 0 0.30
3 0.50 0 0.50
4 0.90 0 0.10
700
5 0.70 0 0.30
6 0.50 0 0.50
7 0.90 0 0.10
750
8 0.70 0 0.30
9 0.50 0 0.50
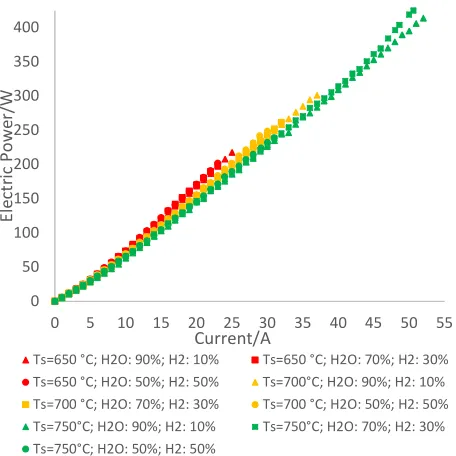
In the first nine tests, the stack was fed by three different binary gas mixtures of H2 and steam,
hereinafter referred to as "steam mixtures", and air and it operated at three different temperatures. Figures 3 and 4 show the experimental data of voltage-current and power-current power applied to the stack in the first nine tests.
The current absorbed by the stack is proportional to the H2 molar flow produced by the stack. At a
temperature of 750 °C, the stack produces higher H2 molar flows and therefore it is the operating
temperature with greater application interest.
Figure 1. Experimental stack polarization curves in tests from 1 to 9 4.5
5 5.5 6 6.5 7 7.5 8 8.5 9
0 5 10 15 20 25 30 35 40 45 50 55
Vo
lta
ge
/V
Current/A
Ts=650 °C; H2O: 90%; H2: 10% Ts=650 °C; H2O: 70%; H2: 30%
Ts=650 °C; H2O: 50%; H2: 50% Ts=700°C; H2O: 90%; H2: 10%
Ts=700 °C; H2O: 70%; H2: 30% Ts=700 °C; H2O: 50%; H2: 50%
Ts=750°C; H2O: 90%; H2: 10% Ts=750°C; H2O: 70%; H2: 30%
Figure 2. Experimental stack electric power curves in tests from 1 to 9
At this operating temperature, higher stack H2 molar production is obtained, when the same stack is
fed by the gas mixture with 90% in steam and 10% in H2, and it is 1.62 10-3 mol s-1.
In the test no. 10 the stack is fed by a ternary gas mixture of H2, steam and CO2, hereinafter referred
to as "steam-CO2 mixture" and air and it operated at a temperature of 750 °C. Figure 5 shows the
comparison of the voltage-current and power-current data of the stack respectively fed by the steam mixtures with the highest steam content and air and with the steam-CO2 mixture and air.
The test shows that the conversion of steam into H2 requires less electrical power than the conversion
of steam and CO2 into H2 and CO since the CO production electrochemical reaction (1.2) is less
favored than the H2 production electrochemical reaction (1.1), as remarked also by other authors [13].
0 50 100 150 200 250 300 350 400
0 5 10 15 20 25 30 35 40 45 50 55
El
ec
tr
ic
P
ow
er
/W
Current/A
Ts=650 °C; H2O: 90%; H2: 10% Ts=650 °C; H2O: 70%; H2: 30%
Ts=650 °C; H2O: 50%; H2: 50% Ts=700°C; H2O: 90%; H2: 10%
Ts=700 °C; H2O: 70%; H2: 30% Ts=700 °C; H2O: 50%; H2: 50%
Ts=750°C; H2O: 90%; H2: 10% Ts=750°C; H2O: 70%; H2: 30%
Figure 5. Comparison between the experimental voltage-current data and electric power-current data of the SOE stack fed by the gas mixture of steam and H2 and air and by the gas mixture of steam, CO2
and H2 and air
4. Validation of numerical simulation model
The stack simulation model was formulated and implemented in Matlab language and a calculation code named 'SOE' was produced.
The calculation code was used to carry out the electrical characterization of the stack fed by steam mixtures (gaseous mixtures ‘a’, ‘b’ and ‘c’) and air and by the steam-CO2 mixture (gas mixture ‘d’)
and air. The compositions of gas mixtures ‘a’, ‘b’, ‘c’ and ‘d’ are shown in Table 3. The operating temperature was considered to be at 750 °C, because at this temperature, as stated above, the stack experimentally obtained the highest H2 production.
The main input data of the calculation code are shown in Table 4.
Table 3. Volume percentage composition of cathode inlet gases
Cathode inlet gas mixture
H2O H2 CO2
a 90 10 0
b 70 30 0
c 50 50 0
d 60 10 30
Table 4. Main input data of the calculation code
Parameter Units Value
𝑛 - 6
𝐴 cm2 80
0 50 100 150 200 250 300 350 400 450 5 5.5 6 6.5 7 7.5 8 8.5 9
0 5 10 15 20 25 30 35 40 45 50 55
𝑝 , Pa 101325
𝑇 , , °C 270
𝑇 , , °C 25
𝑇 , , °C 25
𝑇 °C 25
The voltage absolute percentage error,
|𝑒𝑟𝑟| (%), was defined by the equation (14):
|𝑒𝑟𝑟|(%) =
∑ , ,
,
∙ 100 (14)
Where 𝑉 , and 𝑉 , are the experimental and theoretical voltages for the 𝑁 data number expressed in V.
Figures 6 and 7 show the comparisons of the theoretical polarization curves and the voltage and current experimental data (Vs-Is) of the stack fed respectively by the steam mixtures and air, and by
the steam-CO2 mixture and air.
The absolute percentage errors were found to be respectively 0.99, 0.93, 0.48 and 0.65 for the three steam mixtures and for the steam-CO2 mixture. Therefore, for the gas mixtures considered there was
a good agreement between the theoretical polarization curves obtained by SOE calculation code and the experimental (Vs-Is) data.
5. Numerical simulations and Results analysis
The first SOE stack campaign was carried out through the SOE calculation code.
In this test campaign, the trends of the total thermal power, 𝑃 , , , of the net production efficiency,
Figure 6. Comparison of the theoretical polarization curves and the experimental Vs-Is data of the
SOE stack fed by the three different steam mixtures and air
Figure 7. Comparison of the experimental and theoretical polarization curves of the SOE stack fed by the steam, CO2 and H2 gas mixture and air
Figure 8 shows the trends of 𝑃 , , and 𝜂 , for the stack fed by the three steam mixtures and air at varying 𝐼.
5 5.5 6 6.5 7 7.5 8 8.5 9
0 5 10 15 20 25 30 35 40 45 50 55
Vo
lta
ge
\V
Current\A
H2O:90%;H2:10%;Experimental Voltage H2O:70%;H2:30%;Experimental Voltage H2O:50%;H2:50%;Experimental Voltage H2O:90%;H2:10%;Theoretical Voltage H2O:70%;H2:30%;Theoretical Voltage H2O:50%;H2:50%;Theoretical Voltage
5 5.5 6 6.5 7 7.5 8 8.5 9
0 5 10 15 20 25 30 35 40 45 50
Vo
lta
ge
\V
Current\A
Figure 8. Trends of total thermal power and net production efficiency for the SOE stack fed by three steam mixtures and by air at varying the stack current
(a)
0 0.1 0.2 0.3 0.4 0.5 0.6 0.7 0.8 0.9
0 0.1 0.2 0.3 0.4 0.5 0.6 0.7 0.8 0.9 1
0 5 10 15 20 25 30 35 40 45 50 55 xi,out
,a
n
xi,out
,c
a
Current\A
cathode outlet-H2O cathode outlet-H2
anode outlet-O2 anode outlet-N2
(b)
(c)
Figure 9. Trends of anode and cathode exhaust gas composition for the SOE stack fed by the steam mixtures ‘a’ (a), ‘b’ (b) and ‘c’ (c) and by air at varying the stack current
For the three steam mixtures the thermal powers produced by the furnace, 𝑃 , are set, so that the SOE system (stack and furnace) operates at the maximum production efficiency in the thermal equilibrium condition.
Figure 8 shows that the SOE system reaches the thermal equilibrium condition at three different operating currents, Ith,eq, of about 37 A, 31 A and 27 A for the three steam mixtures.
0 0.1 0.2 0.3 0.4 0.5 0.6 0.7 0.8 0.9 0 0.1 0.2 0.3 0.4 0.5 0.6 0.7 0.8 0.9 1
0 5 10 15 20 25 30 35 40 45 50 55 xi,out
,a
n
xi,out
,c
a
Current\A
cathode outlet-H2O cathode outlet-H2
anode outlet-O2 anode outlet-N2
Ith,eq=31A
0 0.1 0.2 0.3 0.4 0.5 0.6 0.7 0.8 0.9 0 0.1 0.2 0.3 0.4 0.5 0.6 0.7 0.8 0.9 1
0 5 10 15 20 25 30 35
xi,out
,a
n
xi,out
,c
a
Current\A
cathode outlet-H2O cathode outlet-H2
anode outlet-O2 anode outlet-N2
When the stack current increases, the additional thermal power required by the SOE system (SOE stack and furnace), 𝑃 , , , first is positive and increases then is positive and decreases until it is zero at the SOE system (stack and furnace) thermal equilibrium current. When stack current is greater than the SOE system thermal equilibrium current, 𝑃 , , is negative and continue to decrease. Figure 8 shows that the stack reaches the maximum production efficiency in the SOE system (stack and furnace) thermal equilibrium condition when it is fed by steam mixtures.
The SOE system reaches the maximum value of the net maximum H2 production efficiency equal to
about 0.60, when it is fed by the H2 and steam equimolar mixture in (steam mixture ‘c’). When the
steam content in the gas mixture at the stack inlet decreases, the thermal power required for the steam pre-heating decreases much more than the electric power absorbed by the stack increases. This increment is due to the increment of polarization overvoltage.
Figure 9 shows the trends of xi,out,a, and xi,out,ca for the stack fed by the three different steam mixtures
and air at varying 𝐼with the three respective SOE system thermal equilibrium currents evaluated. The Figure shows that, coherently with the theoretical study of this discipline, in the stack cathode and anode exhaust gas mixtures the H2 and O2 contents increase, when the stack current increases,
since the quantities of H2 and O2 produced by the stack increase. In addition, as was expected, it
should be noted that at the SOE system (stack and furnace) thermal equilibrium current, the cathode gas mixture leaving the stack with the highest hydrogen content, of about 80%, is obtained when the stack is fed by the H2 and steam equimolar mixture (steam mixture ‘c’), since this stack inlet mixture
has the highest H2 amount. Therefore, the value of Ith,eq (SOE system thermal equilibrium current)
influences the purity degree of H2 and O2 rich gas mixtures at the stack outlet.
Subsequently, a further test was carried out. In this test, the trends of 𝑃 , ,, 𝜂 ,, xi,out,a, and xi,out,ca
for stack fed by the steam-CO2 mixture and air at varying 𝐼.
Figure 10 shows the trends of 𝑃 , , and 𝜂 , for the stack fed by the steam-CO2 mixture and
air at varying 𝐼. The Figure shows that the stack fed by the steam-CO2 mixture reaches the thermal
equilibrium at an operating current, Ith,eq, equal to about 32 A. In this case the thermal power absorbed
Figure 10. Trends of total thermal power and net production efficiency for the SOE stack fed by the steam-CO2 mixture and by air at varying the stack current
Also in this case the thermal power produced by the furnace, 𝑃 , is set, so that the SOE system (stack and furnace) operates at the maximum production efficiency in the thermal equilibrium condition. In addition, the SOE system fed by the steam-CO2 mixture achieves a maximum H2 net
production efficiency of about 0.60.
Figure 11 shows the trends of the anode and cathode exhaust gases compositions xi,out,a and xi,out,ca, for
the stack fed by the steam-CO2 mixture and air at varying 𝐼 with the SOE system thermal equilibrium current evaluated. Even in this case Figure 11 shows that the H2 and CO contents in the
cathode exhaust gases and the O2 content in the anode exhaust gases at the stack outlet increase, when
the operating SOE system current increases since the H2, CO and O2 amounts produced by the stack
increase. Therefore, even in this case, the value of Ith,eq influences the purity degree of the gas mixtures
rich in H2 and CO and of the gas mixtures rich in O2 at the stack outlet. At the SOE system thermal
equilibrium current, the cathode gas mixture at the stack outlet has H2 and CO content equal to 36%
Figure 11. Trends of anode and cathode exhaust gas composition for the SOE stack fed the steam-CO2 mixture and by air at varying the stack current
6. Conclusions
An SOE (400 Wel) stack fed by three steam mixtures and air was experimentally tested at three
different temperatures (650 °C, 700 °C and 750 °C).
At temperature of 750 °C, the stack produced higher H2 molar flows, resulting the operating
temperature with the highest applicative interest. The highest H2 stack production, of 1.62 10-3 mol s -1, is obtained when the stack is fed by the highest steam content (90%) mixture. In addition, the same
stack fed by a steam-CO2 mixture and air (co-electrolysis) was experimentally tested at temperature
of 750 ° C. This test showed that the conversion of steam and CO2 into H2 and CO requires more
electrical power than the conversion of steam to hydrogen, since the CO production electrochemical reaction is less favored by the H2 production electrochemical reaction.
Simultaneously, a numerical simulation model of the stack in electrolysis and co-electrolysis modalities was formulated and implemented in Matlab language and the calculation code was validated with the data acquired in the experimental tests conducted.
The trends of the additional thermal power, net production efficiency and anode and cathode exhaust gas compositions of the SOE system (SOE stack and furnace) at varying the stack current were plotted. The calculation code also allowed the thermal equilibrium currents of the SOE system in the two operating modalities to be evaluated, which were 37 A, 31 A and 27 A (electrolysis mode for three steam mixtures) and 32A (co-electrolysis mode for a steam-CO2 mixture) respectively.
Both the maximum values of net production efficiencies and the volume percentages of H2 and H2
-CO in cathode gases at the stack outlet were evaluated at the SOE system thermal equilibrium currents and they are respectively both about 0.60 for the efficiencies and about 80% and about 36% -12% for the volume percentages.
It can be seen how the results obtained through the calculation code have highlighted the influence of the SOE system thermal equilibrium current on the net H2 and CO production efficiency of the
0 0.1 0.2 0.3 0.4 0.5 0.6 0.7 0.8 0.9 0 0.1 0.2 0.3 0.4 0.5 0.6 0.7 0.8 0.9 1
0 5 10 15 20 25 30 35 40 45 50
x
i,out,a
n
x
i,out,c
a
Current\A
cathode outlet-H2O cathode outlet-H2 cathode outlet-CO cathode outlet-CO2 anode outlet-O2 anode outlet-N2
same SOE system and on the purity degree of the gases rich in H2 and CO and of the gases rich in O2
at the stack outlet.
Surely the authors intend to produce future developments in both the experimental and numerical modeling activities, conducting further wider ranging investigation on the topic dealt with in this article.
Acknowledgments: The authors would like to thank the Drs. M. Bertoldi, F. Ghigliazza and S. Modena of the Italian Company Solid Power for their technical supporting.
References
1. European Commission, «Second Report on the State of the Energy Union» EUR-Lex, Brussels, 2017. 2. European Commission, «Accelerating Clean Energy Innovation» EUR-Lex, Brussels, 2016. 3. European Commission, «Delivering a New Deal for Energy Consumers» EUR-Lex, Brussels, 2015. 4. Directorate-General for Energy (European Commission), Joint Research Centre (European Commission), «Transforming the European energy system through innovation - Integrated strategic energy technology (SET) plan: progress in 2016» Luxembourg: Publications Office of the European Union, Brussels, 2016.
5. Di Giorgio, P.; Desideri, U. Potential of Reversible Solid Oxide Cells as Electricity Storage System. Energies2016, 9, 662, DOI: 10.3390/en9080662.
6. Mumtaz, S.; Ali, S.; Ahmad, S.; Khan, L.; Hassan, S.Z.; Kamal, T. Energy Management and Control of Plug-In Hybrid Electric Vehicle Charging Stations in a Grid-Connected Hybrid Power System. Energies2017, 10, 1923, DOI:10.3390/en10111923.
7. Aschilean, I.; Varlam, M.; Culcer, M.; Iliescu, M.; Raceanu, M.; Enache, A.; Raboaca, M.S.; Rasoi, G.; Filote, C. Hybrid Electric Powertrain with Fuel Cells for a Series Vehicle. Energies2018, 11, 1294, DOI: 10.3390/en11051294
8. De Lorenzo, G.; Andaloro, L.; Sergi, F.; Napoli, G.; Ferraro, M.; Antonucci, V. Numerical simulation model for the preliminary design of hybrid electric city bus propulsion system with polymer electrolyte fuel cell. Int. J. Hydrogen Energy 2014, 39(24),12934-12947, DOI: 10.1016/j.ijhydene.2014.05.135.
9. Fragiacomo, P.; Astorino, E.; Chippari, G.; De Lorenzo, G.; Czarnetzki, W.T.; Schneider, W. Anion Exchange Membrane Fuel Cell modeling. Int. J. Sustainable Energy 2016, 1-14, DOI: 10.1080/14786451.2016.1256887, DOI: 10.1080/14786451.2016.1256887.
10. Fragiacomo, P.; Astorino, E.; Chippari, G.; De Lorenzo, G.; Czarnetzki, W.T.; Schneider, W. Dynamic Modeling of a Hybrid Electric System based on an Anion Exchange Membrane Fuel Cell. Cogent Engineering2017, 4, 1357891 DOI: 10.1080/23311916.2017.1357891.
11. Mougin, J.; Mansuy, A.; Chatroux, A.; Gousseau, G.; Petitjean, M.; Reytier, M.; Mauvy, F. Enhanced Performance and Durability of a High Temperature Steam Electrolysis Stack. Fuel Cells 2013, 13(4),623-630. DOI: 10.1002/fuce.201200199.
14. Kotisaari, M.; Thomann, O.; Montinaro, D.; Kiviaho, J. Evaluation of a SOE Stack for Hydrogen and Syngas Production: A Performance and Durability Analysis. Fuel Cells2017, 17(4), 571-580, DOI: 10.1002/fuce.201600166.
15. Chen, M.; Høgh, J.V.T.; Nielsen, J.U.; Bentzen, J.J.; Ebbesen, S.D.; Hendriksen, P.V. High Temperature Co-Electrolysis of Steam and CO2 in an SOC Stack: Performance and Durability. Fuel Cells2013, 13(4), 638-645, DOI: 10.1002/fuce.201200169.
16. Cinti, G.; Bidini, G.; Hemmes, K. An experimental investigation of fuel assisted electrolysis as a function of fuel and reactant utilization. Int. J. Hydrogen Energy 2016, 41, 11857-11867, DOI: 10.1016/j.ijhydene.2016.05.205.
17. García-Camprubí M.; Izquierdo, S.; Fueyo N. Challenges in the electrochemical modelling of solid oxide fuel and electrolyser cells. Renew. Sustainable Energy Rev. 2014, 33,701–718, DOI: 10.1016/j.rser.2014.02.034.
18. Gómez, S.Y.; Hotza D. Current developments in reversible solid oxide fuel cells. Renew. Sustainable Energy Rev.2016, 61,155-174, DOI: 10.1016/j.rser.2016.03.005.
19. Milewski, J.; Wołowicz, M.; Lewandowski, J. Comparison of SOE/SOFC system configurations for a peak hydrogen power plant. Int. J. Hydrogen Energy 2017, 42, 3498-3509, DOI: 10.1016/j.ijhydene.2016.08.067.
20. Peters, R.; Deja, R.; Blum, L.; Nguyen, V.N.; Fang, Q.; Stolten, D. Influence of operating parameters on overall system efficiencies using solid oxide electrolysis technology. Int. J. Hydrogen Energy2015, 40, 7103-7113, DOI: 10.1016/j.ijhydene.2015.04.011.
21. AlZahrani, A.A.; Dincer, I. Thermodynamic and electrochemical analyses of a solid oxide electrolyzer for hydrogen production. Int. J. Hydrogen Energy 2017, 42, 21404-21413, DOI: 10.1016/j.ijhydene.2017.03.186.