Jour
nal
Name
A Mathematical Model of Microbial Folate
Biosyn-thesis and Utilisation:
Implications for Antifolate
Development
†
J.Enrique Salcedo-Sora,‡aand Mark T. Mc Auleyb
The metabolic biochemistry of folate biosynthesis and utilisation has evolved into a complex net-work of reactions. Although this complexity represents challenges to the field of folate research it has also provided a renewed source for antimetabolite targets. A range of improved folate chemotherapy continues to be developed and applied particularly to cancer and chronic inflam-matory diseases. However, new or better antifolates against infectious diseases remain much more elusive. In this paper we describe the assembly of a generic deterministic mathematical model of microbial folate metabolism. Our aim is to explore how a mathematical model could be used to explore the dynamics of this inherently complex set of biochemical reactions. Using the model it was found that: 1) a particular small set of folate intermediates are overrepresented, 2) in-hibitory profiles can be quantified by the level of key folate products, 3) using the model to scan for the most effective combinatorial inhibitions of folate enzymes we identified specific targets which could complement current antifolates, and 4) the model substantiates the case for a substrate cycle in the folinic acid biosynthesis reaction. Our model is coded in the systems biology markup language and has been deposited in the BioModels Database (MODEL1511020000), this makes it accessible to the community as a whole.
1
Introduction
Infectious diseases are still a major burden to human health and economic development. For example, in 2013 mortality due to tuberculosis 2013 was estimated at 1.4 million people1. More-over, Malaria causes an astonishing 200 to 500 million of clinical episodes a year2–4 with nearly 600 thousand deaths in 20134.
Folate metabolism is a proven drug target with significant clinical efficacy and antifolates have been deployed for the treatment of a wide range of infectious diseases5. However, due to increasing drug resistance their efficacy has been compromised forcing in some cases the withdrawal of formulations of antifolates unless they are combined with a further antimicrobial that works through a different mechanism of action6. Furthermore, the
available antibiotics are not extensive nor comprehensive. For instance, antimicrobials against Gram-negative bacteria are
lim-a
School of Health Science, Liverpool Hope University, Hope Park, Liverpool, L16 9JD, United Kingdom. Fax: 44 0151 291 3441; Tel: 44 0151 291 2184; E-mail: [email protected]
b
Department of Chemical Engineering, Thornton Science Park, University of Chester, Chester, CH2 4NU, United Kingdom.
† Electronic Supplementary Information (ESI) available: [Figures S1- S5, Ta-bles S1 - S5, and List of ODEs (Ordinary Differential Equations)]. See DOI: 10.1039/b000000x/
‡Corresponding author.
ited and the drugs to treat morbid parasitic infections are scarce and their treatment is clinically unsafe7. Since the production of new antibiotics is lengthy and costly, it is imperative that there is a continued effort to identify pharmacological approaches to extend the life of this well known source of antimicrobial targets and counteract the detrimental consequences of anti-folate drug resistance.
Due to the knowledge accumulated over eight decades on folate metabolism and the evidence on the efficacy of antifolates at killing sensitive cells, the folate biosynthesis and usage pathways continue to be a worthwhile avenue for antimicrobial
developmental and repurposing8. Nonetheless, in order to
environment and diet do not offer this essential vitamin the biosynthetic pathway of folate becomes key for the viability of active proliferating microorganisms11. Crucially, this biochemical switch characterises the behaviour of most microbial pathogens including bacteria12and parasitic single-cell eukaryotes such as the malaria parasites8. To combat these pathogens antifolates of
clinical use in medical and veterinary practice target primarily the following three enzymes: dihydropteroate synthase (DHPS), dihydrofolate reductase (DHFR) or thymidylate synthase (TS), while an enzyme of the Shikimate pathway is the target of the herbicidal glyphosate. Thus, the pharmacological utility of the extensive range of other enzymes involved in the folate biosynthesis and utilisation network are still to be fully exploited.
Mainly due to the association its dysregulation has with cancer folate metabolism has been more intensively studied in
mammals. This experimental work has been used to inform
the assembly of a number of mathematical models of folate metabolism13–19. In silicomammalian models have been used
to represent in vivo purine biosynthesis20, the kinetics of the folate cycle in human breast carcinoma cells21, the impact of vitamin B12 deficiency on the folate cycle13, the influence of
genetic polymorphisms in methylene tetrahydrofolate reductase and thymidylate synthesis22, the effect of epithelial folate
con-centrations on DNA methylation rate and purine and thymidylate synthesis23, the high correlation between tissue and plasma folate and the low correlation between liver and plasma folate16, and how vitamin B-6 restriction alters one-carbon metabolism in cultured HepG2 cells19. These mathematical models have all
worthwhile features and have deepened our understanding of the complex dynamics which underpins the folate cycle in mammals. However, to our knowledge at present, there is no mathematical model which has represented microbialde novo biosynthesis as well as the usage of folate (the folate cycle). Thus, it could be argued that the microbial biochemical folate system remains less well understood than its mammalian counterpart.
In this paper we describe the assembly of a mathematical model of the microbial biosynthetic and usage pathways. This model is based on the biochemical architecture of a single celled microorganism, and is underpinned by known enzyme kinetics. The robustness of our model is based on its capacity to represent known folate inhibitory profiles as well as its capacity to predict effective new drug combinatorial profiles. Furthermore, this model includes folate metabolites recently identified as being involved in dormancy related persister bac-teria and illustrates the likely metabolic folate profile of such a phenotype. Together these features of the model suggest that our model is a suitable template which could help to exploit novel aspects of this complex network for new antifolate chemotherapy.
2
Methods
The model proposed here comprises 31 reactions and 51 metabolites. The different reactions are in Table 1 with extended annotation in Table S1 with the metabolites abbreviated as in
Table S2. The components of our model are informed by the existing kinetic models briefly described above, and by the most recent reviews of microbial folate metabolism8,24. Moreover, a number of microbial metabolic representations that describe
folate related reactions were explored. These pathways are
archived within the KEGG database (Kyoto encyclopedia of genes and genomes http://www.genome.jp/kegg/) (accessed July 2015)25which is based on the comparative genomics from the hundreds of microbial genomes sequenced to date26.
Kinetic parameters were compiled from the enzyme database
BRENDA (accessed July 2015)27 (Tables S3 and S4). Kinetic
parameters for ADCS (reaction 8), forE. coli, were extrapolated from28. Kinetic parameters for ADCL (reaction 9), for P. fal-ciparum, were extrapolated from29. The final curated model
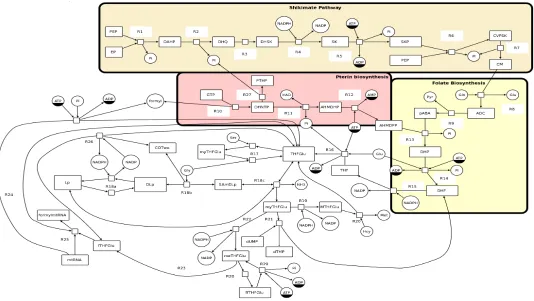
consists of reactions reported from all three microbial modelsE. coli,S. cerevisiae, andP. falciparumand encompasses a biosynthe-sis component (the Shikimate pathway leading to the synthebiosynthe-sis of pABA from glycolytic intermediates, the pteridin biosynthesis pathway from GTP, and the reactions leading to the production of fully reduced and polyglutamated folate), and an interconversion cycle of reduced and polyglutamated folate products (Figure 1). All reactions are listed in Table S1 and all metabolites and their abbreviations are listed in Table S2. The vectorial assembly of this model was created with systems biology graphical notation
(SBGN) (http://www.sbgn.org/Main_Page)30 and implemented
in VANTED (Version 2.2.1, http://vanted.ipk-gatersleben.de/)31. We then converted this biochemical network into a series of reactions (Tables 1 and S1) and assembled them in Version 4.14.89 of the modelling and simulation software tool Copasi32.
The initial velocity of each reaction is underpinned by a rate law that depends on the concentrations of the reaction substrates, products, and co-factors. These rate laws are nonlinear and in general are described by Michaelis-Menten kinetics (List of ODEs in electronic supplementary information) for either one, two, or
three substrates assuming a random-order mechanism33. The
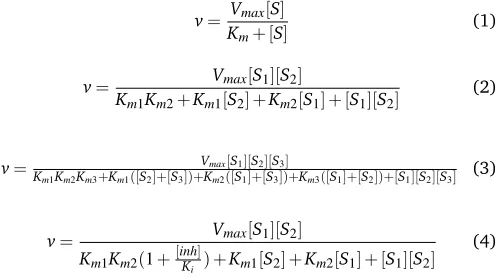
following mathematical expressions exemplified the different Michaelis-Menten equations as used for this model for one substrate, two substrates, and three substrates33:
v= Vmax[S] Km+ [S]
(1)
v= Vmax[S1][S2]
Km1Km2+Km1[S2] +Km2[S1] + [S1][S2]
(2)
v= Vmax[S1][S2][S3]
Km1Km2Km3+Km1([S2]+[S3])+Km2([S1]+[S3])+Km3([S1]+[S2])+[S1][S2][S3] (3)
v= Vmax[S1][S2]
Km1Km2(1+ [inh]
Ki ) +Km1[S2] +Km2[S1] + [S1][S2] (4)
Fig. 1SBGN Network diagram of Folate biosynthesis and usage pathways.The model is laid out as four connected branches, 1) the shikimate pathway, 2) the pterin pathway,3) folate biosynthesis, 4) folate biosynthesis. The arrows represent the flow of folate and its forms around the system. R1-Rx represent each reaction e.g. R1= reaction 1.
(4) where the concentration of the inhibitory metabolite is taken into account, together with its affinity constant (Ki), by its effect on theKmvalues in the denominator.
Dihydrofolate (DHF) has been shown to act as inhibitor of a number of reactions in the folate cycle. Chiefly among them is folylpolyglutamate synthase (reaction 16) which DHF inhibits with a constant of 3.1 µM34. The model built here includes
DHF as a modifier (inhibitor) of reactions 16, 19, 21, and 22. THF has also been involved in regulatory feedback by inhibiting reactions 10 and 178. This is reflected here by including THF
as a modifier in such reactions (List of ODEs in electronic
supplementary information). The model does not include
membrane transport of folates. Folate membrane transporters have been found in folate heterotrophs24 and organisms with dual de novo folate biosynthesis and salvage capabilities35–37.
The former are obviously not covered by the model assembled here. Some single-celled eukaryotes (i.e.Apicomplexan such as malaria and toxoplasmosis parasites)37and plants can perform
both biosynthesis as well as salvage of folate from environment mainly via the FBT family of transporters38. This extra layer of
complexity is not included in our model.
Substrate steady state concentrations available mainly from39 were included as initial concentrations. The initial concentration
of boundary metabolites was fixed. These included PEP, EP,
and GTP. These are the substrates for the initial reactions of
the Shikimate pathway and the pterin biosynthesis, respectively. Also fixed were the initial concentrations of cofactors for which recycling reactions are not part of the system: ATP, NADH, NADPH, Gln, Gly, Ser and Lp. The reactions that generate the products using folates as cofactors in anabolic reactions (i.e. Met, dTMP and formyl-mtRNA) needed to have their substrates (Hcy, dUMP, and mtRNA) also fixed (Table S5). Additionally, it was also considered that the average microorganism would have its folate pool most polyglutamated. For example, E. coli has approximately 50% of folates polyglutamated and S. cerevisiae nearly fully polyglutamated12,40. To reflect this, all folate intermediates containing fully reduced tetrahydrofolate (THF) in this model are denoted as polyglutamated by using the suffix Glu in their abbreviations. The maximal rates (Vmax in micromoles (Litre)−1(min)−1) of enzymatic reactions were calculated from
the specific activities41 of purified protein extracts as reported in BRENDA (micromoles (mg of protein)−1(min)−1)27. In a
bacterial cell such asE. coliproteins constitute about 55% of the dry cell weight and the cytoplasm has a density of 1.1 with 70% water41. With these parameters theV
max values were calculated by converting the mass (mg of protein) of the specific activity of a given enzyme to volume in litres to representVmax values41 as explained in Table S4. The model is encoded in the systems
biology markup language (SBML)42 and was submitted to the
Table 1Enzyme reactions as entered in the model. Metabolite abbreviations are detailed in Table S2. The extended reactions as catalogued in KEGG are listed in Table S1
Reaction Number Reaction description Kinetic descriptor (a)
1 PEP + EP -> DAHP + Pi Rate Law for R1
2 DAHP -> DHQ + Pi Henri-Michaelis-Menten (irreversible)
3 DHQ -> DHSK Henri-Michaelis-Menten (irreversible)
4 DHSK + NADPH -> SK + NADP Mass action (irreversible) 5 SK + ATP -> SKP + ADP + Pi Mass action (irreversible)
6 SKP + PEP -> CVPSK + Pi Rate Law for R6
7 CVPSK -> CM + Pi Henri-Michaelis-Menten (irreversible)
8 CM + Gln -> ADC + Glu Rate Law for R8
9 ADC -> pABA + Pyr Henri-Michaelis-Menten (irreversible) 10 GTP -> DHNTP + formyl; THF (b) Henri-Michaelis-Menten (irreversible) 11 DHNTP -> AHMDHP + HAD + 3Pi Henri-Michaelis-Menten (irreversible) 12 AHMDHP + ATP -> AHMDPP + AMP Mass action (irreversible)
13 AHMDPP + pABA -> DHP + 2Pi Rate Law for R13
14 DHP + Glu + ATP -> DHF + ADP + Pi Rate Law for R14 15 DHF + NADPH -> THF + NADP Mass action (irreversible) 16 THF + Glu + ATP -> THFGlu + ADP + Pi; DHF (b) Rate Law for R16 17 THFGlu + Ser = myTHFGlu + Gly; THF (b) Rate Law for R17
18a Lp + NADH = DLp + NAD+ Rate Law for R18a
18b Gly + DLp = SAmDLp + COTwo Rate Law for R18b
18c SAmDLp + THFGlu = Lp + myTHFGlu + NH3 Rate Law for R18c 19 myTHFGlu + NADPH -> MTHFGlu + NADP; DHF (b) Mass action (irreversible) 20 MTHFGlu + Hcy -> THFGlu + Met Rate Law for R20 21 myTHFGlu + dUMP -> dTMP + DHF; DHF (b) Rate Law for R21 22 myTHFGlu + NADP = meTHFGlu + NADPH; DHF (b) Mass action (reversible)
23 meTHFGlu = fTHFGlu Mass action (reversible)
24 fTHFGlu + ADP + Pi = THFGlu + formyl + ATP Mass action (reversible) 25 fTHFGlu + mtRNA = formylmtRNA + THFGlu Mass action (reversible) 26 fTHFGlu + NADP = THFGlu + COTwo + NADPH Mass action (reversible)
27 DHNTP -> PTHP + Pi Henri-Michaelis-Menten (irreversible) 28 meTHFGlu -> ffTHFGlu Henri-Michaelis-Menten (irreversible) 29 ATP + ffTHFGlu -> ADP + Pi + meTHFGlu Rate Law for R29
(a) See ordinary differential equations in electronic supplementary information. (b) DHF or THF included as modifiers (i.e. inhibitors) as explained in main text.
advances.
3
Results
3.1 Initial examination of the model
Once the initial set of parameters were added to the model we ran a number of simulations. It was found that the system reached steady state at approximately 300 minutes (Figures 2 and S1, and Table S5). Figure 2 captures the steady state values for the folate cycle. Figure 2A represents the intermediates of the cy-cle, while Figure 2B represents the products of the cycy-cle, namely methionine, dTMP and formyl-met-tRNA (fmtRNA). The concen-trations of the metabolites and the fluxes related to the biosynthe-sis of folates range over several orders of magnitude as summa-rized in Table S5. Importantly, the folate pool seems to be stored mainly as two intermediates: the polyglutamated and fully re-duced form THFGlu and its intermediate carrying the one-carbon unit as methenyl (meTHFGlu) (Figure 2A and Table 2). This is an important finding of the model since neither THFGlu nor meTH-FGlu are direct cofactors for the anabolic reactions where folates are involved. On the other hand, the products derived directly from the folate cycle reactions are represented by methionine at a concentration of 172µM and dTMP at a concentration of 45.7
µM. The modified methionyl-transfer RNA (fmtRNA) reaches a
steady state at a much lower level (2.15µM) than the other
prod-ucts (Figure 2B). From these the only metabolite with a reported steady state concentration in microorganisms is methionine at a
mean value of 142µM39which is close to the value derived from
the simulation of this model (172µM).
3.2 Modelling the effect of known antifolates
We modelled the effect of inhibiting enzymes by running parame-ter scans of theVmaxof a given enzyme from the initialVmaxvalue entered for that enzyme down to decimal minimal values ap-proaching zero (0.01 micromoles (Litre)−1(min)−1) to simulate
5-O-A
0 50 100 150 200 250 300
1e−05
1e−01
1e+03
Time (min)
Concentr
ation (micromolar)
THF THFGlu myTHFGlu meTHFGlu
fTHFGlu ffTHFGlu MTHFGlu
B
0 50 100 150 200 250 300
1
2
5
20
100
Time (min)
Concentr
ation (micromolar)
Met dTMP
fmtRNA
Fig. 2Steady-state levels of folate cycle metabolites and products. (A) Describes the behaviour of seven folate cycle intermediates up to 300 minutes. (B) Describes the behaviour of three folate cycle products in the same period. Abbreviations as in Table S2. Theyaxis is logarithmic.
(1-carboxyvinyl)-transferase), target of glyphosate, presented a similar inhibition profile to that observed for DHPS. The inhibi-tion of TS on the other hand, was limited to the decline of dTMP to negligible levels (Figure S2).
3.3 Modelling the effect of known antifolate combination
therapies
Antifolate chemotherapy has been deployed using inhibitors that target at least two enzymes of folate biosynthesis and usage pathways and usually work due to a synergistic effect44. The most common of such combinations is a DHFR inhibitor and a DHPS inhibitor for the treatment of infectious diseases. Targeting DHFR and TS has also been used to kill cancerous cells45. The
effects of the combined reduction of the Vmax for DHFR and
DHPS (Figure 4), and DHFR and TS (Figure S3) were simulated. The response of the two folate products (Met and dTMP) and the two metabolic intermediates (THFGlu and meTHFGlu) were used to illustrate the effects of these combined inhibitions. The inhibition of DHFR and DHPS has an overall effect on all of these metabolites while the inhibition of DHFR and TS has its main effect on dTMP, which was significantly reduced (Figure S3).
A
0 500 1500 2500
1e−05
1e−01
1e+03
Vmax
Concentr
ation (micromolar)
THF THFGlu myTHFGlu meTHFGlu
fTHFGlu ffTHFGlu MTHFGlu
B
0 500 1500 2500
1
2
5
20
100
Vmax
Concentr
ation (micromolar)
Met dTMP
fmtRNA
Fig. 3Effect of decreasing theVmaxof DHFR (a primer target for current antifolates) on the steady-state levels of (A) folate metabolites and (B) products. Abbreviations as in Table S1 for enzymes and Table S2 for metabolites.Vmaxvalues in micromoles per litre per time unit in minutes (micromoles (Litre)−1(min)−1). TheV
maxvalues for each enzyme corresponds to the values entered for the corresponding reaction (Table S4). Theyaxis is logarithmic.
An important aim of this model was to find new potential inhibitory combinations that could reduce the levels of folate metabolites and products which could work more effectively than the current antifolates. As the model successfully simulated the known effects of inhibiting DHFR46(Figure 3), we therefore decided that it would be logical to investigate the effects of inhibiting DHFR and a second target. Using the levels of dTMP as an indicator of cell survival, a scan of the Vmax of DHFR
was performed while theVmax of a second enzyme was set to
negligible levels (0.01 micromoles (Litre)−1(min)−1). Firstly,
we simulated the known synergism of inhibiting both DHFR and DHPS, which is the most common antifolate combinatorial chemotherapy against infectious microorganisms. The levels of dTMP when DHFR was inhibited alone reached the lowest point (5µM) when theVmaxfor DHFR was just below 1000 micromoles (Litre)−1(min)−1. When DHPS was also inhibited (V
max =
0.01 micromoles (Litre)−1(min)−1) the levels of dTMP were
minimal even at high values of DHFRVmax (2500 micromoles
(Litre)−1(min)−1) (Figure 5A). Therefore, based on this output
A
B
C
D
Fig. 4Modelling current antifolate combination therapies: inhibiting DHFR and DHPS. The differentVmaxvalues span from 0.1 up to the values entered for each reaction in this model (Table S4). The levels of four metabolites ((A) Met, (B) dTMP, (C) meTHFGLu, and (D) THFGlu) plotted to illustrate the effects of this dual inhibition on the folate intermediates and products considered more important in the model. Abbreviations as in Table S2.
A
3000 2000 1000 0
1
2
5
10
20
50
VmaxDHFR
dTMP (micromolar)
Anti−DHFR &anti−DHPS &anti−PSCVT &anti−FPGS
B
● ●
● ●●
●● ●●
● ●●
●●● ●●
●● ●●
●●●●●●●●●●●●●●●●●●●●●●●●●●●●●●●●●●●●●●●●●●●●●●●●●●●●●●●●●●●●●●●●●●●●●●●●●●●●●●●
0.02 0.10 0.50 2.00
0.5
1.0
1.5
2.0
Anti−DHFR IC90
∆
A
n
ti
−
D
H
F
R DHPS
FPGS
SHMT PSCVT
Fig. 5Predicting synergistic combinations of antifolates. (A) The values for theVmaxof DHFR were scanned against negligibleVmaxvalues (0.01) of other enzymes included in the model. The trends observed here are DHFR against itself, DHPS, PSCVT, and FPGS. Theyaxis is
logarithmic. (B) Describing the effect of inhibiting other enzymes on the ICs for anti-DHFR inhibitors. The X-axis is logarithmic and represents an hypothetical scale of the IC90values for an inhibitor of DHFR on its own (unity) or in the presence of another compound (values below, equal or above 1.0). Y-axis represents the difference between of the IC90for an anti-DHFR alone minus the IC90of the same anti-DHFR when in the presence of another compound. This difference is used as exponential of 2 as numeric base (see main text).
new potential combinations.
3.4 Predicting additive inhibitory effects of new combina-tions of antifolates
The above results prompted us to formulate a method that could facilitate a clear visualisation of additivity on cell toxicity by new combinations of a given candidate inhibitor and an anti-DHFR
compound. In experimental pharmacology cellular toxicity is
measured as the concentrations of a molecule that affect cell sur-vival: inhibitory concentrations IC50or IC90. The type of
screen-ing we believe is worthwhile formulatscreen-ing is that which detects drugs or compounds that reduce the ICs of an anti-DHFR inhibitor at the same or lower levels than the known synergistic combina-tions with anti-DHPS drugs (Figure 5). The difference between for instance, the IC90of an anti-DHFR alone and in the presence
of another molecule would be a coefficient. Such a coefficient can then be used as the exponential of a natural numeric base to render a positive scale where the point of no effect is one (anti-DHFR IC90 minus itself produces an exponential zero). Using 2
as the base this scale will show maximum possible effects (strong additivity or synergy) as an asymptote that approaches two, and minimal effects (antagonistic) as an asymptote that approaches zero (Figure 5B). Simply stated the formula is: ∆Anti-DHFR =
2(A−B). Where A is the IC
90of an anti-DFHR acting alone and B
the IC90 of such anti-DHFR in the presence of another inhibitor
at a set concentration. In thisin silicomodel we simulated this type of assays by runningVmaxscans for DHFR while reducing the
Vmaxof another of the enzymes of the model to negligible levels (i.e. 0.01 micromoles (Litre)−1(min)−1). The representation of
the known synergistic effect of an anti-DHFR and an anti-DHPS is observed under this method as a change of 1.5 in the inhibitory concentrations of an anti-DHFR (a reduction in its ICs (IC90 or
IC50) of 50%) (Figure 5B). When the same simulation was run
with all other possible targets, significantly, inhibiting enzymes of the Shikimate pathway (e.g. PSCVT) did not seem to enhance the effect of inhibiting DHFR alone (observed as a change in the levels of dTMP). A similar trend was observed when lowering theVmax values for SHMT, an enzyme directly involved in the one-carbon transfer to folates. On the other hand, an effect well above the reference (set by inhibiting DHPS) was observed when reducing the levels of theVmaxfor FPGS. Inhibiting DHFR was significantly improved in the latter case with a score approaching 2. An in-creased efficacy of 100% for an anti-DHFR inhibitor when in the presence of an anti-FPGS compound (Figure 5B).
3.5 Sensitivity of the system to cell energy and redox status
A question to address in folate metabolism relates to the effect that the energy status of a cell will have on the biosynthesis and usage of folate. As it takes four molecules of ATP to produce a new fully reduced monoglutamated folate (every additional condensation of a glutamate will cost an extra ATP), the full biosynthesis of folate ought to be sensitive to the energy status of the cell. Folate biosynthesis also requires reductive equivalents in the form of both NADH and NADPH. Recent findings from experimental work have confirmed that the folate metabolic net-work has a crucial role to play in maintaining the homoeostasis of cell biomass47. Depending on the direction of the reactions
A
0 500 1000 1500 2000
1e−03
1e+01
ATP
Concentr
ation (micromolar)
THF THFGlu
meTHFGlu ffTHFGlu
B
0 500 1000 1500 2000
1
5
20
100
ATP
Concentr
ation (micromolar)
Met dTMP
fmtRNA
Fig. 6Modelling the effect of ATP levels on folate cycle metabolites and products. Levels of ATP in micromolar. Initial concentration of ATP used for the model was 963µM.
of the folate cycle, the folate one-carbon reactions can equally generate net energy and reductive equivalents (i.e. ATP and NADPH)48,49. Consequently, there is a need for a framework
that integrates folate metabolism with cell growth and energy homoeostasis. In the model presented here reducing the levels of ATP to 1% reduced the concentration of most folate metabolites (Table 2 and Figure 6). The reduction of other substrates such as glutamine, and NADPH had a similar effect on the folate pool (Table2). However, changes to ATP and NADPH were most significant (Figure S5).
We were interested in metabolites whose concentration in-creased under restrictive energy conditions, as these could be feedback molecules for the folate biosynthesis and utilisation pathways. For instance under low ATP the monoglutamated THF accumulates (Table 2 and Figure 6). Importantly, a similar trend is followed by 5-formyl-THFGlu (ffTHFGlu: folinic acid). Both molecules are known to be negative regulators of folate
biosyn-thesis enzymes SHTM and GTPCH-I (8,50). Two other
metabo-lites, SK and SAmDLp, increase to very higher levels (Figure S5). A synergistic effect by SK with other carbon sources in the pro-motion of cell growth has been observed in bacteria51. However,
and low ATP are unknown. Similarly, when the levels of NADPH decreased among the expected metabolites to become abundant, THF and DHF are again known regulators of the folate biosyn-thesis. However, the functions of DHSK, myTHFGlu, and again SAmDLp, whose concentrations are significantly higher in low NADPH (Figure S5), are unknown.
Table 2Effect of low substrate input in the model. Concentrations (micromolar) for seven different metabolite intermediates of the folate cycle and three of the main products of the anabolic reactions were folates are cofactors (in italics). Column noted as Standard contains the metabolite concentration values in micromolar at 300 minutes (Figure 2). The other columns denote these values when the concentration of precursors in the headings drop to 1% of their initial values. Bold fonts denote incremental changes
Metabolite Standard ATP Glutamine NADPH NADH THF 7.00E-002 21.67 7.14E-3 7.34E-2 7E-2
THFGlu 592 151 16.46 585 600
myTHFGlu 7.8E-2 1E-2 2.98E-2 8.7E-2 7E-2 meTHFGlu 72.44 3.37 27.38 80.48 65 MTHFGlu 0.99 1.25E-1 3.75E-1 1.36E-2 8.9E-1 fTHFGlu 4.5E-5 1.2E-5 3.16E-5 4.8E-5 4.3E-5 ffTHFGlu 1.4 121.68 6.9E-1 1.49 1.31 dTMP 45.7 7.03 17.27 48.55 40.68
Met 172 25.1 64.23 4.45 153
fmtRNA 2.15 1.93 2.08 2.21 2.12
4
Discussion
Folate metabolism in microbes currently suffers from a paradox. Although, there is an abundance of experimental information derived mainly from microbial models such asE. coliandS. cere-visiae, on closer inspection there is still a lack of understanding of the regulatory mechanisms which underpin the dynamics of folate biosynthesis and utilisation. In mammals specific concen-trations of intracellular and circulating folates are known to have predictable implications52. In contrast, we lack a quantitative
framework for understanding the relationship between intrinsic folate levels and microbial cell growth and multiplication53. A basic initial challenge is to know the intracellular concentration of intracellular metabolites. Although, there have been efforts to quantify steady state metabolite content in microbes (e.g. E. coli)39,54, cofactors such as folates pose inherent difficulty for detection because they are in sub-micromolar concentrations and mostly protein-bound. Further complications arise from genomic driven automatic annotation of the myriad of microbial genomes. The genotypes of folate biosynthesis enzymes appear to have local gene variability that have compounding effects on gene annotation. Nonetheless the architecture of folate biosynthesis pathways seems evolutionary constrained24,55. Consequently, the model presented here centres on the metabolic reactions that are widely regarded as fundamental to a fully biosynthetic microorganism and attempt to capture a broad set of parameters that allows us to integrate a systems level overview of microbial folate metabolism.
The concentration of all folate metabolites and products represented here reach a steady state. THFGlu and meTHFGlu represent the main forms of folate in this model under
steady-state conditions. This is a meaningful feature of the model since THFGlu is the product of thede novobiosynthesis of folate and meTHFGlu is the product of the condensation of the one-carbon unit (from serine or glycine) on to THFGlu. Crucially, meTHFGlu is the substrate for the futile cycle with folinic acid (Figure 1)56. Furthermore, THFGlu is a known regulatory (inhibitor)
metabolite of folate biosynthesis enzymes such as GTPCHI which catalyses the first reaction of the pteridin biosynthesis pathway8. It is therefore noteworthy that the model assembled here demonstrates that these two folate intermediates, with such essential roles in the known biochemistry of folate utilisation are the main reservoir of the folate pool.
The combined inhibition of DHFR and DHPS affects the levels of both of the main folate intermediates THFGlu and meTHFGlu while the levels of methionine and dTMP do not differ signif-icantly from the levels observed when inhibiting DHFR alone (Figures 3 to 5). The combinatorial inhibition of DHFR and TS on the other hand, has drastic effects on the levels of dTMP mainly (Figure S3). Importantly, the thymineless death is known as the mechanism mediating cell toxicity of antifolates57. The profiles of these inhibitory trends of folate metabolites and products fit with the fact that anti-DHFR inhibitors are the most effective antifolate mono-therapy followed only by anti-TS compounds5. However, it is clear that combinatorial approaches with an anti-DHFR and a second antifolate further improve the efficacy of anti-DHFR inhibitors to shut down folate usage reactions58,59.
Accordingly, it was decided to explore combinations of DHFR inhibitors and a second target. Particularly, targeting enzymes that are current candidates for antifolate chemotherapy such as SHMT and FPGS (Figure S4). The best known methods for eval-uating drug-drug interactions are based on the Loewe additivity model, visualised by isobolograms and measured by the com-bination index analysis60. These empirical implementations of representing drug-drug interactions serve the need for methods to study cell toxicity. Particularly given that usually, evidence on the mechanisms of action and interactions of drug-drug and drugs-targets is lacking. None of these methods however, have found applicability in high-throughput (HTP) drug screening. The need to use a range of concentrations for each of the drugs increases the work load exponentially to levels that defeat the purpose of screening large chemical libraries. Therefore, drug additivity is not routinely an aim in HTP drug screening.
not enhanced (Figure 5). Nonetheless, screening large chemical libraries is arguably a worthwhile strategy to look for drug additivity, and simple methods such as the one presented here to measure potential synergistic interactions in HTP projects are a necessity.
The finding that folinic acid increases when the level of ATP is reduced has important implications when considered within the context of the regulation of the metabolism of microbial cell growth. Folinic acid is the most chemically stable form of reduced folates that seems to function as a metabolic sink for the folate cycle56. Folinic acid itself is not a substrate for folate
utilising enzymes, it has to be transformed back into meTHFGlu by the ATP-driven enzyme 5-formyl THF cyclo-ligase(5-FCL: reaction 29) before re-entering the folate cycle. Folinic acid has been given potential roles as a reservoir of cellular folate and as a regulatory metabolite through the inhibition of a number of folate biosynthesis enzymes50,56,62. As a potential folate reservoir folinic acid is present in high levels (over 70% of the folate pool) in dormant cellular forms such as plant seeds and fungi spores56,63, and the overexpression of 5-FCL has been associated with bacterial dormant phenotypes in liquid culture64
as well as in biofilms65. Also, inhibiting 5-FCL has been shown to affect cell growth56,66. Related to the latter, 5-FCL has been
described as a pathogenic factor necessary for antifolate drug resistance in Mycobacterium67. Thus, folinic acid seems to be part of a substrate cycle with invested value since it is seemingly used for both cell dormancy as well as actively cell growth. It is possible that this ATP-driven reaction is used by the folate cycle as an energy sensor whereby cellular stress and low ATP is sensed by the folinic acid substrate loop. When conditions are more favourable, activation of folinic acid restores the flux downstream this futile cycle. Sensitivity in metabolic regulation is the relationship between the relative change in enzyme activity and the relative change in concentration of a regulator68. As an outlining feature this model of the folate biosynthesis pathway and the folate cycle substantiates the cited works that propose the 5-FCL reaction as a potential substrate cycle as part of the regulatory signals of the folate metabolism.
A kinetic model to detect parameter dependencies can have limitations. The model outputs are influenced by the accuracy of the enzymatic kinetic parameters. However, these parameters have inherent variability due to differences in the experimental conditions in which they were quantified. Particularly, when as in this model, the objective was to build a generic construction of the relevant microbial pathways. We have mitigated against this limitation by compiling a metabolic network of consensus reac-tions for folate biosynthesis across species, and the distribureac-tions for a large number of values for the relevant kinetic parameters from generic databases as well as the literature. Additionally, the model is well informed by the inclusion of the initial steady state concentrations for the majority of metabolites from studies on microbial model organisms which report absolute values using modern metabolomics techniques. The robustness and accuracy of this type of model then becomes apparent, as is the case in
this work, by the steady-state values of metabolic products that agree with the literature data and the predictability of the effects of local parameter variations. The latter includes the agreement of the model with the known effects of existing inhibitors.
5
Conclusions
We have assembled a generic mathematical model of microbial folate biosynthesis and usage. This model is able to reproduce many of the key biochemical dynamics which underpin folate metabolism in microorganisms. We acknowledge that the model has limitations. For instance, model outputs are inexorably dic-tated by enzymatic kinetic parameters. These parameters have inherent variability due to differences in the experimental condi-tions in which they were quantified. Equally relevant to the valid-ity of the model is that its foundations are based on the general consensus within the field that these are the accepted reactions of folate biosynthesis and utilisation. For example, for some reac-tions such as the initial steps of the pterin biosynthesis pathway alternative catalytic steps have been proposed69. Nonetheless,
the model is consistent with the biology of folate metabolism and provides a number of useful biochemical insights as well as re-sults which have meaningful implications. These include the pre-sentation of two folate intermediates of the folate cycle, THFGlu and meTHFGlu, as the main components of the network of late substrates. The simulation of the inhibition of certain fo-late enzymes seems to us particularly useful. DHFR stands out as the most efficacious target to inhibit and any combinatorial ap-proach should consider including an anti-DHFR. A combination that results with effects stronger than the benchmark of inhibit-ing DHPS and DHFR seems to be the inhibition of the polygluta-mation (FPGS) of folates together with inhibiting DHFR. These findings could be pertinent for the future development of an-tifolates. Lastly, and of significant interest this model supports that the folinic acid biosynthesis loop appears to act as a folate-mediated regulatory circuit in cell growth. In the future we hope to use this model to explore this finding in greater depth.
6
Acknowledgements
The authors would like to acknowledge the support by the School of Health Science (Liverpool Hope University, UK) and the De-partment of Chemical Engineering (University of Chester, UK) in the research work that led to this paper.
References
E. Alvarez, N. Alvis-Guzman, A. A. Amankwaa, A. T. Amare, H. Amini, W. Ammar, B. O. Anderson, C. A. T. Antonio, P. An-wari, J. Ärnlöv, V. S. A. Arsenijevic, A. Artaman, R. J. Asghar, R. Assadi, L. S. Atkins, A. Badawi, K. Balakrishnan, A. Baner-jee, S. Basu, J. Beardsley, T. Bekele, M. L. Bell, E. Bernabe, T. J. Beyene, N. Bhala, A. Bhalla, Z. A. Bhutta, A. B. Abdulhak, A. Binagwaho, J. D. Blore, D. Bose, M. Brainin, N. Breitborde, C. A. Castañeda-Orjuela, F. Catalá-López, V. K. Chadha, J.-C. Chang, P. P.-J.-C. Chiang, T.-W. Chuang, M. Colomar, L. T. Cooper, C. Cooper, K. J. Courville, B. C. Cowie, M. H. Criqui, R. Dandona, A. Dayama, D. De Leo, L. Degenhardt, B. Del Pozo-Cruz, K. Deribe, D. C. Des Jarlais, M. Dessalegn, S. D. Dharmaratne, U. Dilmen, E. L. Ding, T. R. Driscoll, A. M. Dur-rani, R. G. Ellenbogen, S. P. Ermakov, A. Esteghamati, E. J. A. Faraon, F. Farzadfar, S.-M. Fereshtehnejad, D. O. Fijabi, M. H. Forouzanfar, U. Fra.Paleo, L. Gaffikin, A. Gamkrelidze, F. G. Gankpé, J. M. Geleijnse, B. D. Gessner, K. B. Gibney, I. A. M. Ginawi, E. L. Glaser, P. Gona, A. Goto, H. N. Gouda, H. C. Gug-nani, R. Gupta, R. Gupta, N. Hafezi-Nejad, R. R. Hamadeh, M. Hammami, G. J. Hankey, H. L. Harb, J. M. Haro, R. Hav-moeller, S. I. Hay, M. T. Hedayati, I. B. H. Pi, H. W. Hoek, J. C. Hornberger, H. D. Hosgood, P. J. Hotez, D. G. Hoy, J. J. Huang, K. M. Iburg, B. T. Idrisov, K. Innos, K. H. Jacobsen, P. Jeemon, P. N. Jensen, V. Jha, G. Jiang, J. B. Jonas, K. Juel, H. Kan, I. Kankindi, N. E. Karam, A. Karch, C. K. Karema, A. Kaul, N. Kawakami, D. S. Kazi, A. H. Kemp, A. P. Kengne, A. Keren, M. Kereselidze, Y. S. Khader, S. E. A. H. Khalifa, E. A. Khan, Y.-H. Khang, I. Khonelidze, Y. Kinfu, J. M. Kinge, L. Knibbs, Y. Kokubo, S. Kosen, B. K. Defo, V. S. Kulkarni, C. Kulkarni, K. Kumar, R. B. Kumar, G. A. Kumar, G. F. Kwan, T. Lai, A. L. Balaji, H. Lam, Q. Lan, V. C. Lansingh, H. J. Larson, A. Lars-son, J.-T. Lee, J. Leigh, M. Leinsalu, R. Leung, Y. Li, Y. Li, G. M. F. De Lima, H.-H. Lin, S. E. Lipshultz, S. Liu, Y. Liu, B. K. Lloyd, P. A. Lotufo, V. M. P. Machado, J. H. Maclachlan, C. Magis-Rodriguez, M. Majdan, C. C. Mapoma, W. Marcenes, M. B. Marzan, J. R. Masci, M. T. Mashal, A. J. Mason-Jones, B. M. Mayosi, T. T. Mazorodze, A. C. Mckay, P. A. Meaney, M. M. Mehndiratta, F. Mejia-Rodriguez, Y. A. Melaku, Z. A. Memish, W. Mendoza, T. R. Miller, E. J. Mills, K. A. Mo-hammad, A. H. Mokdad, G. L. Mola, L. Monasta, M. Mon-tico, A. R. Moore, R. Mori, W. N. Moturi, M. Mukaigawara, K. S. Murthy, A. Naheed, K. S. Naidoo, L. Naldi, V. Nangia, K. M. V. Narayan, D. Nash, C. Nejjari, R. G. Nelson, S. P. Neupane, C. R. Newton, M. Ng, M. I. Nisar, S. Nolte, O. F. Norheim, V. Nowaseb, L. Nyakarahuka, I.-H. Oh, T. Ohkubo, B. O. Olusanya, S. B. Omer, J. N. Opio, O. E. Orisakwe, J. D. Pandian, C. Papachristou, A. J. P. Caicedo, S. B. Patten, V. K. Paul, B. I. Pavlin, N. Pearce, D. M. Pereira, A. Pervaiz, K. Pe-sudovs, M. Petzold, F. Pourmalek, D. Qato, A. D. Quezada, D. A. Quistberg, A. Rafay, K. Rahimi, V. Rahimi-Movaghar, S. U. Rahman, M. Raju, S. M. Rana, H. Razavi, R. Q. Reilly, G. Remuzzi, J. H. Richardus, L. Ronfani, N. Roy, N. Sabin, M. Y. Saeedi, M. A. Sahraian, G. M. J. Samonte, M. Sawhney, I. J. C. Schneider, D. C. Schwebel, S. Seedat, S. G. Sepanlou, E. E. Servan-Mori, S. Sheikhbahaei, K. Shibuya, H. H. Shin, I. Shiue, R. Shivakoti, I. D. Sigfusdottir, D. H. Silberberg, A. P.
Silva, E. P. Simard, J. A. Singh, V. Skirbekk, K. Sliwa, S. Soneji, S. S. Soshnikov, C. T. Sreeramareddy, V. K. Stathopoulou, K. Stroumpoulis, S. Swaminathan, B. L. Sykes, K. M. Tabb, R. T. Talongwa, E. Y. Tenkorang, A. S. Terkawi, A. J. Thom-son, A. L. Thorne-Lyman, J. A. Towbin, J. Traebert, B. X. Tran, Z. T. Dimbuene, M. Tsilimbaris, U. S. Uchendu, K. N. Uk-waja, A. J. Vallely, T. J. Vasankari, N. Venketasubramanian, F. S. Violante, V. V. Vlassov, S. Waller, M. T. Wallin, L. Wang, S. X. Wang, Y. Wang, S. Weichenthal, E. Weiderpass, R. G. Weintraub, R. Westerman, R. A. White, J. D. Wilkinson, T. N. Williams, S. M. Woldeyohannes, J. Q. Wong, G. Xu, Y. C. Yang, Y. Yano, P. Yip, N. Yonemoto, S.-J. Yoon, M. Younis, C. Yu, K. Y. Jin, M. El Sayed Zaki, Y. Zhao, Y. Zheng, M. Zhou, J. Zhu, X. N. Zou, A. D. Lopez and T. Vos,Lancet, 2014,384, 1005– 1070.
2 S. I. Hay, E. A. Okiro, P. W. Gething, A. P. Patil, A. J. Tatem, C. A. Guerra and R. W. Snow,PLoS Med., 2010,7, e1000290. 3 R. W. Snow, C. A. Guerra, A. M. Noor, H. Y. Myint and S. I.
Hay,Nature, 2005,434, 214–217.
4 WHO,World Malaria Report, WHO Press, 2014.
5 J. Walling,Invest. New Drugs, 2006,24, 37–77.
6 WHO, Guidelines for the treatment of malaria, WHO Press, 2006.
7 D. Brown,Nat. Rev. Drug Discov., 2015,14, 821–832. 8 J. E. Salcedo-Sora and S. A. Ward,Mol. Biochem. Parasitol.,
2013,188, 51–62.
9 A. S. Tibbetts and D. R. Appling,Annu. Rev. Nutr., 2010,30, 57–81.
10 S. Blatch, K. W. Meyer and J. F. Harrison,Fly (Austin)., 2010, 4, 312–319.
11 I. B. Müller and J. E. Hyde,Mol. Biochem. Parasitol., 2013, 188, 63–77.
12 J. M. Green and R. G. Matthews, EcoSal Plus, 2007, 2,
10.1128/ecosalplus.3.6.3.6.
13 H. F. Nijhout, M. C. Reed, P. Budu and C. M. Ulrich,J. Biol. Chem., 2004,279, 55008–55016.
14 C. M. Ulrich, M. C. Reed and H. F. Nijhout,Nutr. Rev., 2008, 66 Suppl 1, S27–S30.
15 H. F. Nijhout, M. C. Reed and C. M. Ulrich,Folic Acid Folates, Vitam. Horm., Academic Press, 2008, vol. 79, pp. 45–82. 16 T. M. Duncan, M. C. Reed and H. F. Nijhout,Nutrients, 2013,
5, 2457–74.
17 M. Scotti, L. Stella, E. J. Shearer and P. J. Stover,Wiley Inter-discip. Rev. Syst. Biol. Med., 2013,5, 343–365.
18 G. C. J. C. Mark T Mc Auley, Carole J Proctor Bernard M Corfe, K. M. Mooney, K. M. Mc Auley, Mark T Proctor, Carole J Corfe, Bernard M Cuskelly, Geraldine CJ Mooney, M. T. Mc Auley, C. J. Proctor, B. M. Corfe, G. C. J. Cuskelly, K. M. Mooney, G. C. J. C. Mark T Mc Auley, Carole J Proctor Bernard M Corfe, K. M. Mooney and K. M. Mc Auley, Mark T Proctor, Carole J Corfe, Bernard M Cuskelly, Geraldine CJ Mooney,J. Comput. Sci. & Syst. Biol., 2013,6, 271–285.
H. Frederik Nijhout, M. C. Reed and J. F. Gregory,Am. J. Phys-iol. Endocrinol. Metab., 2014,307, E93–E101.
20 W. C. Werkheiser,Ann. N. Y. Acad. Sci., 1971,186, 343–358. 21 P. F. Morrison and C. J. Allegra, J. Biol. Chem., 1989, 264,
10552–10566.
22 C. M. Ulrich, M. Neuhouser, A. Y. Liu, A. Boynton, J. F. Gre-gory, B. Shane, S. J. James, M. C. Reed and H. F. Nijhout, Cancer Epidemiol. biomarkers Prev., 2008,17, 1822–1831. 23 M. L. Neuhouser, H. F. Nijhout, J. F. Gregory, M. C. Reed, S. J.
James, A. Liu, B. Shane and C. M. Ulrich,Cancer Epidemiol. biomarkers Prev., 2011,20, 1912–1917.
24 V. de Crécy-Lagard,Comput. Struct. Biotechnol. J., 2014,10, 41–50.
25 M. Kanehisa and S. Goto,Nucleic Acids Res., 2000,28, 27–30. 26 E. V. Koonin and Y. I. Wolf,Nucleic Acids Res., 2008,36, 6688–
6719.
27 A. Chang, I. Schomburg, S. Placzek, L. Jeske, M. Ulbrich, M. Xiao, C. W. Sensen and D. Schomburg,Nucleic Acids Res., 2015,43, D439–D446.
28 V. K. Viswanathan, J. M. Green and B. P. Nichols,J. Bacteriol., 1995,177, 5918–5923.
29 G. Magnani, M. Lomazzi and A. Peracchi,Biochem. J., 2013, 455, 149–155.
30 Le Novère N, Hucka M, Mi H, Moodie S, Schreiber F, Sorokin A, Demir E, Wegner K, Aladjem MI, Wimalaratne SM, Bergman FT, Gauges R, Ghazal P, Kawaji H, Li L, Matsuoka Y, Villéger A, Boyd SE, Calzone L, Courtot M, Dogrusoz U, Free-man TC, Funahashi A, Ghosh S, Jouraku A, Kim S, Kolpakov F, Luna A, Sahle S, Schmidt E, Watterson S, Wu G, Goryanin I, Kell DB, Sander C, Sauro H, Snoep JL, Kohn K and Kitano H,Nat. Biotechnol., 2009,27, 735–741.
31 H. Rohn, A. Junker, A. Hartmann, E. Grafahrend-Belau, H. Treutler, M. Klapperstück, T. Czauderna, C. Klukas and F. Schreiber,BMC Syst. Biol., 2012,6, 139.
32 S. Hoops, S. Sahle, R. Gauges, C. Lee, J. Pahle, N. Simus, M. Singhal, L. Xu, P. Mendes and U. Kummer,Bioinformatics, 2006,22, 3067–3074.
33 A. Cornish-Bowden,Fundamentals of Enzyme Kinetics, Wiley-Blackwell, Berlin, 4th edn, 2012.
34 Y. K. Kwon, W. Lu, E. Melamud, N. Khanam, A. Bognar and J. D. Rabinowitz,Nat. Chem. Biol., 2008,4, 602–608. 35 K. Lanthaler, E. Bilsland, P. Dobson, H. Moss, P. Pir, D. Kell
and S. Oliver,BMC Biol., 2011,9, 70.
36 J. A. Delmar and E. W. Yu, Protein Sci., 2015, doi:
10.1002/pro.2820.
37 J. E. Salcedo-Sora, E. Ochong, S. Beveridge, D. Johnson, A. Nzila, G. A. Biagini, P. A. Stocks, P. M. O’Neill, S. Krishna, P. G. Bray and S. A. Ward,J. Biol. Chem., 2011,286, 44659– 68.
38 S. S. Pao, I. T. Paulsen and M. J. Saier,Microbiol. Mol. Biol. Rev., 1998,62, 1–34.
39 B. D. Bennett, E. H. Kimball, M. Gao, R. Osterhout, S. J. Van Dien and J. D. Rabinowitz, Nat. Chem. Biol., 2009,5, 593– 599.
40 H. Cherest, D. Thomas and Y. Surdin-Kerjan,J. Biol. Chem.,
2000,275, 14056–14063.
41 O. V. Demin, G. V. Lebedeva, A. G. Kolupaev, E. A. Zobova, T. Y. Plyusnina, A. I. Lavrova, A. Dubinsky, E. A. Goryacheva, F. Tobin and I. I. Goryanin,Model. Mol. Biol., Springer-Verlag, 2004, pp. 59–124.
42 M. Hucka, A. Finney, B. J. Bornstein, S. M. Keating, B. E. Shapiro, J. Matthews, B. L. Kovitz, M. J. Schilstra, A. Funa-hashi, J. C. Doyle and H. Kitano,Evolving a lingua franca and associated software infrastructure for computational systems bi-ology: the Systems Biology Markup Language (SBML) project, 2004.
43 V. Chelliah, N. Juty, I. Ajmera, R. Ali, M. Dumousseau, M. Glont, M. Hucka, G. Jalowicki, S. Keating, V. Knight-Schrijver, A. Lloret-Villas, K. N. Natarajan, J.-B. Pettit, N. Ro-driguez, M. Schubert, S. M. Wimalaratne, Y. Zhao, H. Herm-jakob, N. Le Novère and C. Laibe,Nucleic Acids Res., 2015,43, D542–D548.
44 R. L. Kisliuk,Pharmacol. Ther., 2000,85, 183–190.
45 H. M. Faessel, H. K. Slocum, Y. M. Rustum and W. R. Greco, Int. J. Oncol., 2003,23, 401–409.
46 B. I. Schweitzer, A. P. Dicker and J. R. Bertino,FASEB J., 1990, 4, 2441–2452.
47 J. W. Locasale,Nat. Rev. Cancer, 2013,13, 572–583.
48 A. Vazquez, E. K. Markert and Z. N. Oltvai,PLoS One, 2011, 6, e25881.
49 J. Fan, J. Ye, J. J. Kamphorst, T. Shlomi, C. B. Thompson and J. D. Rabinowitz,Nature, 2014,510, 298–302.
50 P. Stover and V. Schirch, J. Biol. Chem., 1991, 266, 1543– 1550.
51 H. Teramoto, M. Inui and H. Yukawa, Appl Env. Microbiol, 2009,75, 3461–3468.
52 K. Pietrzik, Y. Lamers, S. Bramswig and R. Prinz-Langenohl, Am J Clin Nutr, 2007,86, 1414–1419.
53 F. C. Neidhardt and R. Curtiss, Escherichia Coli and
Salmonella: Cellular and Molecular Biology, American Society for Microbiology, Second Ed. edn, 1996.
54 N. Tepper, E. Noor, D. Amador-Noguez, H. S. Haraldsdóttir, R. Milo, J. Rabinowitz, W. Liebermeister and T. Shlomi,PLoS One, 2013,8, e75370.
55 X.-Y. Zhi, J.-C. Yao, H.-W. Li, Y. Huang and W.-J. Li,Mol. Phy-logenet. Evol., 2014,75, 154–164.
56 P. Stover and V. Schirch,Trends Biochem. Sci., 1993,18, 102– 106.
57 Y. K. Kwon, M. B. Higgins and J. D. Rabinowitz,ACS Chem. Biol., 2010,5, 787–795.
58 R. W. Lacey,J. Antimicrob. Chemother., 1979,5, 75–83. 59 P. A. Masters, T. A. O’Bryan, J. Zurlo, D. Q. Miller and N. Joshi,
Arch. Intern. Med., 2003,163, 402–410.
60 M. G. W. Liang Zhao, Jessie L.-S. Au and M. G. W. Liang Zhao Jessie L.-S. Au,Front. Biosci., 2010,2, 241–249.
62 A. Goyer, E. Collakova, R. Díaz de la Garza, E. P. Quinlivan, J. Williamson, J. F. Gregory, Y. Shachar-Hill and A. D. Hanson, J. Biol. Chem., 2005,280, 26137–26142.
63 V. Piironen, M. Edelmann, S. Kariluoto and Z. Bedo,J. Agric. Food Chem., 2008,56, 9726–9731.
64 S. Hansen, K. Lewis and M. Vuli´c, Antimicrob. Agents
Chemother., 2008,52, 2718–2726.
65 D. Ren, L. A. Bedzyk, S. M. Thomas, R. W. Ye and T. K. Wood, Appl. Microbiol. Biotechnol., 2004,64, 515–524.
66 M. S. Field, D. M. E. Szebenyi, C. A. Perry and P. J. Stover,
Arch. Biochem. Biophys., 2007,458, 194–201.
67 S. Ogwang, H. T. Nguyen, M. Sherman, S. Bajaksouzian, M. R.
Jacobs, W. H. Boom, G.-F. Zhang and L. Nguyen, J. Biol.
Chem., 2011,286, 15377–15390.
68 E. A. Newsholme, J. R. Arch, B. Brooks and B. Surholt, Biochem. Soc. Trans., 1983,11, 52–56.