Quantitative measures of gingival recession and the influence of gender, race, and attrition
Full text
Figure
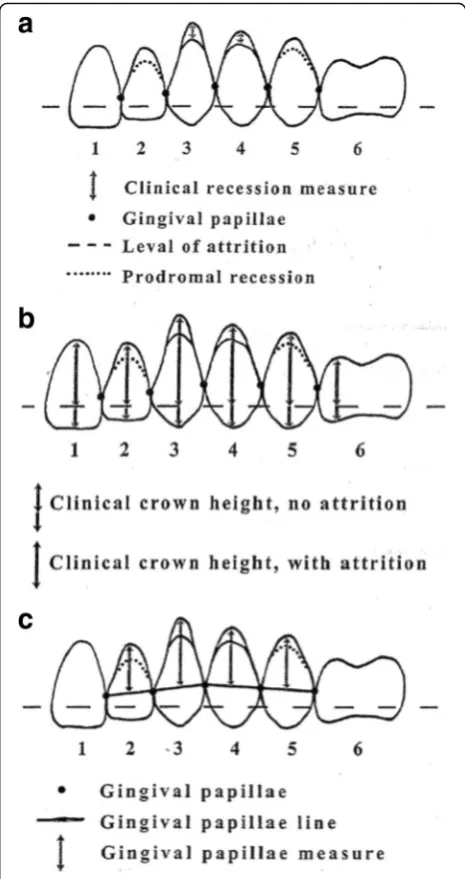
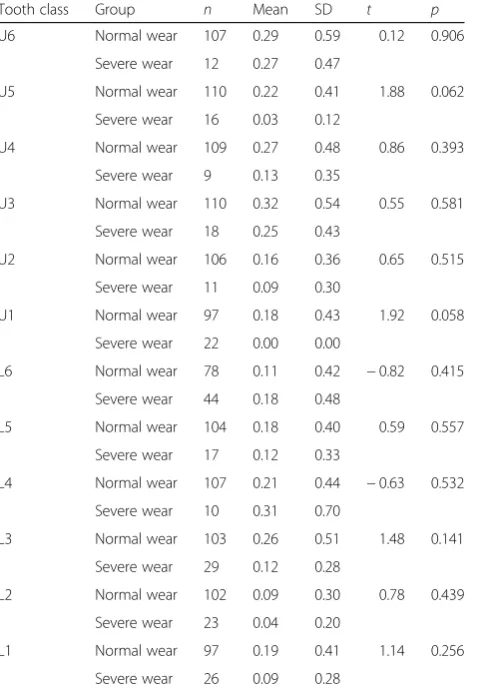
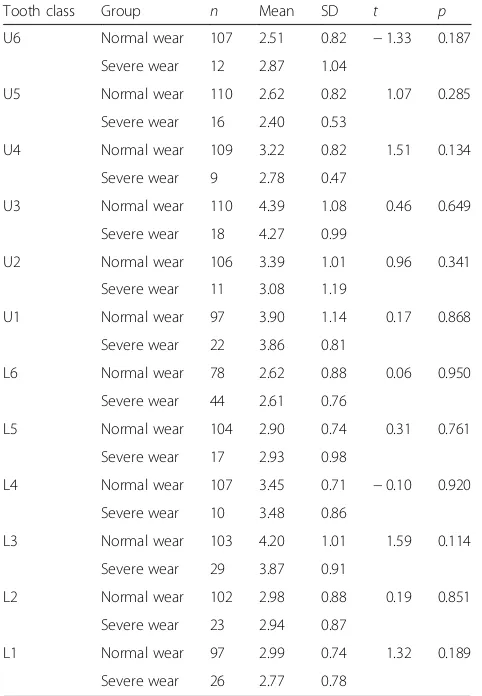
![Fig. 2 The Hooper index [16] is used to define normal wear (0–2)and severe wear (3–5) teeth](https://thumb-us.123doks.com/thumbv2/123dok_us/828894.1580427/4.595.56.290.84.488/fig-hooper-index-used-define-normal-severe-teeth.webp)
Related documents
• The Committee will reach agreements covering pay and national conditions of service and will receive information from the local negotiating committees on agreements reached at
schooling characteristics, such as the commuting time between home and school, living conditions (whether student lives with his/her family during the school year) and the plan of
The global algorithm moves trajectories in time in order to reduce scenario’s conflict count. First of all, conflicts of the scenario are sorted chronologically. Cycling through
[30] They have reported that recording of experience by nursing students, critical review of articles, projects, educational sessions, documenting of interviews
The camera is equipped with a multi-kilo-pixel detector array of kinetic inductance bolometers, cryogenics operating above 5 K, and a multiplexed low- noise electronics to readout
For modelling purposes they propose to make use of the smoothing surplus distribution mechanism used by most Danish life insurance companies and pension companies, basically
There were a substantial number of studies that examined the effect of regulatory policy on corporate crime and, as was the case for punitive sanctions, we were able to calculate
Figure 7: Sydney – Details in temperature, relative humidity and heat index patterns along conditions of maximum negative differences (left dotted ellipse) and maximum positive
