R E S E A R C H
Open Access
Changes in life expectancy 1950
–
2010:
contributions from age- and
disease-specific mortality in selected countries
Jochen Klenk
1,2*, Ulrich Keil
3, Andrea Jaensch
1, Marcus C. Christiansen
4,5,6and Gabriele Nagel
1Abstract
Background:Changes of life expectancy over time serve as an interesting public health indicator for medical, social and economic developments within populations. The aim of this study was to quantify changes of life expectancy between 1950 and 2010 and relate these to main causes of death.
Methods:Pollard’s actuarial method of decomposing life expectancy was applied to compare the contributions of different age- and disease-groups on life expectancy in 5-year intervals.
Results:From the 1960 to 70s on, declines in cardiovascular disease (CVD) mortality play an increasing role in improving life expectancy in many developed countries. During the past decades gains in life expectancy in these countries were mainly observed in age groups≥65 years. A further consistent pattern was that life expectancy increases were stronger in men than in women, although life expectancy is still higher in women. In Japan, an accelerated epidemiologic transition in causes of death was found, with the highest increases between 1950 and 1955. Short-term declines and subsequent gains in life expectancy were observed in Eastern Europe and the former states of the Union of Soviet Socialist Republics (USSR), reflecting the changes of the political system.
Conclusions:Changes of life years estimated with the decomposing method can be directly interpreted and may therefore be useful in public health communication. The development within specific countries is highly sensitive to changes in the political, social and public health environment.
Keywords:Life expectancy, Mortality, Gender, Age, Cause-specific, Decomposition
Introduction
Since 1840, life expectancy of the best performing coun-try in each year has been increasing almost linearly by 2.5 years per decade [1]. Japan achieved the world’s high-est life expectancy over the past 50 years, starting from a very low level at the end of World War II [1, 2], while Japan’s health expenditures are relatively low compared to other nations [2].
From a conceptual perspective, the development of mortality in populations follows similar patterns. The epidemiological transition theory states that when na-tions improve their economic situation, communicable
diseases like infectious and parasitic diseases will be re-placed by non-communicable diseases like cardiovascu-lar diseases (CVD) and cancer [3, 4]. However, the speed of development is affected by various factors. The large variations can be attributed to different economic situa-tions, nutritional and lifestyle factors, work-related and social factors, as well as public health strategies and medical care [5]. In order to set up sound public health programs for healthy aging, it is important to know which causes of death and which age groups harbor the greatest potential for improving life expectancy.
Since 1950, the World Health Organization (WHO) has been collecting data on mortality and causes of death. Life expectancy is a convenient and important summary measure of mortality, and more intuitive than mortality rates. The method suggested by Pollard esti-mates the absolute contribution of each cause of death
* Correspondence:[email protected]
1
Institute of Epidemiology and Medical Biometry, Ulm University, Helmholtzstrasse 22, 89081 Ulm, Germany
2Clinic for Geriatric Rehabilitation, Robert-Bosch Hospital, Auerbachstrasse
110, 70376 Stuttgart, Germany
Full list of author information is available at the end of the article
and each age group expressed as life years to the change of life expectancy [6]. This measure can serve as an in-teresting indicator for social and economic develop-ments within a population. An advantage of this method is that the results can be directly interpreted as changes of life years, and may therefore be used directly in public health communication.
The objectives of this study were to give a longitudinal overview of the contributions of age- and disease-specific mortality rates to the changes in life expectancy, as exem-plified and presented for selected countries between 1950 and 2010.
Material and methods Database
The mortality database of the World Health Organization (WHO) was used for the present analyses (date of ex-traction: December 2013) [7], comprising sex-, age-and disease-specific deaths, as well as corresponding population numbers registered in national civil regis-tration systems from 123 countries for each calendar year between 1950 and 2011. During the reporting period some countries were divided (e.g., Yugoslavia) or unified (e.g., Germany). Since data were not continuously available for all countries or for the entire observation period, gaps in the timeline exist. In the current analysis only sovereign states with time intervals of continuous data reporting over at least 10 years were considered to produce more robust estimates (n= 77). Countries with reporting periods ending before 1990 were excluded as well as those with a total average population of less than one million to reduce random effects due to small num-bers of death. Finally, data from 64 countries were ana-lyzed. We further selected five countries with high life expectancy but varying health expenditures for in-depth analyses: Japan, Switzerland, Singapore, Germany and the US (Table 1). Overall, the data quality and completeness of the included death registers are very heterogeneous [8]. In 2003 more than 80 % had a completeness of 100 %, while 12 % had less than 90 % completeness, with a mini-mum of 54 % in China [8]. The proportion of deaths coded to ill-defined codes ranged from 3 % in Singapore and Finland to 26 % in Greece. In all of the five selected countries, however, the completeness was 100 %, with the proportion of deaths coded to ill-defined codes ranging from 3 to 14 %.
Disease-specific causes of death were reported according to the International Classification of Diseases (ICD). During the observation period four versions of the ICD were used (1962–1968: ICD 7, 1969–1978: ICD 8, 1979–1997: ICD 9 and 1998–2011: ICD 10), which were transferred to ICD 10. To handle coding imprecision, and to have a sufficient number of deaths even for small countries, only main disease groups were considered. The
selected causes of mortality account for more than 90 % of all recorded deaths: infectious and parasitic diseases (ICD 10: A00-B99), malignant neoplasms (C00-C97), dis-eases of the circulatory system (I00-I99), disdis-eases of the respiratory system (J00-J99), diseases of the digestive sys-tem (K00-K93), perinatal diseases (P00-P96) and external causes of mortality (V01-Y98). All other causes of death were combined as“other diseases”.
Analysis
An actuarial method of decomposing life expectancy was used to estimate the contributions of different age groups and disease-specific causes of death to the changes in life expectancy [9]. This method proposed by Pollard was selected because it allows for simultaneously decom-posing both different age groups and different causes of death. It is also nonparametric, avoiding strong model assumptions. Furthermore, the method has a simple and intuitive output, and refrains from splitting effects into different subtypes. For example, it is possible to calculate that the contribution of the reduction in cardiovascular mortality to the increased life expectancy in Japanese women between 2000 and 2005 was 0.47 years. Consider-ing the cause-specific mortality difference in every sConsider-ingle age group within a specific time interval (e.g., 1 year), the difference Δ in average life expectancy at birth between two points in time, denoted in the following by a super-script 1 or 2, is given by the formula:
Δ2−1¼e2 0−e10¼
Xn
i¼1
Xω
x¼0
iQ1x−iQ2x
⋅wxwithwx
¼12 xp20ex1þxp10e2x
whereex1ande2xare the life expectancies at age x for
spe-cific points in time 1 and 2; n denotes the number of considered causes of death and ω the last included age interval; iQx is the mortality rate of the i-th cause of
death at age interval x with the weight wx. xp01 and xp02
denoting the probability of living from birth to age x at time point 1 and 2 derived from the corresponding life tables. Since mortality rates in the WHO database were reported for 5-year age groups the equation had to be adapted accordingly. To adjust for short-term variability, a weighted moving average technique was applied to mortality rates and population numbers [10]. The width of the moving window was 3 years.
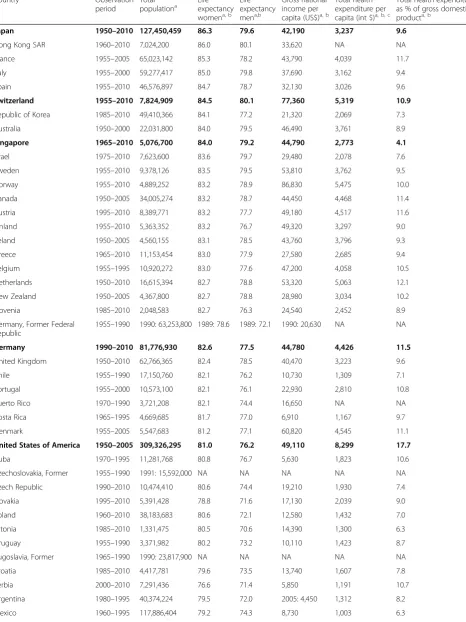
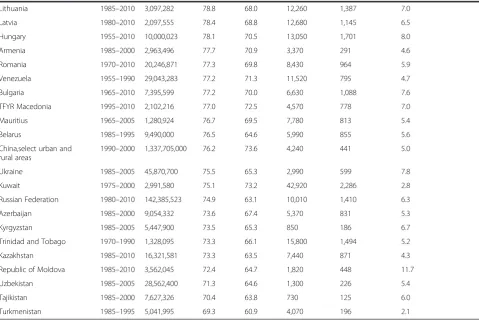
Table 1Characteristics of selected countries
Country Observation period
Total
populationa Lifeexpectancy
womena, b Life expectancy mena,b
Gross national income per capita (US$)a, b
Total health expenditure per capita (int $)a, b, c
Total health expenditure as % of gross domestic producta, b
Japan 1950–2010 127,450,459 86.3 79.6 42,190 3,237 9.6
Hong Kong SAR 1960–2010 7,024,200 86.0 80.1 33,620 NA NA France 1955–2005 65,023,142 85.3 78.2 43,790 4,039 11.7 Italy 1955–2000 59,277,417 85.0 79.8 37,690 3,162 9.4 Spain 1955–2010 46,576,897 84.7 78.7 32,130 3,026 9.6
Switzerland 1955–2010 7,824,909 84.5 80.1 77,360 5,319 10.9
Republic of Korea 1985–2010 49,410,366 84.1 77.2 21,320 2,069 7.3 Australia 1950–2000 22,031,800 84.0 79.5 46,490 3,761 8.9
Singapore 1965–2010 5,076,700 84.0 79.2 44,790 2,773 4.1
Israel 1975–2010 7,623,600 83.6 79.7 29,480 2,078 7.6 Sweden 1955–2010 9,378,126 83.5 79.5 53,810 3,762 9.5 Norway 1955–2010 4,889,252 83.2 78.9 86,830 5,475 10.0 Canada 1950–2005 34,005,274 83.2 78.7 44,450 4,468 11.4 Austria 1995–2010 8,389,771 83.2 77.7 49,180 4,517 11.6 Finland 1955–2010 5,363,352 83.2 76.7 49,320 3,297 9.0 Ireland 1950–2005 4,560,155 83.1 78.5 43,760 3,796 9.3 Greece 1965–2010 11,153,454 83.0 77.9 27,580 2,685 9.4 Belgium 1955–1995 10,920,272 83.0 77.6 47,200 4,058 10.5 Netherlands 1950–2010 16,615,394 82.7 78.8 53,320 5,063 12.1 New Zealand 1950–2005 4,367,800 82.7 78.8 28,980 3,034 10.2 Slovenia 1985–2010 2,048,583 82.7 76.3 24,540 2,452 8.9 Germany, Former Federal
Republic
1955–1990 1990: 63,253,800 1989: 78.6 1989: 72.1 1990: 20,630 NA NA
Germany 1990–2010 81,776,930 82.6 77.5 44,780 4,426 11.5
United Kingdom 1950–2010 62,766,365 82.4 78.5 40,470 3,223 9.6 Chile 1955–1990 17,150,760 82.1 76.2 10,730 1,309 7.1 Portugal 1955–2000 10,573,100 82.1 76.1 22,930 2,810 10.8 Puerto Rico 1970–1990 3,721,208 82.1 74.4 16,650 NA NA Costa Rica 1965–1995 4,669,685 81.7 77.0 6,910 1,167 9.7 Denmark 1955–2005 5,547,683 81.2 77.1 60,820 4,545 11.1
United States of America 1950–2005 309,326,295 81.0 76.2 49,110 8,299 17.7
and ≥65 years. As indicators for the epidemiological transition, time intervals where highlighted by different colors in Tables 2 and 3 if the highest contribution to life expectancy was due to cardiovascular diseases (green), the age group ≥65 years (blue) or both (red). This con-tribution had to be present for at least two subsequent time intervals with not more than one gap between the intervals. All calculations were performed using SAS 9.2.
Results
The characteristics of the selected countries referenced for 2010 and sorted by life expectancy are presented in Table 1. According to the classification of the United Nations, 36 countries were from Europe, 14 from Asia, nine from Latin America and the Caribbean, two from North America, two from Oceania and one from Africa. Life expectancy for women ranged from 69.3 years in Turkmenistan to 86.3 years in Japan and for men from 60.9 years in Turkmenistan to 80.1 years in Hong Kong and Switzerland. The lowest Gross National Income (GNI) per capita was reported in Tajikistan (US$730) and the highest in Norway (US$86,830). Total expenditures on
health in relation to GNI varied considerably between countries. For example in Singapore, Japan, Switzerland, Germany and the US 4.1, 9.6, 10.9, 11.5 and 17.7 % were reported, respectively. In contrast, differences in life ex-pectancy between these countries were less pronounced, with the US trailing behind.
In most of the investigated countries positive values of the relative change in life expectancy by 5-year intervals were observed in women (Table 2) and men (Table 3) in-dicating an increase in life expectancy. Extremely posi-tive changes in life expectancy were observed in Japan between 1950 and 1955: for men and women the overall increase in life expectancy was 4.8 and 5.7 years, respect-ively. Tremendously negative changes were seen among men and women (relative decline −5.2 and −2.6 years, respectively) in the former Soviet Union between 1990 and 1995, while life expectancy increased afterwards. In Germany life expectancy increased since the 1970s be-tween around 1–2 years per 5-year time interval in both men and women. Although in most of the developed countries female life expectancy is still higher than male life expectancy, the increase in life expectancy was sharper
Table 1Characteristics of selected countries(Continued)
Lithuania 1985–2010 3,097,282 78.8 68.0 12,260 1,387 7.0 Latvia 1980–2010 2,097,555 78.4 68.8 12,680 1,145 6.5 Hungary 1955–2010 10,000,023 78.1 70.5 13,050 1,701 8.0 Armenia 1985–2000 2,963,496 77.7 70.9 3,370 291 4.6 Romania 1970–2010 20,246,871 77.3 69.8 8,430 964 5.9 Venezuela 1955–1990 29,043,283 77.2 71.3 11,520 795 4.7 Bulgaria 1965–2010 7,395,599 77.2 70.0 6,630 1,088 7.6 TFYR Macedonia 1995–2010 2,102,216 77.0 72.5 4,570 778 7.0 Mauritius 1965–2005 1,280,924 76.7 69.5 7,780 813 5.4 Belarus 1985–1995 9,490,000 76.5 64.6 5,990 855 5.6 China,select urban and
rural areas
1990–2000 1,337,705,000 76.2 73.6 4,240 441 5.0 Ukraine 1985–2005 45,870,700 75.5 65.3 2,990 599 7.8 Kuwait 1975–2000 2,991,580 75.1 73.2 42,920 2,286 2.8 Russian Federation 1980–2010 142,385,523 74.9 63.1 10,010 1,410 6.3 Azerbaijan 1985–2000 9,054,332 73.6 67.4 5,370 831 5.3 Kyrgyzstan 1985–2005 5,447,900 73.5 65.3 850 186 6.7 Trinidad and Tobago 1970–1990 1,328,095 73.3 66.1 15,800 1,494 5.2 Kazakhstan 1985–2010 16,321,581 73.3 63.5 7,440 871 4.3 Republic of Moldova 1985–2010 3,562,045 72.4 64.7 1,820 448 11.7 Uzbekistan 1985–2005 28,562,400 71.3 64.6 1,300 226 5.4 Tajikistan 1985–2000 7,627,326 70.4 63.8 730 125 6.0 Turkmenistan 1985–1995 5,041,995 69.3 60.9 4,070 196 2.1
Countries with high life expectancy but varying health expenditures who were selected for in-depth analyses are highlighted in bold text a
Data from the year 2010 unless otherwise noted b
Data from World Bank c
in men during the last decades. This, however, was not true for Japan.
As examples for different developments in life expect-ancies among countries with high life expectancy we present the cause- and age-group-specific data of Japan, Switzerland, Singapore, Germany and the US for women (Fig. 1) and men (Fig. 2) in order to explore differences. Particular patterns will be highlighted. In Japan after World War II the increase in life expectancy was excep-tionally marked until 1965. Successively the contribution
of the oldest age group increased, becoming dominant after 1965. Switzerland reached its comparably high life expectancy with a different more monotonic pattern. CVD was the most important contributor across the whole observation period. Even in the last period from 2005 to 2010 the relative contribution of CVD to the change in life expectancy was remarkable. In Japan, the United States, Germany, Singapore and Switzerland the contributions of CVD for women were 94, 78, 75, 61, 58 % and for men 67, 73, 59, 49, 48 %, respectively. Table 2Overall change in life expectancy [years] by 5-year interval in women
In Germany, a remarkable relapse in the develop-ment of life expectancy was observed in men and women between 1965 and 1970. During the fall of the Iron Curtain only a small effect on German life expectancy was seen. In contrast, a tremendous de-crease in life expectancy was observed for Russian men and to a lesser extent for women between 1990 and 1995. Mortality increased mainly in persons aged 15–64 years, and was due to CVD and external causes. During the past decades this was counterba-lanced by increases in life expectancy. In the US, the
patterns of changes in life expectancy were heteroge-neous, with highest increases in life expectancy in the 1970s mainly due to CVD. The patterns observed in Singapore suggest a delayed epidemiological transi-tion, with increasing contributions of CVD since 1980. In the following 30 years the increase in life ex-pectancy was particularly high with an increase of more than 10 life years in men and women. Starting in the 1990s, a decline in mortality due to malignant neoplasms led to a small but notable contribution to the increase in life expectancy.
Table 3Overall change in life expectancy [years] by 5-year interval in men
Considering age- and disease-specific contributions to life expectancy for the investigated countries some basic patterns could be identified (see Tables 2 and 3, as well as Additional file 1: Tables S1–S4). In women (Table 2) declining cardiovascular disease death rates, often in com-bination with changes in the highest age group (red color), became the dominant cause for reductions in all-cause mortality in the 1950s and 60s for North America, most western European countries and for Japan, Australia and New Zealand. After the fall of the Iron Curtain in the 1990s, the same pattern was seen for most of the future members of the European Union (e.g., Hungary) but not for all (e.g., Poland).
The contribution of the age group 65 years and older to the change in life expectancy was dominant already in the 1950s in a few Western European countries and Australia. Corresponding to the cause of death specific development, this age group (≥65 years) gained import-ance in the following years for more and more countries. For men, the development of the age- and cause-specific contributions was similar, but in most countries was de-layed for up to two decades (e.g., France). In the time
period 1990–1995, directly after the fall of the Iron Curtain, a remarkably steep decrease of life expectancy was seen in the age groups “40–64 years”and “65 years and over” in all countries of the former USSR. The de-crease was strongest in Russian men with a loss of 5.2 life years within this 5-year interval.
Discussion
periods with declines in life expectancy particularly in men were observed.
Compared to population-based morbidity data, life expectancy at birth as a measure of mortality is a valid and important indicator of a population’s health status. It is easy to interpret and is intuitive for both layman and experts. The method of decomposing total life expectancy with respect to age- and disease-specific contributions is commonly used in demographical but rarely in public health and epidemiological research. However, this approach allows translating the immediate influence of changes in lifestyle as well as socio-economic and political living conditions on mortality rates into age- and disease-specific contributions to short-term changes in life expectancy.
Limitations of our study are related to data gaps con-cerning completeness and information of causes of death which may have affected some of the observed differences [8]. Causes of death have been coded using varying ICD versions [7–10]. Therefore, code conversion was necessary, which may have resulted in some conversion imprecision. Differences in the application of the classification of causes
of death could have introduced bias as well. However, using only main disease-groups should have reduced bias to a minimum. The completeness and reporting quality differed between countries [8]. Many countries were ex-cluded due to missing long-term data. In some of the analyzed countries and time intervals the proportion of deaths coded as‘symptoms, signs and abnormal clinical and laboratory findings’ is high and could have intro-duced bias. Due to the structure of the WHO Mortality Database, it was not possible to redistribute these deaths to specific causes. This may underestimate the true contribution of a specific cause of death and in-crease the contribution of“others”.
[13]. Also gender-related factors such as risky behavior of men and differences in body size, hormonal factors and innate immunity could contribute to the observed differences in human mortality [15, 16]. The lower CVD mortality in women [17] can be explained by differences in diet and lifestyle factors [18].
The epidemiological transition provides the theoretical background for the massive improvement in life expect-ancy during the 20th century [4]. The stage of the epi-demiological transition differed between countries. The transition from communicable to non-communicable diseases as the main causes of deaths marks a new phase in the mortality development. Today, most premature deaths are preventable, and a major part are attributed to non-communicable disease (NCD), mainly heart ease, stroke, cancer, diabetes and chronic respiratory dis-eases [19]. Since the 1980s several criticisms of the epidemiological transition have been brought forward, since it requires morbidity and mortality data over long time periods. These data are often lacking in middle- and low-income countries. Therefore, it is important to pro-mote and establish systematic health reporting especially in those countries.
The developments in Japan since World War II illus-trate the concept of epidemiological transition within a very short time period. Since 1986 Japan has ranked first for female life expectancy, with the worldwide highest life expectancy of 86.3 years in 2010 [20]. Substantial gains in longevity occurred between 1950 and 1965 by the reduction of infant and young adult mortality. The control of intestinal and respiratory infection, and the implementation of vaccination programs may have contributed to this development [2, 21]. When commu-nicable diseases had been controlled in the seventies, life expectancy continued to rise due to declines in mortality from NCDs.
With regard to recent evaluations of the health care system, medical care as well as total expenditures on health in Japan seem to be average [2]. However, the interplay between general favorable risk factors, the country’s educational profile and broad prevention pro-grams with universal coverage based on strong govern-ment action may explain why life expectancy in Japan increased so rapidly and keeps this leading position compared to other countries with much larger total ex-penditure on health care like the US [22]. Traditionally, the Japanese diet is rich in rice, salt, soy and fish intake, and low in fat intake. With regard to high salt consump-tion, especially in Northern Japan, public health pro-grams were developed and hypertension was targeted and treated as a major public health problem [2].
Our observation that among women CVD mortality declines became the most prominent cause for reductions in all-cause mortality in 1950s and 1960s in many
industrialized countries is consistent with other reports and clearly shows the effectiveness of prevention programs related to smoking behavior, alcohol consumption and physical activity as well as improved treatment [23–25]. However, some of these changes might have been due to infectious diseases and other sources of inflammation [26].
An example to the contrary is Russia’s extreme drop in life expectancy after 1990. The rise in mortality between 1990 and 1995, particularly in young-middle aged men, has been attributed to the economic and social instabil-ity during that period, which may have caused stress, anxiety and depression [27]. After 1995 life expectancy in Russia for both genders improved, with a sharp in-crease between 2005 and 2010. Germany after its unifi-cation showed the opposite development. After adapting to the living conditions of Western Germany, life expect-ancy of people in former Eastern Germany increased by 3.2 years within a period of just 7 years [28].
The small gains in life expectancy in the US in recent years may be partly due to the high prevalence of obesity [29]. In addition, social inequalities are likely to result in ineffective prevention and health-care interventions. The systems of countries like Japan and Sweden, which have less social inequality and more equal access to the med-ical system and treatment, are likely to be more effective at increasing life expectancy [30].
Global key actions to reduce the burden of NCD have been identified by the WHO [31]. The WHO has proposed a 25 % reduction of NCD mortality by 2025. Modifiable risk-factors for NCDs have been identified, and there is evi-dence at the individual and population level that large-scale prevention has the potential to lower the individual disease burden and to save lives [32]. The prevention of NCDs has been ranked a top global priority for economic development [31]. For countries with high health expendi-tures like the US, Germany and other countries of central Europe, the implementation of acceptable cost-effective multi-sectorial prevention programs on tobacco control and salt reduction, as well as the promotion of healthy diet and physical activity, are suitable to handle and contain health expenditures in aging populations [19]. For low-and middle-income countries, stepwise approaches to im-plement prevention activities have high priority to prevent pre-mature death and to maintain workforce [33, 34].
of different health systems may provide further clues for the effective and successful allocation of resources and best approaches for healthy ageing. Well-balanced health politics considering primary and secondary prevention, as well as individually tailored evidence-based treatment, are requirements for maintaining or increasing life expectancy.
Conclusions
In most countries life expectancy is increasing. Although the contribution of different causes of death as well as age groups changed over time, the overall trend of the life expectancy development seems to be quite stable. There is heterogeneity in the achievements to reduce mortality and improve longevity. For long-lasting improvements in life expectancy in countries with moderate health expendi-tures like Japan, the combination of various strategies is necessary to implement successful and cost-effective pre-vention programs and to improve social conditions.
Additional file
Additional file 1: Table S1.Relative change in life expectancy [years] by 5-year interval in women according to cause of death*.Table S2Relative change in life expectancy [years] by 5-year interval in men according to cause of death*.Table S3Relative change in life expectancy [years] by 5-year interval in women according to age of death*.Table S4Relative change in life expectancy [years] by 5-year interval in men according to age of death*. (DOCX 481 kb)
Authors’contributions
All the authors contributed to the study design or protocol design, or both, interpreted the data and wrote the paper. JK, UK, CM and GN conceived and designed the study. JK, AJ and GN analyzed and interpreted the data. JK and GN drafted the manuscript. AJ, UK and CM critically revised the manuscript for important intellectual content. All authors approved the final version to be published.
Competing interests
The authors declare that they have no competing interests.
Author details
1Institute of Epidemiology and Medical Biometry, Ulm University,
Helmholtzstrasse 22, 89081 Ulm, Germany.2Clinic for Geriatric Rehabilitation, Robert-Bosch Hospital, Auerbachstrasse 110, 70376 Stuttgart, Germany.
3
Institute of Epidemiology and Social Medicine, University of Münster, Albert-Schweitzer-Campus 1, 48149 Münster, Germany.4Institute of Insurance
Science, Ulm University, Helmholtzstrasse 20, 89081 Ulm, Germany.5Maxwell Institute for Mathematical Sciences, Edinburgh, UK.6Heriot-Watt University,
EH14 4AS Edinburgh, UK.
Received: 31 July 2015 Accepted: 10 May 2016
References
1. Oeppen J, Vaupel JW. Demography. Broken limits to life expectancy. Science. 2002;296:1029–31.
2. Ikeda N, Saito E, Kondo N, Inoue M, Ikeda S, Satoh T, Wada K, Stickley A, Katanoda K, Mizoue T, Noda M, Iso H, Fujino Y, Sobue T, Tsugane S, Naghavi M, Ezzati M, Shibuya K. What has made the population of Japan healthy? Lancet. 2011;378:1094–105.
3. Olshansky SJ, Ault AB. The fourth stage of the epidemiologic transition: the age of delayed degenerative diseases. Milbank Q. 1986;64:355–91. 4. Omran AR. The epidemiologic transition: a theory of the epidemiology of
population change. Milbank Q. 2005;83:731–57.
5. Houweling TA, Kunst AE, Mackenbach JP. World Health Report 2000: inequality index and socioeconomic inequalities in mortality. Lancet. 2001;357:1671–2.
6. Pollard JH. On the decomposition of changes in expectation of life and differentials in life expectancy. Demography. 1988;25:265–76. 7. Mortality database. [http://www.who.int/healthinfo/mortality_data/en/].
Accessed 17 May 2016.
8. Mathers CD, Fat DM, Inoue M, Rao C, Lopez AD. Counting the dead and what they died from: an assessment of the global status of cause of death data. Bull World Health Organ. 2005;83:171–7.
9. Pollard JH. The expectation of life and its relationship to mortality. J Inst Actuaries. 1982;109:225–40.
10. Rothman KJ, Greenland S. Modern epidemiology. 2nd ed. Philadelphia: Lippincott Williams & Wilkins; 1998.
11. Vaupel JW. The remarkable improvements in survival at older ages. Philos Trans R Soc Lond B Biol Sci. 1997;352:1799–804.
12. Vaupel JW. Biodemography of human ageing. Nature. 2010;464:536–42. 13. Lawlor DA, Ebrahim S, Davey Smith G. Sex matters: secular and
geographical trends in sex differences in coronary heart disease mortality. BMJ. 2001;323:541–5.
14. Waldron I. Sex differences in human mortality: the role of genetic factors. Soc Sci Med. 1983;17:321–33.
15. Owens IPF. Ecology and evolution. Sex differences in mortality rate. Science. 2002;297:2008–9.
16. May RC. Gender, immunity and the regulation of longevity. Bioessays. 2007;29:795–802.
17. Klenk J, Nagel G, Ulmer H, Strasak A, Concin H, Diem G, Rapp K. Body mass index and mortality: results of a cohort of 184,697 adults in Austria. Eur J Epidemiol. 2009;24:83–91.
18. Lopez AD. The evolution of the Global Burden of Disease framework for disease, injury and risk factor quantification: developing the evidence base for national, regional and global public health action. Glob Health. 2005;1:5.
19. Beaglehole R, Bonita R, Alleyne G, Horton R, Li L, Lincoln P, Mbanya JC, McKee M, Moodie R, Nishtar S, Piot P, Reddy KS, Stuckler D. UN high-level meeting on non-communicable diseases: addressing four questions. Lancet. 2011;378:449–55.
20. WHO. World Health Statistics 2011. Geneva: World Health Organization; 2011. 21. Marmot MG, Smith GD. Why are the Japanese living longer? BMJ.
1989;299:1547–51.
22. Murray CJL. Why is Japanese life expectancy so high? Lancet. 2011;378: 1124–5.
23. Murray CJ, Lopez AD. Mortality by cause for eight regions of the world: Global Burden of Disease Study. Lancet. 1997;349:1269–76.
24. Bonneux LG, Huisman CC, de Beer JA. Mortality in 272 European regions, 2002–2004. An update. Eur J Epidemiol. 2010;25:77–85.
25. Helis E, Augustincic L, Steiner S, Chen L, Turton P, Fodor JG. Time trends in cardiovascular and all-cause mortality in the“old”and“new” European Union countries. Eur J Cardiovasc Prev Rehabil. 2011;18:347– 59.
26. Finch CE, Crimmins EM. Inflammatory exposure and historical changes in human life-spans. Science. 2004;305:1736–9.
27. Notzon FC, Komarov YM, Ermakov SP, Sempos CT, Marks JS, Sempos EV. Causes of declining life expectancy in Russia. JAMA. 1998;279:793–800. 28. Klenk J, Rapp K, Büchele G, Keil U, Weiland SK. Increasing life
expectancy in Germany: quantitative contributions from changes in age- and disease-specific mortality. Eur J Public Health. 2007;17:587–92. 29. Preston SH, Stokes A. Contribution of obesity to international differences in
life expectancy. Am J Public Health. 2011;101:2137–43.
30. Di Cesare M, Khang Y-H, Asaria P, Blakely T, Cowan MJ, Farzadfar F, Guerrero R, Ikeda N, Kyobutungi C, Msyamboza KP, Oum S, Lynch JW, Marmot MG, Ezzati M. Inequalities in non-communicable diseases and effective responses. Lancet. 2013;381:585–97.
31. Beaglehole R, Bonita R, Horton R, Adams C, Alleyne G, Asaria P, Baugh V, Bekedam H, Billo N, Casswell S, Cecchini M, Colagiuri R, Colagiuri S, Collins T, Ebrahim S, Engelgau M, Galea G, Gaziano T, Geneau R, Haines A, Hospedales J, Jha P, Keeling A, Leeder S, Lincoln P, McKee M, Mackay J, Magnusson R, Moodie R, Mwatsama M, et al. Priority actions for the non-communicable disease crisis. Lancet. 2011;377:1438–47. 32. Ezzati M, Riboli E. Can noncommunicable diseases be prevented? Lessons
33. Alleyne G, Binagwaho A, Haines A, Jahan S, Nugent R, Rojhani A, Stuckler D. Embedding non-communicable diseases in the post-2015 development agenda. Lancet. 2013;381:566–74.
34. Bonita R, Magnusson R, Bovet P, Zhao D, Malta DC, Geneau R, Suh I, Thankappan KR, McKee M, Hospedales J, de Courten M, Capewell S, Beaglehole R. Country actions to meet UN commitments on non-communicable diseases: a stepwise approach. Lancet. 2013;381:575–84.
• We accept pre-submission inquiries
• Our selector tool helps you to find the most relevant journal • We provide round the clock customer support
• Convenient online submission • Thorough peer review
• Inclusion in PubMed and all major indexing services • Maximum visibility for your research
Submit your manuscript at www.biomedcentral.com/submit
![Table 2 Overall change in life expectancy [years] by 5-year interval in women](https://thumb-us.123doks.com/thumbv2/123dok_us/767446.1573627/5.595.99.543.100.560/table-overall-change-life-expectancy-years-interval-women.webp)
![Table 3 Overall change in life expectancy [years] by 5-year interval in men](https://thumb-us.123doks.com/thumbv2/123dok_us/767446.1573627/6.595.45.547.98.548/table-overall-change-life-expectancy-years-year-interval.webp)


