R E G U L A R A R T I C L E
Open Access
Personalized routing for multitudes in smart
cities
Manlio De Domenico
1*, Antonio Lima
2, Marta C González
3and Alex Arenas
1*Correspondence: [email protected] 1Departament d’Enginyeria Informàtica i Matemàtiques, Universitat Rovira i Virgili, Av.da Països Catalans, 26, Tarragona, 43007, Spain
Full list of author information is available at the end of the article
Abstract
Human mobility in a city represents a fascinating complex system that combines social interactions, daily constraints and random explorations. New collections of data that capture human mobility not only help us to understand their underlying patterns but also to design intelligent systems. Bringing us the opportunity to reduce traffic and to develop other applications that make cities more adaptable to human needs. In this paper, we propose an adaptive routing strategy which accounts for individual constraints to recommend personalized routes and, at the same time, for constraints imposed by the collectivity as a whole. Using big data sets recently released during the Telecom Italia Big Data Challenge, we show that our algorithm allows us to reduce the overall traffic in a smart city thanks to synergetic effects, with the participation of individuals in the system, playing a crucial role.
Keywords: personalized routing; collective behavior; smart city; potential energy landscape; big data
1 Introduction
Rapid development of wireless communication and mobile computing technologies call new research that explores the responses of urban systems to the flow of instant infor-mation. Thus, the analysis of spatial signals becomes an increasingly important research theme.
The required four steps to model trips consist of calculating trip generation, trip distri-bution, modal split and route assignments. The sources to inform these steps traditionally have come from travel diaries and census data []. However, the presence of new infor-mation and communication technologies (ICT) provide big data sources that are allowing novel research and applications related to human mobility. Recent studies have advanced the knowledge on trip generation by studying the number of different locations visited by individuals through mobile phones and quantifying their frequent return to previously visited locations. These have demonstrated that the majority of travels occur between a limited number of places, with less frequent trips to new places outside an individual radius [, ]. In the domain of trip distributions, new models have helped us to predict number of commuting trips when lacking data for calibration [].
An important topic is to explore route assignments in the context of smart multimodal systems [, ], where individual daily trips follow recommendations based on personal and global constraints. This is of special interest towards efficient cities, where individuals could be automatically routed reducing the probability of traffic congestion and at the
same time reducing the environmental impact. From the individual’s point of view, for instance, one might want to choose a trip which minimizes the amount of traffic along the route, or to avoid routes across areas with high criminality level, or to favorite routes across more touristic areas,etc. On the other hand, the choices of certain routes at individual level, without accounting for thestate of the system, often leads to traffic congestion [, ] which, in turn, is responsible for increasing pollution while decreasing the quality of the environment, with evident impact on the community.
In this work we model the trips in an urban system as interacting particles with data-driven origin-destination pairs that can be routed in their trips. Their route choices are based in a time-varying potential energy landscape that seeks to satisfy individual’s and community’s requirements simultaneously. Main streams methods for distributed routing seek to avoid congestion by global travel time reduction based on optimization methods [, ]. More recently, adaptive path optimization on networks (London underground network and global airport network) related the problem to physics of interacting polymers []. In this work we go one step forward in that direction and use a framework based on potential energy landscapes to integrate diverse layers of constraints to favor certain routes and to study the effects of the level of adoption of the proposed recommendations. In this work our main focus is to explore a new framework of analysis to study routing strategies for urban mobility, while the road network constrains are left to further studies.
2 Data-driven routing of human mobility
We consider a geographic area of interest (e.g., a city, a district,etc.) and we discretize it into a gridGwith sizeL×L. In the following, for sake of simplicity, we will consider squared grids with sizeL.
We model individuals moving within the grid as a complex system of interacting sen-tient particles whose goal is to move between two geographic points according to certain criteria. Each criterion is encoded by a matrix C, with the same dimension of the grid, where each entry indicates the state of the corresponding cell inG. In the same spirit of physical models of an electromagnetic surface, we use the convention thatCij> indicates
arepellingcell, i.e., a geographic area that should be avoided. Similarly,Cij< indicates
anattractingcell, i.e., a geographic area that should be involved for routing. Areas where
Cij= are considered as neutral.
The origin of a constraint can be of different nature. In fact, there are constraints at indi-vidual level, i.e., the ones corresponding to requirements of the single user (e.g., avoid areas with high criminality level), and at global level, i.e., the ones corresponding to the require-ment of the whole community (e.g., keep minimum the pollution level). Moreover, there arestatic (or quasi-static) constraintscorresponding to restrictions that do not change over time or change over large temporal scales, anddynamic constraintscorresponding to rapid changes within the system itself, like the traffic flow or the weather. On one hand we should account for individuals’ goals and requirements, while on the other hand it is crucial to satisfy constraints imposed for the wealth of the community.
In the following, we consider the set of all constraints, static and dynamic at individual and collective level, and we assign to each of them a time-varying matrix C(α)(t), where
constraint and to settle on a common scale. Finally, the total constraint matrix is defined by the linear combination of such constraints at each time step:
C(t) =
M
α=
wα(t)Cα(t),
M
α=
wα(t) = , ()
where the coefficientswα(t) are empirical and define a trade-off between individual’s and global constraints. It is worth remarking that these coefficient might vary over time be-cause, depending on the circumstances (special events, incidents,etc.), it could be neces-sary to change their value to satisfy different priorities.
We define another matrix, D(t) (= , , . . . ,N(t)), encoding the starting and
destina-tion cells of each individual in the system, where the starting point is considered to be a repelling or neutral area and the destination point is an attractor. The number of in-dividualsN(t) is allowed to change over time. The matrix D(t) might change over time
because, in principle, the individual might change destination during his or her travel, and for simplicity we assume that –≤Dij≤ for each individual. It is worth remarking
that attracting cells are in general associated to destinations and should be encoded in the set of matricesD(t), whereas repelling cells are associated to constraints and should be encoded only in the set of matricesCα(t).
We interpret the set of matrices C(t) and D(t) as potential energy landscapes and the
routing of individuals is performed by means of a gradient descent, where each user moves along geodesics while reducing his or her potential energy until he or she reaches the des-tination. For simplicity, we assume no dependence on time for matrices D(t). We consider
the case of a gravitational field in two dimensions permeating the areas encoded by D(t).
More specifically, let (i,j) and (i(d),j(d)) denote the cells of the underlying grid and desti-nation point of the journey of individual, respectively, and letr=
(i(d)–i)+ (j
(d)
–j)
indicate their distance. The potential energy landscape is defined by
D(r) =
–√
r, (i,j)= (i
(d)
,j
(d)
),
–√
––, (i,j) = (i
(d)
,j
(d)
),
()
whereis a constant factor, defining the scale of the potential which should guarantee that the potential is strong enough in each cell. In our simulations, we considered= L√. The choice of the value of the potential at the destination is somehow arbitrary and, as a rule of thumb, it should be a number smaller than the potential of the neighbors (whose distance isr= orr=√, the latter if movements along diagonals are allowed), but not so small to avoid a potential well so deep that the rest of the landscape is almost flat.
To guarantee the convergence of the gradient descent even in presence of constraints or noise resulting in potential wells, we weight the overall landscape for each particle by
V(r,t) =γ(t)D(r) + –γ(t)C(r,t), ()
for the constraints, is to make this function changing over time from an initial value up to . A candidate function is given by
γ(t;a,b) = – ( –b)e–at, ()
whereais a non-negative number whose inverseτ =a–defines the time scale for
con-vergence to andbis the relative importance to be assigned at timet= to constraints and destination. A reasonable choice is to balance the two potential energy landscapes to allow the particles to be routed according to the constraintsandthe destination up to a time scaleτ, above which the influence of the destination becomes more important. Small values ofbmight give more importance to the constraints rather than destination, leading to a routing less oriented to the final destination during the first time steps. Therefore, we requireγ()≥ –γ() leading tob≥..
We rewrite Eq. () to put in evidence the terms corresponding to different constraints. Let Cσ(r) andCδ(r,t) denote the potential due to all static and dynamical constraints, respectively, which are not related to the state of the other particles of the system. For in-stance,Cσ(r) might encode the landscape corresponding to crimes, supposed to change over very long time scales, whileCδ(r,t) might encode the areas where it is raining, snow-ing or besnow-ing affected by other meteorological events. On the other hand, we make the realistic assumption that not all individuals follows the routing provided by the smart sys-tem. While the information about the traffic of all individuals can be available by sensors properly disseminated across the grid, it is not possible to predict the behavior of a certain fractionpof individuals. To account for such a fractionpof individuals, we consider a set ofN( –p) individuals moving along shortest paths between pairs of origin and destina-tion, sampled from real data as discussed further in the text, and a setNpof individuals moving randomly in the city, i.e., following random walks instead of shortest paths. We in-dicate byFin(r,t) the potential corresponding to the flow of individualswithinthe system,
i.e., those ones following suggestions from the smart system, and byFout(r,t) the
poten-tial corresponding to the flow of individualsoutof the system. The latter is modeled by a noisy flow in terms of random walking individuals, although other mobility models can be used. In order to preserve conservation of the flow, we rescale each term by the number of particles in the most visited cell, i.e., by a weightm(t) =max[F(t)], being F(t) the matrix accounting for the flow of individuals in the city at timet, withcell∈GF(t) =N(t). The matrix F(t) is not weighted by the factor [ –γ(t)] as in the case ofCσ(r) andCδ(r,t), be-cause it would wash out the contribution of F(t) to the potential landscape for increasing time. This choice makes our model more realistic: in fact, while it is possible to decide to traverse an undesirable area to balance the time spent looking for alternatives, it is not possible to traverse those areas which are congested or overcrowded. Therefore, the potential energy landscape accounting for the traffic flow should not be weighted by the function –γ(t), whose existence is justified only to introduce a trade-off between the needing to reach the destination and the time spent to achieve this goal while accounting for personalized constraints. Finally, Eq. () maps to
V(r,t) =γ(t)D(r) + –γ(t)Cσ(r) +Cδ(r,t)
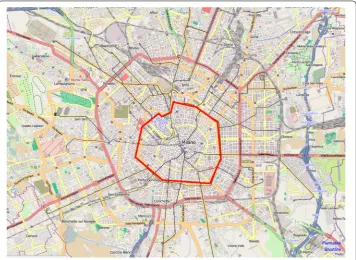
Figure 1 City of Milan.Area of Milan (Italy) considered in the present study. The area is divided into a squared grid with 10,000 cells of size 55,225 m2.
This model is rather general, accounting for the presence of traffic and, simultaneously, for personalized and collective, static and dynamic, constraints. However, in this study we focused only on static constraints and we aggregated time-varying constraints for sim-plicity. It is worth remarking here that the potential landscapeV(r,t) experienced by in-dividualstill changes over time, because of the traffic flow term. Moreover, if agents are distributed in the grid according to the underlying population distribution and they move along shortest-path adapting over time in the evolving potential landscape, it is not pos-sible to perform quantitative predictions about the state of the full system at a given time without numerical simulations.
3 Overview of the dataset
Most of the datasets used in this work were acquired as part of the Telecom ‘Big Data Challenge’ and all of them are related to the city of Milan, Italy (see Figure ).
The constraints encoded by matrices Cα(t) can be represented as different ‘layers’ of the
city, as shown in Figure . The weighted combination of such layers, as in Eq. (), allows to build the potential energy landscapesCσ(r),Cδ(r,t),Fin(r,t) andFout(r,t) influencing the
overall landscape defined by Eq. ().
Figure 2 Layered potential energy landscapes.Each layer represents a potential energy landscape corresponding to a specific individual or collective constraint. The potential energy landscape in the bottom of the figure represents an example of weighted combination of such potentials.
newspaper articles.aIt contains crimes happened during the course of months in Milan and reported by newspapers and local media.
Finally, we used data about the total number of calls and texts generated in Milan by all users of a mobile carrier, over a period of two months. We used the aggregated fraction of calls and texts between areas of the city, aggregated over the whole -month period, to determine the distribution of trip origin and destination, as detailed in the next session.
4 Simulation of personalized routing
We performed massive simulations of personalized routing in Milan to gain insights about which factors influence the time required to complete a journey.
We started by exploring different ways to sample origin and destination cells for each individual in the city. The simplest strategy would be to choose both origin and destination with uniform probability on the grid. Of course, this strategy can not be realistic for several reasons. On one hand, the population is never uniformly distributed over metropolitan areas like Milan, where there is a high concentration of individuals in the ‘core’ of the city, while the population density decreases for increasing distance from the city centre []. In fact, assuming a uniform distribution of origins implicitly considers a population uniformly distributed. On the other hand, the choice of a random destination, regardless of the origin, is not representative of real urban mobility, where individual’s journeys show a high degree of spatio-temporal regularity, with a few highly frequented locations [–] and high predictability of the underlying trajectories [, , ].
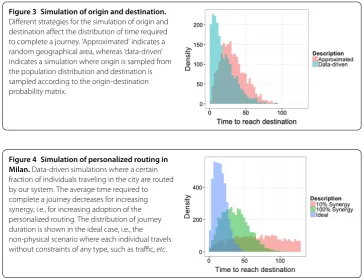
infor-Figure 3 Simulation of origin and destination.
Different strategies for the simulation of origin and destination affect the distribution of time required to complete a journey. ‘Approximated’ indicates a random geographical area, whereas ‘data-driven’ indicates a simulation where origin is sampled from the population distribution and destination is sampled according to the origin-destination probability matrix.
Figure 4 Simulation of personalized routing in Milan.Data-driven simulations where a certain fraction of individuals traveling in the city are routed by our system. The average time required to complete a journey decreases for increasing synergy, i.e., for increasing adoption of the personalized routing. The distribution of journey duration is shown in the ideal case, i.e., the non-physical scenario where each individual travels without constraints of any type, such as traffic,etc.
mation to sample a realistic ensemble of destination pairs and to build an origin-destination probability matrix. Although this is a strong assumption, recent works [–] show how one of these quantities can be used to measure the other. Our simulations, sum-marized in Figure , show that the time required to complete a journey is, on average, faster when a data-driven strategy is employed vs. the one approximated by random origin and destinations.
as traffic,etc. This optimal case, shown in figure for comparison, is a free-flow scenario where every person goes to their destination undisturbed by other people. Individuals’ routes were sampled according to origin-destination matrix also in this case. While it is not possible to fit the distribution of the ideal journey duration, our results show that a % synergy produces a distribution close to the ideal one. It is worth remarking that this analysis would be able to quantify the benefits of synergy for urban traffic if information on the individual adoption of routing technology could be available to researchers.
Our routing system also allows to monitor mobility of the city from a new point of view. Interpreting individuals as particles moving in a thermodynamical system, it is possible to calculate the ‘temperature’ of the city. For each particlewe calculate the mean speed at timetby
vt;t()
=
[i(t) –i(t())]+ [j(t) –j(t()
)] t–t()
, ()
i.e., as the ratio between the distance travelled up to timetand the time required to travel. Heret() indicates the time at which the particle has been injected into the system, i.e., the time at which the individuals leaves the origin of his or her route. The temperature of this system can be defined as the mean squared speedv . This measure is better un-derstood in terms of permeability (or connectivity) of the city, as defined in urban studies allowing us to quantify how fast individuals flow through the city. Therefore, we define the permeability by
P(t) =v(t)
=
Nin(t)
Nin(t)
=
v(t), ()
where the sum and the average are limited to individuals adopting the routing system, because of the lack of information about origin-destination of the others. Nevertheless,
P(t) is indirectly affected by the traffic generated byNout(t) individuals, therefore it is a
robust measure of permeability. Higher the value of P(t) faster the flow of individuals trough the city and, conversely, lower the value ofP(t) and slower the movements in the city, i.e., higher the probability that there are congested areas or, in the worst case, ‘frozen’ cells in the grid. In the upper panel of Figure we show how the permeability changes over time for a data-driven simulation withN= individuals,a= .,b= . andp= , i.e., for % synergy. The color gradient codes the status of the city with respect to its historical permeability. The existence of congested areas is more evident when the time series of anomalyA(t) is observed. The anomaly is defined as the departure ofP(t) from the historical averageμP(t) with respect to the historical standard deviationσP(t)
A(t) = P(t) –μP(t)
σP(t) , ()
where
μP(t) =
t t
τ=
Figure 5 Monitoring traffic congestion in the city.Permeability of the city and corresponding anomaly
versustime in the case of a data-driven simulation withN= 100 individuals,a= 0.1,b= 0.5 andp= 0. The horizontal lines in the bottom panel corresponds to different possible levels of ‘traffic congestion alert’. The color gradient codes the status of the city with respect to its historical permeability (see the text for further detail).
σP(t) =
t t
τ=
P(τ)–
t t
τ= P(τ)
. ()
In the bottom panel of Figure we show the anomaly changing over time. The traffic experiences large fluctuations for large values oft, positive and negative ones, alternat-ing periods of high permeability with a few periods of low permeability. This is due to a few overcrowded cells that are quickly and automatically uncrowded by the system itself. Therefore, it is possible to monitor the traffic of the city by looking at the permeability and its anomaly over time, programming different alert levels such as low (–≤A(t) < –.), medium (–.≤A(t) < –) or criticalA(t) < –..
5 Discussion and conclusions
We have presented a strategy to route individuals between pairs of points of interest ac-cording to constraints of different type. Our method accounts for the simultaneous inter-playing between personalized constraints, as avoiding specific areas of the city because of personal choices, and collective constraints, from pollution reduction in certain areas of the city to the presence of adverse atmospherical conditions requiring targeted inter-vention. We have shown that the synergy plays a fundamental role in designing a smart city: only when all individuals take part in the routing system and move according to the recommended routes, the overall traffic in the city is closer to the most ideal mobility sce-nario. In the presence of real time information, our method allows to monitor the state of the city in real time, automatically identifying areas that are experiencing a temporary congestion and giving authorities the possibility to intervene timely.
through the city. For instance, it would be possible to route cars or drones which are col-lecting data about the city (as Google cars) and to route people in charge of social services like cleaning the streets or performing targeted intervention, as disseminating salt in areas with snow. An additional application could be in the field of social security, to route police cars in areas with high crimes rate. Finally, our framework can help decision-makers to real-time application of urban mobility policies in responses to crisis, e.g. the emergence of hotspots of infection in specific areas of the city (or a larger area) can be incorporated into the model to avoid people passing through dangerous areas before physical quaran-tine is employed.
Competing interests
The authors declare that they have no competing interests.
Authors’ contributions
MDD, AL, MCG and AA devised the study and wrote the manuscript. MDD and AL performed the data analysis and data-driven simulations. All authors reviewed and approved the complete manuscript.
Author details
1Departament d’Enginyeria Informàtica i Matemàtiques, Universitat Rovira i Virgili, Av.da Països Catalans, 26, Tarragona, 43007, Spain.2School of Computer Science, University of Birmingham, Edgbaston, Birmingham, B15 2TT, UK. 3Department of Civil and Environmental Engineering, Massachusetts Institute of Technology, 77 Massachusetts Avenue, Cambridge, MA 02139, USA.
Acknowledgements
MDD is supported by the European Commission FET-Proactive project PLEXMATH (Grant No. 317614), AA by the MULTIPLEX (grant 317532) and the Generalitat de Catalunya 2009-SGR-838. AA also acknowledges financial support from the ICREA Academia, the James S. McDonnell Foundation, and FIS2012-38266. MCG acknowledges Accenture and the KACST-Center for Complex Engineering Systems.
Endnote
a http://www.linkiesta.it/reati-a-milano.
Received: 22 July 2014 Accepted: 14 January 2015 References
1. Hazelton ML (2008) Statistical inference for time varying origin-destination matrices. Transp Res, Part B, Methodol 42(6):542-552
2. Schneider CM, Belik V, Couronné T, Smoreda Z, González MC (2013) Unravelling daily human mobility motifs. J R Soc Interface 10(84):20130246
3. Song C, Qu Z, Blumm N, Barabási A-L (2010) Limits of predictability in human mobility. Science 327(5968):1018-1021 4. Simini F, González MC, Maritan A, Barabási A-L (2012) A universal model for mobility and migration patterns. Nature
484:96-100
5. De Domenico M, Solé-Ribalta A, Gómez S, Arenas A (2014) Navigability of interconnected networks under random failures. Proc Natl Acad Sci USA 111(23):8351-8356
6. Gallotti R, Barthelemy M (2014) Anatomy and efficiency of urban multimodal mobility. Sci Rep 4:6911
7. Youn H, Gastner MT, Jeong H (2008) Price of anarchy in transportation networks: efficiency and optimality control. Phys Rev Lett 101(12):128701
8. Wang P, Hunter T, Bayen AM, Schechtner K, González MC (2012) Understanding road usage patterns in urban areas. Sci Rep 2:1001
9. Delling D, Goldberg AV, Pajor T, Werneck RF (2011) Customizable route planning. In: Experimental algorithms. Springer, Berlin, pp 376-387
10. Yeung CH, Saad D, Wong KM (2013) From the physics of interacting polymers to optimizing routes on the London underground. Proc Natl Acad Sci USA 110(34):13717-13722
11. Makse HA, Havlin H, Stanley H (1995) Modelling urban growth. Nature 377:19
12. Gonzalez MC, Hidalgo CA, Barabasi A-L (2008) Understanding individual human mobility patterns. Nature 453(7196):779-782
13. Lima A, De Domenico M, Pejovic V, Musolesi M (2013) Exploiting cellular data for disease containment and information campaigns strategies in country-wide epidemics. arXiv:1306.4534
14. Salnikov V, Schien D, Youn H, Lambiotte R, Gastner M (2014) The geography and carbon footprint of mobile phone use in cote d’ivoire. EPJ Data Sci 3(1):3
15. Song C, Koren T, Wang P, Barabási A-L (2010) Modelling the scaling properties of human mobility. Nat Phys 6(10):818-823
16. De Domenico M, Lima A, Musolesi M (2013) Interdependence and predictability of human mobility and social interactions. Pervasive Mob Comput 9(6):798-807
18. Farrahi K, Emonet R, Cebrian M (2014) Epidemic contact tracing via communication traces. PLoS ONE 9(5):95133 19. Palchykov V, Mitrovi´c M, Jo H-H, Saramäki J, Pan RK (2014) Inferring human mobility using communication patterns.