T E C H N I C A L N O T E
Open Access
MultiQ: single sensor-based multi-quality
multi-modal large-scale biometric score
database and its performance evaluation
Md. Zasim Uddin
*, Daigo Muramatsu, Takuhiro Kimura, Yasushi Makihara and Yasushi Yagi
Abstract
Single sensor-based multi-modal biometrics is a promising approach that offers simple system construction, low cost, and wide applicability to real situations such as CCTV footage-based criminal investigations. In multi-modal
biometrics, fusion at the score-level is a popular and promising approach, and data qualities that affect the matching score of each modality are often incorporated as a quality-dependent score-level fusion framework. This paper presents a very large-scale single sensor-based multi-quality multi-modal biometric score database called MultiQ Score Database version 2 to advance the research into evaluation, comparison, and benchmarking of score-level fusion approaches using both quality-independent and quality-dependent protocols. We extracted gait, head, and height modalities from the OU-ISIR Gait Database and introduce spatial resolution (SR), temporal resolution (TR) and view as quality measures that significantly affect biometric system performance. We considered seven and 10 scaling factors for SR and TR, respectively, with four view variations. We then constructed a database comprising
approximately 4 million genuine and 7.5 billion imposter score databases. To evaluate this database, we set two different protocols, and provided a set recognition accuracy for state-of-the-art approaches using protocols for both quality-independent and quality-dependent schemes. This database and the evaluation results will be beneficial for score-level fusion research. Additionally, we provide detailed analysis of the recognition accuracies associated with gait, head, and height modalities in different spatial/temporal resolutions and views. These analyses may be useful in criminal investigation research.
Keywords: Single sensor, Multi-quality, Multi-modal, Biometric database, Score-level fusion, Performance evaluation
1 Introduction
Biometrics technology recognizes a person based on their physiological and/or behavioral traits [1], including their DNA, fingerprint, palmprint, finger veins, face, signature, and gait. Biometrics has been widely used in applications such as access control, security, surveillance, and foren-sics [2, 3]. Biometric systems that use a single biometric trait for recognition are called uni-modal biometric sys-tems, and are regarded as mainstream biometric system approaches because of their simple configurations and high usability. These systems are, however, commonly affected by practical problems such as noisy sensor data, non-universality, and vulnerability to spoofing attacks [4].
*Correspondence: [email protected]
The Institute of Scientific and Industrial Research, Osaka University, Osaka 5670047, Japan
One solution to these problems is to use multiple bio-metric traits for recognition, and systems of this type are known as multi-modal biometric systems [5]. A wide variety of biometric modality combinations have been discussed for recognition in the literature, including fin-gerprint and iris [6], iris and face [7], face and ocular [8], face and gait [9, 10], and face with gait and height [11].
The most important issue in multi-modal biometrics is how to fuse these individual modalities. Fusion of mul-tiple modalities can be performed at various different levels, including sensor, feature, score, rank, and deci-sion levels. In sensor-level fudeci-sion, the raw data that are acquired from multiple sensors are integrated (i.e., by mosaicing, where multiple individual 2D images are com-bined to generate a single image); in feature-level fusion, the features that are extracted from multiple modalities are concatenated into a single feature vector and are then
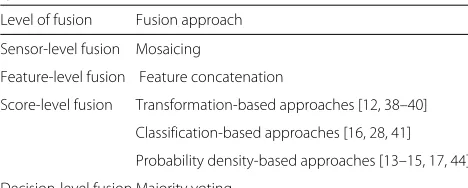
fusion is the most popular approach because it offers rea-sonable recognition accuracy and comparatively simple implementation, and thus many researchers in the multi-modal research community work in the score-level fusion field [12–17]. These fusion approaches are summarized in Table 1.
In a biometric system, some of the auxiliary informa-tion or quality measures [18] that are associated with the biometric samples affect the system’s discrimina-tion capabilities, even though they do not provide the capability to identify the subject by themselves. Many quality measures that significantly affect the recogni-tion accuracy have been reported in the literature to date. These quality measures mainly fall into two fam-ilies: sample-based quality, and sensor-based quality. Examples of sample-based quality measures include the degree of occlusion and/or blur, and texture richness in iris recognition [19, 20]; the signal-to-noise ratio (SNR) for speech recognition [21]; brightness, contrast, and illumination for fingerprint and face recognition [20]; and the view for face and gait biometrics [22]. Cor-responding examples for sensor-based quality include image size or spatial resolution (SR) for image-based biometric systems such as face and fingerprint recogni-tion systems [20], and frame rate (i.e., temporal resolu-tion) for video-based biometrics such as gait recognition systems [23].
Quality measures play an important role in score-level fusion systems and have been used to improve recog-nition accuracy [18, 24, 25]. In the majority of these approaches, the appropriate quality measures are calcu-lated independently for each modality; this is a natural approach because each modality sample is captured using an individual and independent sensor, and the sensor’s properties are a major factor in determining the sample quality. For example, in multi-modal biometrics with face
Table 1Fusion approaches at the various multi-modal biometric system levels
Level of fusion Fusion approach
Sensor-level fusion Mosaicing
Feature-level fusion Feature concatenation
Score-level fusion Transformation-based approaches [12, 38–40]
Classification-based approaches [16, 28, 41]
Probability density-based approaches [13–15, 17, 44]
Decision-level fusion Majority voting
of multiple modalities are therefore affected by the same sensor property. For example, face and gait images cap-tured simultaneously using a single camera [26] are both affected by the same sensor property (e.g., the SR of the sensor affects both the face and the gait samples, and it also affects the matching scores as a result). In general, correlation of matching scores that originate from differ-ent modalities are not so high in multiple sensor-based multi-modal biometrics, but this is not true for single sensor-based multi-modal biometrics, because the same sensor property affects the sample qualities of multiple modalities, and these qualities then affect the matching scores.
In the multi-modal research community, there are few multi-quality benchmark score databases; even Poh et al. [20] generated a score database with modality-specific quality measures (e.g., brightness and contrast for the face modality, with texture richness for fingerprint and iris modalities) and some general image quality mea-sures, but this was a multiple sensor-based score database. Unlike this multiple sensor-based score database, we con-sidered a single sensor-based multi-modal score database in this study, where the qualities commonly affect all the modality scores that can be captured by a single sensor.
With the growing trend for machine-learning approaches, a large-scale dataset is essential to enable efficient training of the model, and it is also required for statistically reliable performance evaluation. Additionally, in density estimation for the likelihood ratio test (e.g., in a forensic case), a large-scale database enables more accurate estimation of the densities, which are dependent on the relatively large score databases.
In this paper, we introduce a very-large-scale multi-quality multi-modal biometric score database to advance the state-of-the-art of quality-dependent score-level fusion research. More specifically, we consider single sensor-based multi-modal biometrics from gait, head, and height modalities and focus on the sensor-based quali-ties of spatial resolution (SR), temporal resolution (TR) and sample-based quality of view, which all significantly affect the scores of the individual biometric modalities. The contributions made by the present paper are as follows.
drawn from a publicly available database: the OU-ISIR Gait Database, Large Population Dataset [27]. Additionally, our database contains a very large number of scores because of the large numbers of subjects and qualities that are included, with totals of 3,908,128 genuine scores and 7,468,432,608 imposter scores, and thus will serve as a benchmark for score-level fusion approaches for the multi-modal biometrics research community.
2. We provide two protocols (i.e., quality dependent and independent) and have conducted a performance evaluation using a variety of score-level fusion approaches, including transformation-based approaches [12], classification-based approaches [16, 28], probability density-based approaches [13–15] and some of the quality-dependent versions of these approaches. The results of this performance evaluation are intended for use as a baseline for future research on quality-dependent score-level fusion.
The score database that was constructed with detailed protocol settings is publicly available1 for research purpose. An earlier preliminary version of this work was published in [29] and the extensions from it can be sum-marized in the following points:
• We constructed our database by introducing the multi-view concept, whereas the previously released database [29] considered only the side-view, and discussed use of the view as a quality measure; in addition, we applied some pre-processing steps on the feature level and have called this database “MultiQ Score Database version 2”.
• We have added an analysis of how the quality measures affect the recognition accuracy of each modality.
• We have added the RankSVM as a new benchmark to enable further discussion of the evaluation results. Consideration of the RankSVM enables analysis of the recognition accuracy in greater depth.
2 Related work
2.1 Existing score database
Initially, researchers developed multi-modal fusion approaches using chimeric datasets because collection of multi-modal data that were captured from the same subjects is a laborious task. Because data of differ-ent modalities should be independdiffer-ent of each other, researchers believe that the properties of chimeric datasets are similar to those of real data sets. Therefore, a set of multiple modality features that are captured from different subjects are used as a set of features from a single virtual subject. For example, a face sample from
one person and a fingerprint sample from another person are used as a multi-modal feature set for a virtual subject [30]. While these types of databases are accepted to a degree in score-level fusion research, serious questions remain as to whether this was the correct thing. Poh et al. demonstrated experimentally that the performance of a database of real multi-modal users is not equivalent to that of a database of chimeric users [31], while Wayman mentioned that multi-biometric data may necessarily be correlated [32], and thus the use of chimeric databases should be avoided.
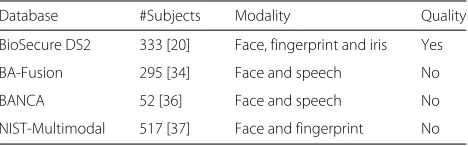
Recently, several real multi-modal biometric databases and score databases have been released for research purposes. The major real multi-modal score databases that exist at present are summarized in Table 2. These databases are briefly described here.
The BioSecure DS2 score database [20] was constructed using the desktop scenario dataset of the BioSecure DS2 database [33] with face, fingerprint, and iris modalities. Originally, the desktop scenario dataset contained voice, face, signature, fingerprint, hand, and iris modalities, and data were acquired in a desktop-based office environment. A total of 333 subjects with equal male and female dis-tributions are included in this score database, although the age distribution is somewhat biased; two thirds of the subject’s ages are in the 18–40-years-old range, while the others are over 40 years old. The main characteristic of the BioSecure DS2 score database is that it considers 14 quality measures for face modality; six of these measures are face-related quality measures, and these qualities are set on the basis of face detection (e.g., detection relia-bility, number of pixels between the eyes, face with or without glasses, rotation in the plane, rotation in depth, and degree of frontal face); the remaining eight mea-sures are related to the image quality. Additionally, the database considers one quality measure for the finger-print modality (e.g., texture richness), and three quality measures for the iris modality (e.g., texture richness, dif-ference between the iris and pupil diameters, and pro-portion of the iris used for matching). In [20], multiple evaluations were reported, including quality-dependent, client-specific, and cost-sensitive fusion.
The BA-Fusion score database [34] was built from the XM2VTS database [35] using face and speech modali-ties. This score database is composed of eight matching
Table 2Existing major score databases
Database #Subjects Modality Quality
BioSecure DS2 333 [20] Face, fingerprint and iris Yes
BA-Fusion 295 [34] Face and speech No
BANCA 52 [36] Face and speech No
genders were included, but the age distributions are biased (in that the subjects are all adults). No quality measures were provided in this database.
The BANCA score database [36] is composed of face and speech modalities from 52 subjects in two groups. This score database was generated using a set of state-of-the-art baseline classifiers along with template-based approaches. While this score database does consider con-trolled (clean), adverse (under challenging conditions), and degraded scenarios, no quality measures are provided in this database.
The NIST-Multimodal score database [37] is composed of two face and two fingerprint scores from 517 sub-jects. Two fingerprint scores were obtained by comparing a pair of left index fingers and a pair of right index fin-gers. Two face scores were generated using two separate face matchers. The numbers of generated genuine and imposter scores are 517 and 517×516 = 266,772, respec-tively. Again, no quality measures were provided in this database.
In contrast to the existing score databases, the pro-posed MultiQ Score Database version 2 may contain suf-ficient variation in term of subjects, quality measures, and very-large-scale genuine and imposter scores. The exist-ing major multi-modal score database includes less than 600 subjects, as shown in Table 2, whereas the proposed database contains 1912 subjects with an approximately equal distribution of male and female subjects, and with ages ranging from 2 to 82 years. All the modalities of the proposed database are extracted using only a single sensor while the other databases mentioned above used multiple sensors.
2.2 Score-level fusion
In the score-level fusion of multi-biometric systems, the most important issue is how to fuse the scores of the different modalities. Many fusion techniques have been proposed in the literature to date. As shown in Table 1, these approaches can be classified into three generic cate-gories: (1) transformation-based, (2) classification-based, and (3) probability density-based approaches.
In a transformation-based approach, the scores are usu-ally normalized to a common domain by one of sev-eral normalization techniques (e.g., z-normalization [38], F-normalization [39], and EER-normalization [40]) and the normalized scores are then combined. Kittler et al. focused on classifier combination and developed a the-oretical framework for classifier combination [12]. They
discriminate genuine scores from imposter scores. A sup-port vector machine (SVM) is one such classifier and the signed distance from the decision boundary is usu-ally regarded as a fused score [16, 41]. Additionusu-ally, the ranking SVM (RankSVM) [28] is a well-known exten-sion of the conventional SVM that focuses more on the relative distance between two classes. RankSVM has been used in many research fields, including person re-identification and gait recognition [42]. Because ranking statistics play an important role in identification scenar-ios [43], RankSVM can be considered to be a promising approach to score-level fusion for identification scenarios. The probability density-based approach is further divided with respect to two specific aspects: generative vs. discriminative approaches, and parametric vs. nonpara-metric approaches. Paranonpara-metric and generative approaches explicitly or implicitly model the distributions for each class separately and subsequently estimate the model parameters from the training data. Nandakumar et al. proposed a framework for a likelihood ratio-based fusion rule and estimated the genuine and imposter distributions in the form of a finite Gaussian mixture model (GMM). It was shown that a likelihood ratio-based approach led to high performance for quality-based biometrics when using three multibiometric databases [15].
for a more efficient representation [17]. In both methods, the estimation of individual genuine and imposter densi-ties is bypassed and the discriminative function is trained directly.
As shown above, a wide variety of approaches have been proposed for each category in score-level fusion. In this study, we have considered at least two approaches from each generic category to evaluate the performance of the proposed score database.
2.3 Quality-dependent approaches
Quality can be considered to be auxiliary information that affects the matching score. Generally speaking, if biometric samples are of good quality, matching scores of the genuine and imposters are more easily separable. Therefore, quality measurement/assessment algorithms and recognition accuracy improvement using the quality measures, enjoy a large body of literatures in biometrics community [45–47].
Quality measures can be used at various stages in the recognition pipeline to improve the recognition accuracy. During the enrollment phase, a quality measure is used as the criterion for sample recapture [48]. In the preprocess-ing phase, both quality-dependent feature enhancement and quality-dependent target region selection are con-sidered [46]. In the matching phase, different matching algorithms are used to calculate the scores for uni-modal and multi-modal biometrics. In this phase, classifier or distance metrics are selected adaptively depending on the sample quality [49]. Another direction is to directly stack the quality measures into a score vector, i.e., Q-stack vec-tor and to treat it as a feature vecvec-tor for classification [50, 51]. Moreover, in [52, 53], biometric samples are clas-sified into clusters based on the sample quality, and score normalization or fusion are done in a cluster-dependent way.
3 Single sensor-based multi-quality multi-modal
biometric score database
3.1 Overview of the OU-ISIR Gait Database, Large Population Dataset
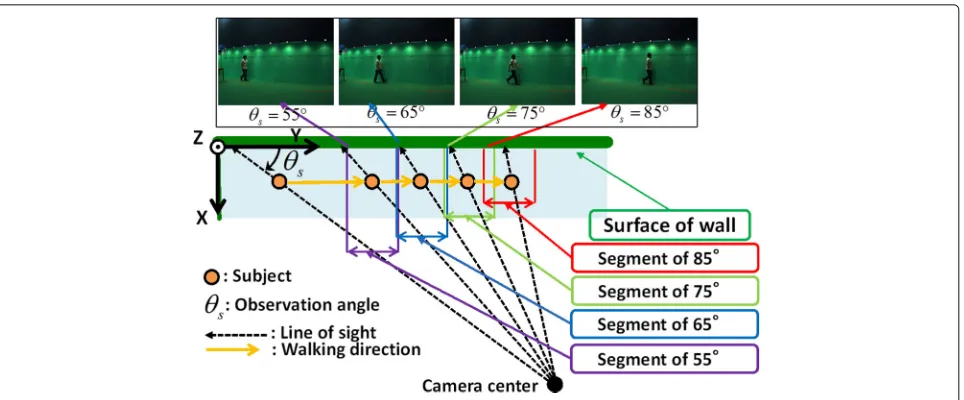
The OU-ISIR Gait Database, Large Population Dataset [27] was collected with the aim to a statistically reliable performance evaluation of large-scale gait recognition. We used 1912 subjects, a subset of this dataset to gen-erate scores. For this dataset, each subject was asked to walk straight along a predetermined corridor in a natu-ral manner twice, and two walking image sequences were captured for each subject using a single camera placed at a distance of 5 m. The image size was 640×480 pixels, and 30 images (frames) were recorded per second (30 fps). Each image sequence is divided into four segments based on observation azimuth angles of 55°, 65°, 75°, and 85°. Examples of the captured images are shown in Fig. 1.
Silhouette image sequences were generated initially from the captured image sequences using a background subtraction-based graph-cut segmentation method [54]. Head region image features were extracted from the cap-tured image sequences using the information from the silhouette images. Lens distortion removal, rectification, and cropping processes were used in the processing to generate the gait and height features. Rectification was performed using the camera calibration parameters such that thexandyaxes of the image plane are located par-allel to the walking and vertical directions of the real 3D world, respectively. As a result of the rectification pro-cess, calculation of the subject’s height becomes simple; the vertical positions of the foot and the top of the head can be obtained from the bounding box information, and the actual height of the subject in the real 3D world can then be calculated via a simple conversion process using the camera calibration parameters because the distance between the camera and the subject on the walking course was the same for all subjects in the dataset.
3.2 Quality measures
We focus on the SR, the TR, and the view as factors that affect the matching score of each feature, and gener-ate a score database with different qualities using image sequences with different values of these factors. To gener-ate such a score database, we first genergener-ated datasets with various qualities by scaling the image sequences down in terms of their SRs. We also downsampled in terms of the TRs and then generated image sequences using different TRs. We then extracted the required gait, head, and height features. Finally, we calculated the matching scores for the gait, the head, and the height using these extracted fea-tures, and saved them along with the associated SR, TR, and view values. We considered the following SRs and TRs.
SR: To simulate the image sequences with different image sizes and/or image sequences of subjects at differ-ent distances2, we set scaling factors to downsample the original captured image sequences such that the average height of all subjects does not fall below 20 pixels, because extraction is difficult when the SR is too low. Specifi-cally, we downscaled the original images using factors of 1/2, 1/3, 1/4, 1/5, 1/6, and 1/8, and then prepared image sequences with sizes of 640×480, 320×240, 213×160, 160×120, 128×96, 106×80, and 80×60 pixels. Con-sequently, image sequences with seven different SRs were then used to construct the score database.
Fig. 1Examples of captured images in the OU-ISIR Gait Database, Large Population Dataset
gray-scale values other than binary values (e.g., back-ground or foreback-ground), we applied thresholding to keep it binary a silhouette image sequence after down-sampling. Moreover, because the boundary of down-sampling by the area interpolation (e.g., pixels whose horizontal or ver-tical position is a multiple of kfor down-sampling with factors of 1/k) does not necessarily coincide with the bottom of foot or the top of the head, we randomly shift-up/down the boundary of down-sampling for each subject in order to better simulate the walking position differ-ences among subjects. More specifically, we generated a random number for each subject to shift the silhouette image sequences up or down such that the top of the subject’s head or the bottom parts of their feet are not moved outside the image. The entire silhouette image sequence for each subject was then shifted up/down using the set value, and the same process was applied to each subject.
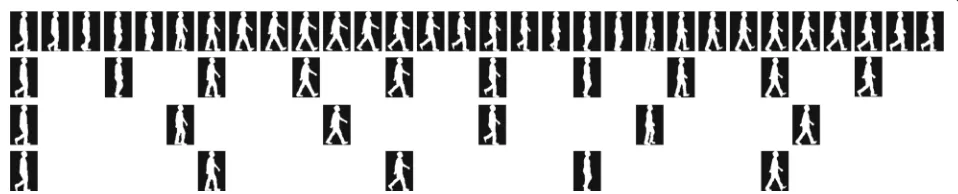
TR: To simulate image sequences at different frame rates, we prepared 10 different TRs, including one at the original frame rate. We selected images at specific frame intervals from the original image sequences (that we called frame-skipped image sequences), and subse-quently generated corresponding image sequences with frame rates of 15, 10, 7.5, 6, 5, 3.75, 3, 2, and 1 fps. Some examples of these normalized silhouette sequences with 30, 10, 6, and 5 fps frame rates are shown in Fig. 2.
View: The image sequences of the OU-ISIR Gait Database, Large Population Dataset are divided into four segments based on the observation azimuth angle, as shown in Fig. 1. We therefore used the image sequences with observation azimuth angles of 55°, 65°, 75°, and 85°, and use the view information as a quality.
3.3 Matching algorithm for score calculation
We calculated matching scores for the gait, head, and height features to construct the score database. We briefly explain the feature extraction and score calculation pro-cesses used here for the gait, head, and height features. Detailed explanations of these processes can be found in [11].
Fig. 2Full period normalized silhouette sequences at various TRs from 85° view. Thetop rowshows normalized silhouette sequences at 30 fps; the second rowshows normalized silhouette sequences at 10 fps; thethird rowshows normalized silhouette sequences at 6 fps; and thebottom row shows normalized silhouette sequences at 5 fps. The silhouette sequences were taken from frame-skipped image sequences that started from the first frame
probe GEIs. The gait-based matching score is calculated using
Sgait= ||Gp−Gg||2, (1)
where|| · ||2is an operator of theL2norm.
Head matching: Many sophisticated face recognition methods have been proposed in the literature, and they generally use the inner region of the face for recognition. However, these methods often cannot achieve reason-able accuracy when the targeted face is extremely small [57, 58]. We therefore used the texture information from the head region, including the inner face region, the hair and the face contour parts in this paper, and call it the head feature of the target subject because our feature differs from the general face feature. Specifically, we have defined the upper region above the neck of a target person as the
head region; this concept is similar to that of [59], which extends the iris feature into a periocular feature.
We calculated the head-based matching score using the following multiple steps. First, we used the silhou-ette image associated with the target image as a mask, and localized the head region. We then extracted the image of the head region and set it as a template for the head feature of the image. We then extracted a template from each frame of the probe image sequences sepa-rately for each quality. Finally, we apply the conventional template matching algorithm using the template to the gallery image sequences, and then calculate a head-based matching score. In contrast, the previously released score database [29] extracted both the template and the gallery image from the original captured image sequences only and not those for all SR qualities, and then downsampled to generate the different SR qualities. For the score calcu-lation process, we use the color texture information. Let
30 10 6 5 3 1 Fig. 4GEIs extracted from fixed size (640×480 pixels) normalized silhouette sequences at various TRs [fps]
Fpi be the template of the head feature associated with theith frame of the probe. LetFgj,k be a masked image of the same size that is associated with thejth frame and the kth spatial displacement within the gallery search regions. We then calculate the head-based matching score using correlation-based template matching using
Shead=min i,j,k
1−fNCC(Fpi,Fgj,k)
. (2)
Here,fNCC(Fpi,Fgj,k)is an operator that is used to calcu-late the normalized cross-correlation (NCC) betweenFpi andFgj,k, and template matching was performed within the region of interest that is defined by the silhouette mask of the gallery.
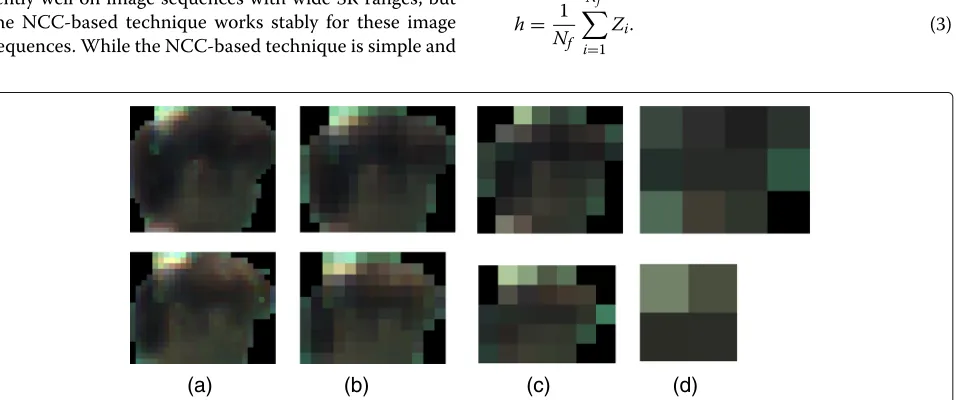
Note here that we did not use the advanced techniques that are associated with face recognition, including the feature extraction process [60], pose normalization [61], and/or face alignment [62]. In this paper, we consider multiple image sequences over a wide SR range, from mid-level SR (see Fig. 5a) to extremely low-level SR (see Fig. 5d); the advanced techniques do not work consis-tently well on image sequences with wide SR ranges, but the NCC-based technique works stably for these image sequences. While the NCC-based technique is simple and
not a state-of-the-art algorithm, its working stability prop-erty is essential for the work in this paper. This is because the same techniques should be used to image sequences with different SR values.
Height matching: Because of the rectification pro-cess and the fact that each subject walked in a straight line at a fixed depth from the calibrated camera, the actual height of each subject in the real 3D world can easily be computed from the apparent height from the image by simply multiplying the ratio of the focal length and the depth from the subject. Note that the actual height was computed in a frame-by-frame manner and the height of the subject can vary with the up-and-down motion caused by walking; we therefore define the height feature as an average of the height values com-puted over the image sequence. LetZi be the computed height from the ith frame of a target image sequence, and let hbe the height feature (scalar). We assume that the target image sequence is composed of Nf pieces of frames and then the height feature can be computed using
h= 1
Nf Nf
i=1
Zi. (3)
(a) (b) (c) (d)
Let hp and hg be the heights of the subjects in the probe and in the gallery, respectively. The height-based matching scoreSheightwas calculated to be
Sheight= |hp−hg|. (4)
3.4 Constructed score database
Because we considered three independent quality measures, we could then set several different quality settings by combining different values of the SR, TR, and view. Using these combinations, we constructed a multi-quality, multi-modal score database.
When we generate image sequences with different TRs by a process of selection of specific frame intervals, mul-tiple image sequences can then be generated from a single image sequence because the selected frames must be dif-ferent and are dependent on the starting frames. For example, we consider two different image sequences with frame rates of 15 fps; an image sequence composed of an odd number of frames and an image sequence composed of an even number of frames can be generated from a sin-gle image sequence with a rate of 30 fps. In this paper, all frame-skipped image sequences that started from differ-ent frames were considered as probes, while only a single frame-skipped image sequence that started from the first frame is considered as the gallery to avoid a quadratic increase in the number of scores. We therefore used 2, 3, 4, 5, 6, 8, 10, 15, and 193frame-skipped image sequences per probe for frame rates of 15, 10, 7.5, 6, 5, 3.75, 3, 2, and 1 fps, respectively. We denote the number of frame-skipped image sequences byNTR.
We then generated features for each of theNTRprobes and galleries separately for each modality, for example, by generating normalized silhouette sequences for eachNTR probe and for the first frame-skipped image sequences for the galleries. The first frame-skipped image sequences for the same subject with different TR are shown in Fig. 2. Finally, we calculated the score matrices for the gait, the head, and the height between 1912NTRprobes and 1912 galleries for all combinations of the SRs (seven variations), the TRs (10 variations) and the views (four variations), which gives a total of 280 different quality settings with the different combinations of the SRs, TRs, and views. It should be noted that the score matrices were calcu-lated between probes and galleries with the same qual-ity values. The constructed score database4includes the matching score distance matrices and the subject ID list along with the quality measures (i.e., the SRs, TRs, and views). As a result, we can draw on NTR score distance matrices with 1912NTR genuine (true match) scores and 1912NTR×1,911 = 3,653,832NTRimposter (false match) scores for each biometric modality and quality, which results in a very large-scale database containing 3,908,128
genuine scores and 7,468,432,608 imposter scores for each modality.
4 Performance evaluation
4.1 Overview
We performed two evaluations of the constructed score database, evaluations of each modality, and evaluations of the score-level fusion. The purpose of the first evalu-ation is to analyze the properties of each modality score against the various quality conditions, and/or the impact of quality on each modality; we therefore evaluated the recognition accuracy for each modality independently for different quality settings. The second evaluation was per-formed to give baseline accuracy for score-level fusion. Because we expect the score database constructed here to be used in score-level fusion research to improve the score-level fusion approaches, the recognition accura-cies when using the benchmark algorithms, including the state-of-the-art algorithms, are useful. For this purpose, we set two different protocols, i.e., quality-independent and quality-dependent protocols, and provide the recog-nition accuracies of the benchmarks under both protocols.
4.2 Accuracy analysis of each modality and impact analysis of each quality
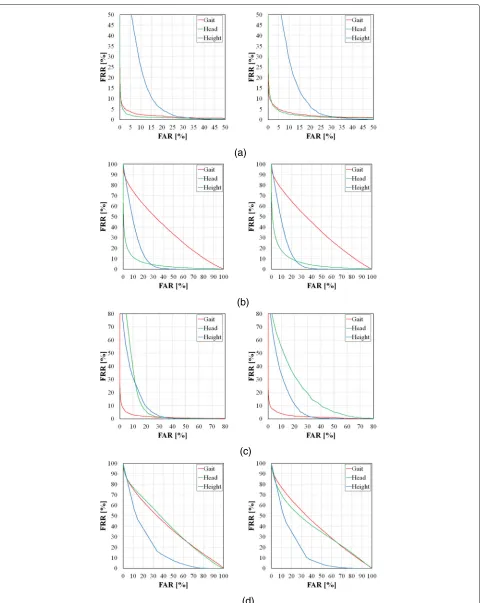
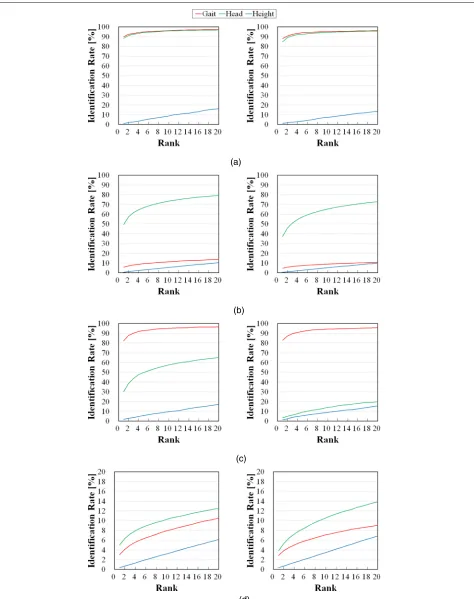
In this section, we analyze the recognition accuracy of each modality under different quality conditions. We eval-uate the recognition accuracy in two different modes: verification and identification. For this purpose, we used the receiver operating characteristic (ROC) curve, which indicates the trade-off between the false rejection rate (FRR) of genuine and the false acceptance rate (FAR) of imposter with varying thresholds for verification and a cumulative matching curve (CMC) for identification. Because of space limitations, we only report the ROC and CMC curves of all modalities under typical settings for the quality considered in Figs. 6 and 7. Additionally, we summarize the equal error rates (EERs) and the Rank-1 identification rates in Table 3 with Fig. 8 and Table 4 with Fig. 9, respectively. We can see that each quality affects the accuracy of each modality.
(a)
(b)
(c)
(d)
(a)
(b)
(c)
(d)
Fig. 8EERs [%] for the individual modalities and qualities. Note that the scales used differ among the graphs
information plays a much more important role than it does in the high TR scenario. The shape information is missing when the SR is low, and this missing informa-tion affects the recogniinforma-tion accuracy directly. In contrast, under low TR conditions, the gait recognition accuracy does not vary much as the SR changes. In this range, the gait feature only provides a low level of information for discrimination, and this information does not decrease as the SR decreases during verification, but some useful information is lost for the identification process.
For the TR, the gait recognition accuracy generally degrades as the TR decreases, but there are some excep-tions. We can see that the Rank-1 identification rate at 6 fps was lower than that at 5 fps and the rate at 3.75 fps was lower than that at 3 fps for the 85° view. This occurred because of temporal aliasing when an image is generated by downsampling from the original image sequences. Specifically, we downsampled the orig-inal image sequences to simulate the image sequences with different frame rates. The gait is an almost bilater-ally symmetrical motion, and thus if we downsample the image sequence of the side view (i.e., 85°) with a specific frame interval, then images with the same stance appear. As shown in Fig. 2, the first, second and third silhouette
images were similar to the fourth, fifth and sixth images, respectively, for the 6 fps image sequences, and therefore the gait information that is included in the GEI at 6fps is smaller than that at 5 fps. This is the cause of the incon-sistency. With regard to the view, large differences cannot be observed, but the recognition accuracy at 55° seems to be slightly worse than that of the other view.
Fig. 9Rank-1 identification rate [%] for individual modalities and qualities. Note that the scales differ among the graphs
factor is that the observed shape of head region is also dif-ferent depending on observation view. The third factor is size of the head region. Because data with different views were captured from a single walking person by a single camera in this data set, distance between the sensor and the subject is different in each view as shown in Fig. 1. And this difference leads to the size difference.
As for height modality, we observe that the accuracy of height is affected by not only SR but also TR. Because the height of the subject is calculated by averaging the height of each frame, and the height of each frame is affected by the posture. In the case of TR is low, the cal-culated height is heavily affected by the postures of the sampled frames, and this can lead to accuracy degrada-tion. As for view quality, the impact of view difference is not so large, because essentially, height is view-invariant feature.
4.3 Evaluation protocols for score-level fusion
Protocol 1: Constructed score databases can be used to develop and evaluate quality-independent score-level fusion approaches. Because our constructed score database contains many subsets with different quality settings, and thus the properties of each subset can be
tion, because it is widely used in research into both multi-modal biometrics and score-level fusion [11]. Specifically, we computed an average μm and a standard deviation σmfor each modalitym ∈ {gait,head,height}among the training set, and computed a normalized scoreS¯mfrom a raw scoreSmas
¯ Sm=
Sm−μm σm
. (5)
Because we intend to perform normalization with respect to the modality, we simply picked a specific qual-ity, i.e.,QHH85, to compute the average and the standard deviation for the normalization process and used these values for the different subsets.
To evaluate the performance, we selected two settings: multi-modal fusion (for gait, head and height) and bi-modal fusion (for gait and head). We then evaluated the accuracy in both verification and identification scenarios with typical measures such as ROC curves, EERs, FRRs at specific FARs, area under curves (AUCs), the half total error rates (HTERs), which is the average of the FAR and the FRR, CMC curves, and rank-nidentification rates for each subset. Here, the HTER is calculated based on [34]. We select an optimal thresholdbased on the concept that the distributions of genuine and imposter accesses are equal and the threshold is set at a value that mini-mizes 12(FAR()+FRR()). We set the threshold using the training dataset.
Protocol 2: A major characteristic of the constructed score database is that this database is composed of multi-modal scores with multiple different qualities. Therefore, this score database is appropriate for evaluation of quality-dependent score-level fusion approaches. This protocol is intended for benchmarking of quality-dependent multi-modal score-level fusion approaches where the score database is disjoint in terms of both subjects and quali-ties, unlike Protocol 1, where the same qualities are shared between the training and test sets. The quality settings for the training and test sets are defined as shown in Table 12. Specifically, we selected three settings for the SRs: “640× 480, 213×160, 128×96, 80×60”, “640×480, 80×60”, and “213×160, 128×96”. For the settings of “640×480, 213×160, 128×96, 80×60”, and “640×480, 80×60”, all test set qualities lie between the training qualities; the dif-ference between these two spatial settings is the density of the quality. For the TRs, we considered four settings: “30, 10, 7.5, 5, 3, 1”, “30, 1”, “10, 7.5, 5, 3”, and “7.5, 5”. For the set-tings of “30, 10, 7.5, 5, 3, 1” and “30, 1”, all test set qualities
protocol, the test sets are composed of scores with differ-ent quality settings. For the evaluation, we do not report on the accuracy of each test set separately, but report on the total accuracy based on merging of the test scores with different quality settings.
4.4 Benchmarks for score-level fusion
Protocol 1: Score-level fusion approaches mainly fall into three generic categories: transformation-based, classification-based, and probability density-based approaches, as described in subsection 2.2. We there-fore provide a total of seven benchmarks based on a wide variety of score-level fusion approaches for Pro-tocol 1. Specifically, we provide the sum rule (Sum) and the minimum rule (Min) for the transformation-based approaches [12]; an SVM with a radial basis function kernel [16] and RankSVM [28] for the classification-based approach; and the GMM6 [15], LLR [14], and KDE [63] for the probability density-based approaches.
(a) (b) (c) (d)
(e) (f) (g) (h)
Fig. 10ROC curves for Protocol 1 (the first cross-validation set) for multi-modal fusion. Note that the scales differ from graph to graph.aQHH85 bQHL85.cQLH85.dQLL85.eQHH55.fQHL55.gQLH55.hQLL55
4.5 Evaluation result for score-level fusion
Protocol 1: The performance evaluation results for Protocol 1 for multi-modal fusion are indicated by the ROC and CMC curves see Figs. 10 and 11. In addition, we selected some typical measures, including the EERs, FRRs
at 1% and the 10% FARs, and the HTERs along with the AUC for the ROC, which are related to verification and are summarized in Tables 5, 6, 7, 8 and 9, and Rank-1 and Rank-5 for the identification are summarized in Table 10 for both the multi-modal and bi-modal fusion types.
(a) (b) (c) (d)
(e) (f) (g) (h)
SVM 1.9 32.9 3.3 47.8 2.9 28.6 7.2 50.2 1.6 18.0 2.7 38.1 2.7 17.3 6.6 41.8
GMM 1.6 10.6 2.6 39.1 2.5 13.5 4.4 37.2 1.5 8.5 2.1 25.6 2.4 10.3 4.2 25.1
LLR 1.7 10.6 2.5 39.8 2.7 13.6 4.4 40.4 1.4 7.3 2.0 25.6 2.2 8.8 3.8 24.0
KDE 1.8 10.8 3.7 39.2 2.7 15.6 5.7 37.3 1.6 8.3 3.6 48.8 2.4 11.7 4.9 44.2
RankSVM 1.7 10.7 2.6 39.8 2.8 13.6 4.5 40.4 1.6 7.0 2.1 25.6 2.7 8.7 4.1 24.1
Bold and italic bold fonts indicate the best and second best accuracies throughout the work in this paper, respectively
From these multi-modal and bi-modal fusion results, we observed that accuracy of multi-modal is better than that of bi-modal in all cases of verification and in majority cases of identification. Moreover, we see that some of the probability density-based methods such as GMM and LLR and classification-based approach such as RankSVM per-form stably and well in verification scenarios (see Fig. 10) because probability density-based approaches guarantee optimality in terms of the ROC [64] on the condition that the estimated probability densities are correct. One inter-esting observation is that the efficiency of the KDE, which is also a probability density-based approach, is unsta-ble and is heavily dependent on the quality settings. The KDE assumes that each score is independent. We there-fore believe that this independent assumption may be a cause of the unstable efficiency. From the viewpoint of the quality settings, we can see that both the SRs and the TRs have major effects on the accuracy of the fusion approaches. In the case of both high SR and high TR (e.g., QHH85), because all the modalities work relatively well, the improvements in accuracy when compared with the Sum as a baseline are not as large (e.g., 1.9% EER for Sum and 1.4% EER for the LLR for multi-modal fusion). In the case of high SR and low TR (e.g., QHL85), because the head modality still works well, while the gait modality does not work because of the low frame rate, the accuracy improve-ment when compared with the Sum is significant. While
the EER of the Sum is 23.0%, the EERs of the RankSVM and the LLR are 7.0 and 7.3%, respectively, for multi-modal fusion. These results indicate the importance of adaptive weighting of the modalities. Similarly, we can see accuracy improvements in the case of low SR with high TR, in which case the head modality does not work but the gait modality still works. Also, the view affects the accu-racy of the fusion approaches. When compared with the EERs of views of 85° and 55° under low SR and low TR conditions for multi-modal fusion, the GMM, LLR and RankSVM achieves better accuracy for the 85° view, but the LLR, and RankSVM achieve better accuracy for the 55° view.
With regard to the identification scenarios (see Fig. 11 and Table 10), the accuracy trend for each benchmark is, however, slightly different from that for the veri-fication scenario, i.e., the RankSVM achieves the best or second best results for all qualities except for the rank-1 identifix cation rate of QLL85 for multi-modal fusion. This point will be discussed in greater depth in the discussion section. We then select the best meth-ods with respect to both verification and identification in the subsequent evaluation of Protocol 2. Specifically, we selected the three best methods, GMM, LLR, and RankSVM, and used them in the following accuracy analysis for the quality-dependent settings, i.e., for Protocol 2.
Table 6FRR [%] at 1% FAR (FRR1%) for Protocol 1
Fusion rule Bi-modal (gait and head) Multi-modal (gait, head, and height)
QHH85 QHL85 QLH85 QLL85 QHH55 QHL55 QLH55 QLL55 QHH85 QHL85 QLH85 QLL85 QHH55 QHL55 QLH55 QLL55
Sum 3.2 82.7 10.3 92 5.5 86.6 11.3 92.4 2.5 78.0 10.4 89.9 4.3 83.2 11.9 90.8
Min 7.4 38.4 12.3 92.9 9.5 51.5 11.8 92.8 7.4 89.9 12.3 92.9 9.5 82.7 11.8 92.8
SVM 2.0 87.5 5.1 95.5 3.6 84.9 10.9 96.6 1.7 74.6 3.8 93.4 3.0 76.3 9.7 95.6
GMM 1.9 36.6 4.7 89.9 3.7 49.7 9.3 90.2 1.8 45.0 3.6 86.0 3.3 53.3 9.3 89.5
LLR 2.2 37.8 4.3 92.2 3.9 51.4 9.4 92.2 1.7 29.1 3.2 88.5 3.5 43.3 8.6 87.7
KDE 2.1 37.1 6.7 90.7 3.9 99.7 10.7 91.6 1.9 26.8 6.9 95.1 3.2 99.0 11.3 92.4
Table 7FRR [%] at 10% FAR (FRR10%) for Protocol 1
Fusion rule Bi-modal (gait and head) Multi-modal (gait, head, and height)
QHH85 QHL85 QLH85 QLL85 QHH55 QHL55 QLH55 QLL55 QHH85 QHL85 QLH85 QLL85 QHH55 QHL55 QLH55 QLL55
Sum 1.0 56.6 2.5 73.3 1.6 64.4 3.7 75.5 0.6 45.9 1.7 65.8 1.3 54.7 2.1 68.0
Min 0.9 11.5 2.2 77.1 1.1 17.9 4.4 70.2 0.9 40.2 2.2 75.4 1.1 32.9 4.4 70.2
SVM 1.6 61.6 2.5 82.5 2.4 54.3 6.3 86.2 1.3 34.2 2.3 75.4 2.3 34.2 6.0 79.3
GMM 0.6 11.0 0.9 69.2 1.1 17.2 2.6 66.2 0.6 6.5 0.9 53.0 0.9 11.6 2.0 52.1
LLR 0.7 11.2 0.9 73.1 1.1 17.4 2.5 74.0 0.5 5.0 0.6 53.5 0.7 7.5 1.9 55.0
KDE 0.9 11.4 2.3 69.3 1.6 24.5 4.1 66.1 0.6 7.1 2.0 82.8 1.2 14.4 3.1 73.9
RankSVM 0.8 11.2 0.9 73.1 1.2 17.5 2.6 74.0 0.5 5.1 0.6 53.5 0.9 7.4 1.9 54.7
Protocol 2: Firstly, we evaluated the accuracies of quality-independent and dependent approaches (e.g., using training Set 1) and drew the ROC and CMC curves as shown in Fig. 12 and summarized the EERs and FRRs at FARs of 1 and 10%, along with the AUCs, HTER and Rank-1 and Rank-5 as shown in Table 11. In the ver-ification scenario, we see that the quality-independent approaches such as Sum, GMM, LLR, and RankSVM do not perform well, with EERs of more than 25%. Con-versely, the quality-dependent approaches, such as LLR (Q-stack) and RankSVM (Q-stack) achieve much higher accuracies than the quality-independent approaches (e.g., the EERs for the LLR stack) and the RankSVM (Q-stack) are 13.0 and 20.9%, respectively), while the EERs of the LLR and RankSVM are 25.8 and 28.8%, respec-tively.) One exception to this trend is GMM (Q-stack). The accuracy of GMM (Q-stack) is worse than that is a quality-independent approach. This exceptionally poor performance by the GMM (Q-stack) is caused by degener-ation of the GMM covariance matrices due to the discrete training qualities used (see Table 12). As a result, the probability density for the test quality, which is different to the training quality, becomes zero for both positives and negatives, and the fused score therefore loses its discrimination capability.
As identification scenario, we can see that independent approach works better than quality-dependent approach in general. This results can be
related to the evaluation settings. In this paper, although biometric data with multiple qualities were prepared, cross-quality matching were not considered, in other words, qualities of probe gait feature are always the same as those of gallery gait features. Under this setting, quality information given by Q-stack cannot be useful in identification, because all gallery gait features matched to a probe gait features have the same quality measures. Therefore, we cannot improve identification accuracy by only employing Q-stack under this setting. This implies that the additional quality-dependent approaches are expected to improve the identification accuracy in the scenario where the qualities of the probe and the gallery are the same.
Second, we evaluated the quality-dependent fusion per-formance when using different training sets to analyze how the performance varied. For this purpose, we selected the best approach LLR (Q-stack) for Set 1 to act as a benchmark. Figure 13 shows the ROC and CMC curves and the EERs and FRRs at FARs of 1 and 10%, along with the AUCs, the HTER, and Rank-1 and Rank-5, as shown in Table 13.
From these results, we can obtain some interesting observations. In cases where we fix the TR quality setting for training, SR quality setting for training does not have much impact on accuracy for both verification and identi-fication. For example, the EERs of Set 1, Set 5, and Set 9 are 13.0, 13.1, and 12.9%, respectively, and Rank-1 of Set 1, Set
Table 8AUC [%] for Protocol 1
Fusion rule Bi-modal (gait and head) Multi-modal (gait, head, and height)
QHH85 QHL85 QLH85 QLL85 QHH55 QHL55 QLH55 QLL55 QHH85 QHL85 QLH85 QLL85 QHH55 QHL55 QLH55 QLL55
Sum 0.5 20.1 1.1 35.6 0.7 25.2 1.5 37.3 0.3 13.9 0.8 27.0 0.4 17.7 0.9 27.8
Min 0.6 4.6 0.9 39.6 0.7 6.7 1.5 36.8 0.5 9.7 0.9 24.5 0.6 8.4 1.5 29.6
SVM 0.8 26.6 1.0 46.5 1.4 22.4 3.4 50.0 0.8 10.5 0.8 32.4 1.3 9.6 3.1 38.4
GMM 0.3 4.5 0.6 33.7 0.5 6.4 1.1 32.1 0.3 3.1 0.4 16.6 0.3 4.3 0.8 15.9
LLR 0.3 4.5 0.4 35.0 0.5 6.6 1.0 36.1 0.2 2.2 0.3 17.3 0.3 3.2 0.7 15.8
KDE 0.3 4.8 0.7 33.9 0.6 10.6 1.6 32.3 0.3 2.8 0.7 48.9 0.5 7.6 1.1 41.6
SVM 1.5 32.8 2.8 45.1 2.3 28.4 5.2 46.5 1.3 17.2 2.2 37.2 2.0 16.3 4.9 40.0
GMM 1.5 10.5 2.5 38.5 2.3 13.5 4.3 36.3 1.4 8.1 2.1 24.4 2.2 9.7 4.1 23.6
LLR 1.6 10.6 2.5 39.6 2.5 13.6 4.3 40.0 1.4 7.3 2.0 24.9 2.3 8.8 3.7 23.1
KDE 1.5 10.7 3.4 38.5 2.5 15.6 5.2 36.4 1.4 8.2 3.5 50.0 2.2 11.7 4.8 50.0
RankSVM 1.6 10.6 2.6 39.6 2.6 13.7 4.5 40.0 1.5 7.0 2.2 25.0 2.5 8.7 4.1 23.2
5, and Set 9 are 31.1, 32.2, and 29.5%, respectively. In cases where we fix the SR quality setting for training, TR qual-ity setting for training have much impact on recognition accuracy, and impact on verification and identification are different. For verification, in cases where test TR qualities lie between the training TR qualities, the EERs of Set 1 and Set 2 are both 13.0%, and the EERs of Set 9 and Set 10 are almost the same (i.e., 12.9 and 13.0%) even though the densities of TR training qualities are different; but in cases where some test TR qualities lie outside the training qualities, verification accuracy become worse. For exam-ple, the EERs of Set 4 and Set 12 are 15.8 and 15.2%, respectively. On the other hand, for identification, in case where TR qualities of “7.5 and 5” are used for training, we observed that Rank-1 becomes good even though some test TR qualities lie outside the training TR qualities. As discussed in the first experiment of Protocol 2, this may
be related to the evaluation settings where the qualities of the gallery and the probe are the same. But we guess that some specific fusion parameters may work well on many quality settings for identification.
5 Discussion and future work
Inconsistency between verification and identification scenarios: As written in the section on the evaluation results for score-level fusion, the benchmark performance is dependent on the specific verification or identification scenario. Since Nandakumar et al. [65] proposed a method to extend the fusion for the verification scenario (i.e., using a likelihood ratio-based approach) into that for the identification scenario, it may be expected that the best benchmark for the verification will also achieve the high-est accuracy in the identification scenario. Their method [65] imposes the strong assumption that the genuine and
Table 10Rank-1/5 identification rates for Protocol 1
Bi-modal (gait and head) Multi-modal (gait, head, and height)
Fusion rule Rank-1[%]
QHH85 QHL85 QLH85 QLL85 QHH55 QHL55 QLH55 QLL55 QHH85 QHL85 QLH85 QLL85 QHH55 QHL55 QLH55 QLL55
Sum 96.3 14.3 88.0 4.1 94.9 9.2 86.6 4.0 97.2 17.5 85.4 4.8 96.1 11.7 82.3 4.7
Min 91.8 54.9 85.0 6.0 90.7 43.6 84.3 5.0 91.7 5.4 85.0 5.9 90.7 12.1 84.3 5.0
SVM 96.8 10.1 90.9 2.2 95.4 10.0 84.7 1.5 97.3 16.0 91.3 3.4 96.1 14.0 85.4 1.7
GMM 97.2 54.5 91.0 5.8 96.2 41.4 87.4 5.3 97.0 41.3 90.3 5.0 96.3 30.9 84.6 4.1
LLR 97.2 53.0 92.5 3.9 96.4 40.5 88.8 4.0 97.7 52.8 91.4 5.2 96.8 39.1 86.8 5.2
KDE 96.5 51.3 88.1 5.3 94.9 15.9 84.1 4.1 97.1 58.1 86.5 2.0 95.8 20.4 82.5 2.8
RankSVM 97.2 52.8 92.6 4.0 96.2 39.7 88.7 4.0 97.7 56.2 91.6 5.1 96.5 42.4 87.4 5.1
Rank-5[%]
Sum 98.2 22.2 95.8 8.3 97.5 14.7 94.1 7.7 98.9 28.0 94.3 10.6 98.4 19.3 93.5 10.2
Min 96.6 72.9 93.2 10.2 96.0 64.8 91.0 10.4 96.4 9.9 93.2 9.9 96.0 17.2 91.0 10.4
SVM 97.9 17.2 95.4 4.5 97.0 18.9 90.5 3.1 98.4 29.4 96.0 7.1 97.1 26.8 91.9 3.8
GMM 98.7 72.7 96.1 11.6 98.1 63.6 94.0 11.3 98.6 58.5 96.1 12.1 98.3 50.0 94.0 10.9
LLR 98.7 71.1 97.0 8.1 98.1 61.4 95.1 8.0 99.1 73.1 97.1 10.5 98.9 62.0 95.8 12.1
KDE 97.9 70.5 93.1 10.9 96.7 35.6 90.5 9.9 98.2 77.2 92.9 4.4 97.1 42.4 90.7 6.8
Fig. 12ROC (left) and CMC (right) curves for the quality-independent and quality-dependent approaches for Protocol 2
imposter scores are drawn from the same distribution, regardless of the subjects. However, subject dependence of the score distribution has been observed in our score database, and good benchmarks are therefore shown not to be consistent among the verification and identification scenarios on our score database. In fact, a recent study [66] performed a preliminary experiment to demonstrate that a low-performance verification system may still achieve good performance in an identification scenario. Addition-ally, DeCann and Ross demonstrated in [43] that sets of genuine and imposter scores that generate the same ROC curve can generate different CMC curves. This is because the verification performance is dependent on the aggre-gated distributions of the genuine and imposter scores, while the identification scenario is dependent on probe-dependent ranking statistics. Suitable approaches for the verification and identification scenarios can be different in principle. It was also reported in [43] that this type of difference between the ROC and CMC curves tends to be particularly outstanding for soft biometrics such as gait. It is therefore convincing in this case that the different benchmarks yielded higher accuracies for each of the verification and identification scenarios. Specifically, the probability density-based approaches consider the aggregated score distributions directly and thus yielded
higher accuracies for verification. In contrast, because the RankSVM considers the probe-dependent rank statistics directly, it yielded the best or second best accuracies for the identification scenarios for multi-modal fusion, which is consistent with the discussion above.
Multiple algorithms: While we considered multiple scores that were derived from multi-modal biometrics and provided a single matcher for each modality in this work, it is also possible to introduce multiple scores that are derived from multiple matchers, as per the existing bio-metric score database NIST-Multimodal [37], which con-tains scores that are derived from multiple face matchers. From a quality-dependent score-level fusion viewpoint, it is particularly interesting to introduce matchers with different sensitivities into the quality measures that were used in this paper (i.e., SR and TR). For example, gait fea-ture representations that are encoded with more temporal and/or motion information (e.g., [67, 68] may be sensi-tive to TR variations (i.e., yielding higher accuracies for higher TRs), while those that are encoded with more static (shape) information (e.g., [69]) may be insensitive to the TR.
Additionally, we can improve the sensitivity to both the SR and the TR by incorporating spatial and/or temporal super-resolution techniques [23]. In fact,
Table 11EER, FRR1%,FRR10%, AUC, HTER and Rank-1/5 identification rates of quality-independent and quality-dependent approaches
for Protocol 2
Fusion rule Training set EER [%] FRR1%[%] FRR10%[%] AUC [%] HTER [%] Rank-1 [%] Rank-5 [%]
Sum
QHH85
33.2 74.5 50.4 23.3 41.2 38.5 50.6
GMM 26.4 76.4 40.1 19.5 32.5 26.0 38.7
LLR 25.8 71.1 43.5 16.8 34.2 41.8 56.1
RankSVM 28.8 72.2 46.1 18.4 37.2 40.9 54.4
GMM (Q-stack)
Set 1
49.9 99.0 89.9 49.9 49.9 0.1 0.5
LLR (Q-stack) 13.0 69.8 18.9 5.5 12.5 31.1 48.1
RankSVM (Q-stack) 20.9 68.4 37.4 11.0 26.1 38.7 54.6
Training 85, 55 Set 4 640×480, 213×160, 128×96, 80×60 7.5, 5
Set 5 640×480, 80×60 30, 10, 7.5, 5, 3, 1
Set 6 640×480, 80×60 30, 1
Set 7 640×480, 80×60 10, 7.5, 5, 3
Set 8 640×480, 80×60 7.5, 5
Set 9 213×160, 128×96 30, 10, 7.5, 5, 3, 1
Set 10 213×160, 128×96 30, 1
Set 11 213×160, 128×96 10, 7.5, 5, 3
Set 12 213×160, 128×96 7.5, 5
Test 320×240, 160×120, 106×80 15, 6, 3.75, 2 75, 65
spatially super-resoluted face images are used to fuse gait with side-view face in [70]. Construction of an advanced multi-modal biometric score database that includes both multiple matchers and super-resolution techniques would therefore be an interesting future research direction.
Extension to real scenes: In addition, while we treat the SR and TR as quality measures in the context of the fusion of gait, head, and height biometrics, there are even more qualities that can be considered in real situations. In particular, because our biometric score database was built upon the OU-ISIR Gait Database, Large Population Dataset [27], which was collected in a relatively controlled situation (e.g., indoors, with controlled illumination and a predefined course) with a limited observation view, we must consider the variety of covariate factors that may well arise in a real situation. For example, background motion artifacts that are caused by trees or additional persons may degrade the silhouette qualities that are required for gait biometrics, and illumination changes
caused by cloud cover could dramatically change head textures. It would therefore be useful to collect biometric scores in real situations while using additional quality measures (e.g., illumination changes, view changes, clothing, and silhouette qualities) to achieve a more sophisticated fusion approach. This will required not only data collection but also generation of algorithms to measure the associated quality, specifically sample-based quality. This will also be included in our future research. We guess that Q-stack based quality-dependent fusion can improve accuracy even for identification if we employ sample-based quality measures, because the qualities of the probe and the gallery are not always the same. Because fusion of a high-dimensional Q-stack vector containing a plethora of multi-modal multi-matcher bio-metric scores along with the quality measures described above represents a more challenging task, it is also essential to add a benchmark for the score-level fusion that incorporates dimensional reduction of the quality measures as a preprocessing step (e.g., [71]) to avoid both
Table 13EER, FRR1%, FRR10%, AUC, HTER and Rank-1/5 identification rates of the quality-dependent approach using the different
training sets for Protocol 2
Fusion rule Training set EER [%] FRR1%[%] FRR10%[%] AUC [%] HTER [%] Rank-1 [%] Rank-5 [%]
LLR (Q-stack)
Set 1 13.0 69.8 18.9 5.5 12.5 31.1 48.1
Set 2 13.0 73.9 19.3 5.7 14.6 29.1 45.8
Set 3 13.8 53.7 18.2 5.9 15.7 40.2 55.9
Set 4 15.8 50.6 21.8 7.3 19.2 41.7 56.7
Set 5 13.1 69.2 18.9 5.5 12.6 32.2 49.3
Set 6 13.3 74.3 19.7 5.8 13.5 30.0 47.0
Set 7 14.1 52.2 18.6 6.1 16.6 41.2 56.9
Set 8 16.2 49.3 22.4 7.7 20.3 42.3 57.5
Set 9 12.9 69.3 18.8 5.4 12.4 29.5 46.3
Set 10 13.0 73.6 19.0 5.7 14.0 27.5 43.6
Set 11 13.4 53.6 17.7 5.6 15.0 39.3 55.1
Set 12 15.2 50.9 20.8 6.9 18.0 41.1 56.2
FRR1%and FRR10%are FRR at 1% FAR and FRR at 10% FAR respectively
the risk of overfitting and the curse of dimensionality problem.
6 Conclusion
We constructed a single sensor-based multi-quality multi-modal biometric score database. We focused on the OU-ISIR Gait Database, Large Population Dataset. We extracted the required gait, head, and height biometrics from a single walking image sequence. We considered the SR, the TR, and the view as quality measures. As a result, the database contains an extremely large number of bio-metric scores: approximately 4 million genuine scores and 7.5 billion imposter scores for a total of 280 combinations of SRs, TRs, and views. We defined two protocols for quality-independent and quality-dependent score-level fusion, and also provided performance evaluation results with several benchmarks for each protocol, which will advance the research into quality-dependent score-level fusion. The constructed score database has been opened to the research community with the benchmark results. We therefore believe that the constructed score database with its benchmark results will be highly beneficial for biometric researchers because score-level fusion is a promising technique for improvement of the recognition accuracy.
Endnotes
1The database and evaluation protocol settings
is available at http://www.am.sanken.osaka-u.ac.jp/ BiometricDB/BioScore.html.
2Because the distance from the camera to the
sub-ject is sufficiently large when compared with the subsub-ject size, the assumption of weak perspective projection with respect to the subject can be almost true, and we can thus
simulate image sequences of the same subjects at different distances.
3While 30 frame-skipped image sequences can be
generated from 1 fps downsampling of an original 30 fps video in principle, only 19 frame-skipped image sequences are used. Because the minimum number of frames, including one gait image sequences of some sub-jects, is only 19, we maintain consistency among all subjects by limiting the number to 19.
4Matching score distance matrices for each
modal-ity and qualmodal-ity setting will be published separately in comma-separated values (CSV) format, where the rows and columns correspond to the probes and the galleries, respectively.
5Note that score normalization does not essentially
affect the performance for training-based approaches (with the exceptions of Sum and Min) because any dif-ferences in the score scales are absorbed in the training process.
6The number of the mixture component are
deter-mined to be between 1 and 20 to optimize the minimum description length criterion, and the random selection process of the initial seeds is repeated 10 times for each number of mixture components to mitigate the effects of randomness.
Acknowledgements
Competing interests
The authors declare that they have no competing interests.
Publisher’s Note
Springer Nature remains neutral with regard to jurisdictional claims in published maps and institutional affiliations.
Received: 31 December 2016 Accepted: 21 June 2017
References
1. Jain AK, Ross A, Pankanti S (2006) Biometrics: a tool for information security. IEEE Trans Inf Forensics Secur 1(2):125–143
2. Bouchrika I, Goffredo M, Carter J, Nixon M (2011) On using gait in forensic biometrics. J Forensic Sci 56(4):882–889
3. Iwama H, Muramatsu D, Makihara Y, Yagi Y (2013) Gait verification system for criminal investigation. IPSJ Trans Comput Vis Appl 5:163–175 4. Jain AK, Ross A (2004) Multibiometric systems. Commun ACM
47(1):34–40. doi:10.1145/962081.962102
5. Ross AA, Nandakumar K, Jain AK (2006) Handbook of Multibiometrics. Int. Series on Biometrics. Springer-Verlag New York, Inc., Secaucus
6. Besbes F, Trichili H, Solaiman B (2008) Multimodal biometric system based on fingerprint identification and iris recognition. In: Proc. of the 3rd International Conference on Information and Communication Technologies: From Theory to Applications (ICTTA 2008). IEEE, Damascus. pp 1–5
7. Fierrez-Aguilar J, Ortega-Garcia J, Gonzalez-Rodriguez J, Bigun J (2005b) Discriminative multimodal biometric authentication based on quality measures. Pattern Recog 38(5):777–779
8. Jillela R, Ross A (2012) Mitigating effects of plastic surgery: Fusing face and ocular biometrics. In: Proc. of the 5th IEEE International Conference on Biometrics: Theory, Applications and Systems (BTAS 2012). pp 402–411. doi:10.1109/BTAS.2012.6374607
9. Hofmann M, Schmidt SM, Rajagopalan A, Rigoll G (2012) Combined face and gait recognition using alpha matte preprocessing. In: Proc. of the 5th IAPR International Conference on Biometrics. IEEE, New Delhi, India. pp 1–8
10. Zhou X, Bhanu B (2008) Feature fusion of side face and gait for video-based human identification. Pattern Recog 41(3):778–795 11. Muramatsu D, Iwama H, Makihara Y, Yagi Y (2013) Multi-view multi-modal
person authentication from a single walking image sequence. In: Proc. of the International Conference on Biometrics. pp 1–8.
doi:10.1109/ICB.2013.6612979
12. Kittler J, Hatef M, Duin RPW, Matas J (1998) On combining classifiers. IEEE Trans Pattern Anal Mach Intell 20(3):226–239
13. Dass SC, Nandakumar K, Jain AK (2005) A principled approach to score level fusion in multimodal biometric systems. In: Proc. of the Audio and Video based Biometric Person Authentication. Springer Berlin Heidelberg, NY. pp 1049–1058
14. Alonso-Fernandez F, Fierrez J, Ramos D, Ortega-Garcia J (2007) Dealing with sensor interoperability in multi-biometrics: the upm experience at the biosecure multimodal evaluation. In: Proc. of the SPIE Defense and Security Symposium, Biometric Technologies for Human Identification. BTHI, vol 6944. SPIE, Orlando, FL, USA
15. Nandakumar K, Chen Y, Dass SC, Jain AK (2008) Likelihood ratio-based biometric score fusion. IEEE Trans Pattern Anal Mach Intell 30(2):342–347 16. He M, Horng SJ, Fan P, Run RS, Chen RJ, Lai JL, Khan M, Sentosa KO (2010)
Performance evaluation of score level fusion in multimodal biometric systems. Pattern Recogn 43(5):1789–1800
17. Makihara Y, Muramatsu D, Hossain M, Iwama H, Ngo T, Yagi Y (2014) Score-level fusion by generalized delaunay triangulation. Proc of the 2nd International Joint Conference on Biometrics. IEEE, Clearwater
algorithms. Pattern Recogn 43(3):1094–1105
21. Harriero A, Ramos D, Gonzalez-Rodriguez J, Fierrez J (2009) Analysis of the utility of classical and novel speech quality measures for speaker verification. In: Tistarelli M, Nixon MS (eds). ICB 2009. LNCS, vol 5558. Springer, Heidelberg. pp 434–442
22. Muramatsu D, Shiraishi A, Makihara Y, Uddin M, Yagi Y (2015) Gait-based person recognition using arbitrary view transformation model. IEEE Trans Image Proc 24(1):140–154
23. Akae N, Mansur A, Makihara Y, Yagi Y (2012) Video from nearly still: an application to low frame-rate gait recognition. In: Proc. of the IEEE Conference on Computer Vision and Pattern Recognition (CVPR). IEEE, Providence. pp 1537–1543
24. Kimura T, Makihara Y, Muramatsu D, Yagi Y (2014) Quality-dependent score-level fusion of face, gait, and the height biometrics. IPSJ Trans Comput Vis Appl 6:543–547
25. Toh K, Yau W, Lim E, Chen L, Ng C (2004) Fusion of auxiliary information for multi-modal biometrics authentication. In: Zhang D, Jain AK (eds). ICBA 2004. LNCS, vol 3072. Springer, Heidelberg. pp 678–685 26. Zhou X, Bhanu B (2006) Feature fusion of face and gait for human
recognition at a distance in video. In: Proc. of the 18th International Conference on Pattern Recognition, vol 4. Hong Kong, China. IEEE. pp 529–532
27. Iwama H, Okumura M, Makihara Y, Yagi Y (2012) The OU-ISIR gait database comprising the large population dataset and performance evaluation of gait recognition. IEEE Trans Inf Forensics Secur 7(5):1511–1521 28. Chapelle O, Keerthi SS (2010) Efficient algorithms for ranking with SVMs.
Inf Retr 13(3):201–215
29. Kimura T, Makihara Y, Muramatsu D, Yagi Y (2015) Single sensor-based multi-quality multi-modal biometric score database and its performance evaluation. In: Proc. of the International Conference on Biometrics. IEEE, Phuket. pp 1–8
30. Jain AK, Nandakumar K, Ross A (2005) Score normalization in multimodal biometric systems. Pattern Recogn 38(12):2117–2127
31. Poh N, Bengio S (2005a) Can chimeric persons be used in multimodal biometric authentication experiments? In: Renals S, Bengio S (eds). MLMI 2005. LNCS, vol 3869. Springer, Heidelberg. pp 87–100
32. Wayman JL (2006) A path forward for multi-biometrics. In: Proc. of the IEEE International Conference on Acoustics Speech and Signal Processing Proceedings. IEEE, Toulouse. pp 1069–1072
33. Ortega-Garcia J, Fiérrez J, Alonso-Fernandez F, Galbally J, Freire MR, Gonzalez-Rodriguez J, García-Mateo C, Alba-Castro JL, González-Agulla E, Muras EO, Garcia-Salicetti S, Allano L, Ly VB, Dorizzi B, Kittler J, Bourlai T, Poh N, Deravi F, Ng MWR, Fairhurst MC, Hennebert J, Humm A, Tistarelli M, Brodo L, Richiardi J, Drygajlo A, Ganster H, Sukno F, Pavani SK, Frangi AF, Akarun L, Savran A (2010) The multiscenario multienvironment biosecure multimodal database (BMDB). IEEE Trans Pattern Anal Mach Intell 32(6):1097–1111
34. Poh N, Bengio S (2006) Database, protocols and tools for evaluating score-level fusion algorithms in biometric authentication. Pattern Recogn 39(2):223–233
35. Messer K, Matas J, Kittler J, Lüttin J, Maitre G (1999) XM2VTSDB: The Extended M2VTS Database. In: Second international conference on audio and video-based biometric person authentication, Washington, D.C. pp 72–77
36. The banca score database. http://personal.ee.surrey.ac.uk/Personal/ Norman.Poh/web/banca_multi. Accessed 15 Dec 2016
37. NIST biometric scores set. http://www.itl.nist.gov/iad/894.03/ biometricscores/l. This database used to be available on website but currently it is unavailable
![Table 3 EERs [%] for individual modalities and qualities](https://thumb-us.123doks.com/thumbv2/123dok_us/844768.1582190/12.595.69.529.90.738/table-eers-individual-modalities-qualities.webp)
![Fig. 8 EERs [%] for the individual modalities and qualities. Note that the scales used differ among the graphs](https://thumb-us.123doks.com/thumbv2/123dok_us/844768.1582190/13.595.57.542.86.395/eers-individual-modalities-qualities-note-scales-differ-graphs.webp)