The Influence of Leadership Style and Organizational Climate on Employee Performance through Organizational Commitment on Perum Pegadaian Branch East Bekasi
Praditya Budi Kristianto Student Master of Management Krisnadwipayana University Jakarta
Campus UNKRIS Jatiwaringin P.O. Box 7774/Jat CM. Jakarta 13077
Email: pradityabudi.film@gmail.com Indonesia
Abdul Rivai Associate Professor Faculty of Economics Krisnadwipayana University Jakarta
Campus UNKRIS Jatiwaringin P.O. Box 7774/Jat CM. Jakarta 13077
Indonesia
Suharto Associate Professor Faculty of Economics Krisnadwipayana University Jakarta
Campus UNKRIS Jatiwaringin P.O. Box 7774/Jat CM. Jakarta 13077
Indonesia
Abstract
This study aims to analyze the influence of leadership style and organizational climate on employee performance, analyze the influence of leadership style and organizational climate on organizational commitment, analyze the influence of organizational commitment to employee performance, analyze the influence of indirect leadership style through organizational commitment to employee performance and analyze influence direct organizational climate through organizational commitment to employee performance. The research was conducted at Perum Pegadaian Branch East Bekasi involving 40 employees. Sampling research using probability sampling method and simple random sampling. Data analysis using path analysis.
Based on data analysis known that there is a direct influence of leadership style on employee performance and direct influence of organizational climate on employee performance at Perum Pegadaian Branch East Bekasi. The result of organizational commitment variable analysis as an intervening variable can be proved perfectly that organizational commitment variable gives indirect influence on leadership style variable to employee performance and organizational climate variable to employee performance. This statement can be evidenced by the large indirect influence of leadership style on employee performance and organizational climate on employee performance through organizational commitment identified as an intervening variable.
Keywords: Leadership style, organizational climate, organizational commitment and employee performance.
INTRODUCTION
The need for a company of skilled labor in a variety of fields is a global demand that cannot be postponed. In the current competition is required more aware that human resources in a company are required to have the ability to create a quality human resource development plan. So that one day the company can win market share in the middle of a tight competition era. A capable and skilled human resource can support a company competing on a free market.
Improvement of the company's internal condition through human resources aims to strengthen and enhance the existence of companies in the face of local and global competition that will be more stringent. This means the company must improve the performance of the company by improving the performance of its employees. The development of the company cannot be separated from the role of each of the human resources in it. Internal and external factors are key factors in realizing the achievement of the company's vision, mission, and objectives. Both factors must be managed in a balanced manner in accordance with the demands of existing needs, given the demands of each company is not the same? Therefore it takes strategy and special tips, especially on human resources owned. Good human resource management will have an impact on increasing employee morale and in turn, will improve the work as predetermined. In the implementation of managing human resources is not absolutely refers to the science of human resource management but the role of the art of human resource management is also urgently needed to maximize the role and function of human resources in an organization or company.
Therefore, company management must be keen in managing its employees in order to carry out their duties and responsibilities in accordance with the given company. The application of leadership style model is a supporting factor in the success of employees to achieve their goals. Applying a good leadership style model will benefit both the company and the employees themselves. The role of a leader in advancing the company and its employees can be seen from how what has been established and targeted company can be achieved through the work of its employees. In addition, the application of leadership style models can also shape the corporate or organizational climate. The organizational climate defined by Lussier (2005: 486) says that the organizational climate is the
perception of employees about the quality of the internal environment of the organization that is relatively perceived by members of the organization which will then affect employee behavior.
Research Respatiningsih and Sudirjo (2015) suggests that the organization's commitment to employee performance. Organizational commitment to the research is measured through affective Commitment, Continuity Commitment, and Normative Commitment. The concept of organizational commitment is defined by Robbins and Coulter (2010: 40) organizational commitment is the degree to which an employee identifies him with a particular organization and its objectives and wishes to maintain its membership within the organization. Employee involvement in a company is not only limited to the administrative contract work but the company through the leadership must be able to create an employee convenience in carrying out its work and will eventually give birth to an employee loyalty to the leadership and company.
LITERATURE REVIEW
Leadership
Before discussing more leadership style first explain the leadership and leadership. The word "lead" according to Wahjosumidjo (2010: 104) means giving guidance, guiding, directing, and walking in front (precede). Leaders behave to help companies with maximum ability to achieve goals Leaders do not stand alone on the side, but they give encouragement and spur (to prod), standing in front that provides ease to progress and inspires the company to achieve goals.
According to Achmad Suyuti is meant by the leadership is the process of directing, guiding, and influencing the thoughts, feelings, actions, and behaviour of others to be moved towards a particular goal (Suyuti, 2001: 7). Another opinion states that leadership is the activity of influencing and directing the behaviour of subordinates or others to achieve corporate or group goals (Kartono, 2000: 39). Meanwhile, according to Asmara, leadership is the behaviour to influence others so that they provide cooperation in achieving goals that they consider necessary and useful (Asmara, 2001: 17).
to influence people to do something in order to achieve certain goals.
According to Rivai (2004:2) states that "Leadership is the process of influencing or giving examples to his followers through the communication process in an effort to achieve corporate goals. Meanwhile, according to Arep and Tanjung (2003:93) states that "leadership is a person's ability to master to influence other people or different communities to a certain achievement.
Leadership Style
According Wirawan (2003: 80) definition of leadership style is the pattern of behavior in influencing his followers. The leadership style of a leader can vary depending on the followers and the situation.
Meanwhile, according to Heidjrachman and Husnan leadership style is a behavioral pattern designed to integrate organizational goals with individual goals to achieve certain goals (Heidjrachman and Husnan, 2002: 224). Tjiptono defines the style of leadership is a way that leaders use in interacting with their subordinates (Tjiptono, 2001: 161). Others say that leadership style is the behavioral pattern (words and actions) of a leader felt by others (Hersey, 2004: 29).
The dimensions used to refer to the measurement dimensions proposed by Ralph and Lippit (2000: 26-27) are as follows:
1. Level of communication between leader and subordinate
2. The level of confidence of the leader in delegating authority duties and authority to subordinates.
3. Level of leadership willingness to provide guidance and direction to subordinates.
4. Level of creativity of leadership in creating a good working environment.
Climate Organization
Lussier (2005: 486) says that organizational climate is the perception of employees about the quality of the internal environment of the organization that is relatively perceived by members of the organization will then affects one's behavior. According to Simamora (2004: 81) organizational climate is the internal environment or organizational psychology. Organizational climate affects HR practices and policies received by members of the organization. Keep in mind that every organization will have a different organizational climate. The diversity of work designed within the
organization or the nature of the individual that will describe the difference. Based on the above definition it can be concluded that the organizational climate is the internal environment that can affect the behavior of members of the organization in carrying out its work. Based on the above definition, in this study
organizational climate is defined as the employee's perception of the quality of the internal environment of the organization so that it will affect the behavior of employees in carrying out the given task. A good organizational climate will encourage employees to continue improving their work.
Stringer cited by Wirawan (2007:134) the climate of an organization refers to the functioning of the organization as a whole from the employee's point of view that can be measured through the following aspects:
1. Organizational policies and regulations.
Organizational policies and regulations that are more concerned with work convenience and employee benefits will result in increased productivity so that employees are more eager to work. For example, in a study developed by Mayo in 1927, proving their conjecture that the organization's policy to add electric lighting at production sites would spur productivity. This is because employees feel the organization is more concerned about work convenience and employee welfare so they are more enthusiastic about working. A conducive working climate will have a profound positive effect on the spirit and work result. 2. Level of communication effectiveness
Communication is very important in all management activities especially "in the organization, because with the communication of an organization can issue or convey ideas as well as ideas and exchange information. According to Suratno (2006: 1), Effective Communication is one of the factors to support the improvement of organizational performance. Effective communications and company performance levels are positively and significantly related.
Improving organizational communication means improving organizational performance. Therefore, communication must include the delivery and understanding of a communication meaning (Robbins, 2008: 146).
According to Schein (2001), this employee relationship concerns the views of employees about what is seen as the right way for employees to connect, to distribute power or love? Is life co-operative or competitive; individualistic, collaborative group? A good level of relationship between the leadership with its employees and between fellow employees can improve the performance of company employees as much as possible. One example of how important the level of relationship between employees is that President Director of Giant Food's Co., Izzy Cohen, always treats every employee, from the vice president director to the lowest employee, as an equal partner. Cohen is much more concerned with relationships between fellow workers than the work itself. According to Cohen, a good and harmonious relationship between fellow workers is the most important thing. Moreover, Cohen believes that if the relationships between all employees and corporate leaders have been well established, then the maximum work result by itself is created. In the end, Cohen really succeeded in creating a positive climate to support the implementation of the task. The employees really feel as the owner of the company. By feeling belonging, they are always encouraged to do their best.
4. Leadership participation level
According to Asa'd (2004:112), the relationship between employees with superiors is very important in creating an organizational climate. Organizational climate can be enhanced through the attention and good relationships of the leadership to subordinates so that employees will feel that they are an important part of the organization of work (sense of belonging). Effective managers will use participatory approaches in planning, influencing change, or solving problems will usually find influential employees and communicate to them fully the problems, needs, and goals of the organization.
Organizational Commitment
Robbins and Judge, (2008: 100-101) define that organizational commitment is a situation in which employee sides with a particular organization and its goals and intentions to maintain membership within the organization. The realization of a conducive situation when employees and organizations have the same synergy in achieving goal orientation, striving to achieve the
targets set is a must when an employee takes sides with the organization. Organizational commitment is needed in this regard.
According to Robins and Coulter (2010:40) organizational commitment is "the degree to which an employee identifies himself with a particular organization and its purpose and wishes to maintain its membership within the organization." Meanwhile, according to Mathis and Jackson (2006:122), organizational commitment is the degree to which employees are confident and accept the goals of the organization and wish to stay with the organization.
The organization does not have to dictate all the work to its employees because the employees will not work independently vigorously if the supervision is too strictly controlled by the management and placed in a narrow-minded work and treated as a useless person. Commitment-based organizations will design work more widely than ever to integrate planning and implementation, and improve operations, not just maintain existing ones.
Dessler's research (2006: 58) shows that highly committed employees have longer turn over times and tend to work harder and show better performance.
The high commitment of employees mentioned above cannot be separated from the confidence of employees will be good management of them, that is the management approach to human resources as a valuable asset and not merely as a commodity that can be exploited at will management.
In many organizations, inconsistencies between speech and deeds will undermine trust, generate cynicism from employees and will prove that management's sayings are not in line with their deeds.
Dimensions of organizational commitment by Robbins and Judge (2008: 101) among others
1. Affective commitment
As an emotional feeling for organization and belief in the values of the organization,
2. Ongoing commitment
The economic value that is felt when staying with the organization when compared to leaving the organization,
3. Normative commitment
Commitment to staying with the organization for moral or ethical reasons.
Riniwati (2011: 50) states that the real foundation of a company is performing. If there is no performance, then all parts of the company will not achieve its objectives. Performance is necessary as an evaluation material for a leader or manager. Performance is also a record of outcomes generated by certain employees or activities performed over a period of time. Where a person is required to play his part in carrying out the company's strategy.
Bangun (2012: 231) defines performance as a result of work achieved by employees based on job requirements. An employee is a person who does the job by getting rewards in the form of salary and benefits from the company. This employee is doing all the work or activities of the company's operations. So understanding the performance of employees is the work of individuals in a company. Company performance is the totality of work achieved by a company. Employee performance and company performance have a very close relationship, the achievement of corporate goals.
Another opinion expressed by Wibowo (2008: 67) that defines performance as a process of how the work takes place to achieve the work. However, the work itself also shows performance. Suwanto and Donni (2011: 196) state that performance is a performance or performance. Performance can also be interpreted as work performance or the implementation of work or performance results. According to August W. Smith (cited by Suwanto and Donni, 2011: 196) states that "performance is output drives from processes, human otherwise". Based on this statement can be interpreted that the performance is a result achieved by a person based on the size of the application within a period of time and with respect to work and its behavior and actions.
From some definition of employee performance presented by the experts above, then in employee performance research is the result of work (output) both quality and quantity achieved by employees per unit period of time in carrying out their duties in accordance with the responsibilities given to him.
Sudarmanto (2009:11) reveals dimensions or performance indicators are aspects that become measures in assessing performance. Measures serve as a benchmark in assessing performance. Dimensions or measures of performance are necessary because it will be beneficial to many parties. Dimensions or sizes that can be used as
benchmarks in assessing employee performance are as follows:
1. Quality of work, namely the level of error, damage, accuracy.
2. Quantity of work, ie the amount of work produced. 3. Use of time in work, ie absence rate, delay, effective working time / hours lost work.
4. Cooperation with others and co-workers in work.
RESEARCH METHODS
Research Design
This research uses explanatory analysis approach and descriptive analysis, which aims to determine the influence of independent variables and bound. The findings will then be described by observing and researching and describing the ongoing nature or events at the time of the study and examining the causes of certain symptoms (Travers: 1978). In this study examines the influence of leadership style variables, organizational climate, on employee performance either directly or indirectly through organizational commitment.
Population and Sample
The population according to Umar (2008: 137) is defined as a collection of elements having the same particular characteristics and having equal opportunity to be selected as a sample member. The population in this research is employees of Perum Pegadaian Branch East Bekasi as many as 40 people.
Suharsimi (2009: 131) defines the sample as a partial or representative of the population under study. In order to obtain a representative sample of the population, each subject in the population is attempted to have equal opportunity to sample. The sampling technique used in this research is probability sampling and simple random sampling. According Sugiyono (2009: 66) is a probability sampling is a sampling technique to provide the same opportunity to each member of the population to be elected as a member of the sample. While the simple random sampling is the method of sampling from members of the population using random without regard to the strata (level) in members of that population. The number of samples is 40 people.
Data Collection Technique
along with alternative answers so that respondents just choose one of the alternative answers.
Data Processing Techniques
The data obtained in this research needs to be further processed in order to be able to analyze and taken a proper conclusion. Therefore it is necessary to set data processing techniques in accordance with the purpose of research to be achieved, also to test the truth of the hypothesis. The stages of data processing performed are:
1. Conduct instrument test / questionnaire 2. Test the classical assumptions
3. Conducting hypothesis testing
Test Instrument
Before performing data analysis and interpretation, a questionnaire needs to be tested in advance of its validity and reliability. It is intended to know the extent to which the accuracy and accuracy of a tool in performing the function of the measuring instrument or provide a measurement that matches the level of validity and reliability that meet the required limit. It is necessary to distinguish between valid and reliable research results. The results of valid research when there is similarity between the data collected with the actual data occurred on the
object under study. The research results are reliable if there are similarities of data in different time.
Classic Assumption Test
Before testing the hypothesis done, first tested the symptoms of deviation from classical assumptions. The assumption of a classic linear model is that it cannot be auto correlated and data is normally distributed. But in this study, classic deviation test used the only multicollinearity, heteroskedasticity and data normality.
RESEARCH RESULT AND DISCUSSION
Validity Test
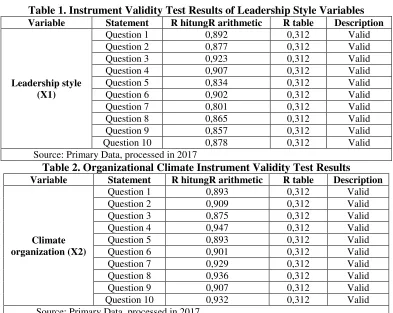
Validity test is used to test each research variable, where the entire research variable contains 40 statements answered by 40 respondents. The criteria used in determining whether or not valid statements used in this study are as follows: trust level = 95 percent (probability
or α = 5%), degrees of freedom (DK) = n -2 = 40 - 2 = 38, obtained r table = 0.312. If r count is greater than r table and the value of r is positive, then the statement item is said to be valid (Ghozali, 2005: 17). Based on the analysis that has been done, the test results validity can be shown in the table below.
Table 1. Instrument Validity Test Results of Leadership Style Variables
Variable Statement R hitungR arithmetic R table Description
Leadership style (X1)
Question 1 0,892 0,312 Valid
Question 2 0,877 0,312 Valid
Question 3 0,923 0,312 Valid
Question 4 0,907 0,312 Valid
Question 5 0,834 0,312 Valid
Question 6 0,902 0,312 Valid
Question 7 0,801 0,312 Valid
Question 8 0,865 0,312 Valid
Question 9 0,857 0,312 Valid
Question 10 0,878 0,312 Valid
Source: Primary Data, processed in 2017
Table 2. Organizational Climate Instrument Validity Test Results
Variable Statement R hitungR arithmetic R table Description
Climate organization (X2)
Question 1 0,893 0,312 Valid
Question 2 0,909 0,312 Valid
Question 3 0,875 0,312 Valid
Question 4 0,947 0,312 Valid
Question 5 0,893 0,312 Valid
Question 6 0,901 0,312 Valid
Question 7 0,929 0,312 Valid
Question 8 0,936 0,312 Valid
Question 9 0,907 0,312 Valid
Question 10 0,932 0,312 Valid
Table 3. Validity Test Results Instrument Variable Organizational Commitment
Variable Statement R hitungR arithmetic R table Description
Organizational Commitment
(X3)
Question 1 0,843 0,312 Valid
Question 2 0,925 0,312 Valid
Question 3 0,890 0,312 Valid
Question 4 0,951 0,312 Valid
Question 5 0,918 0,312 Valid
Question 6 0,924 0,312 Valid
Question 7 0,833 0,312 Valid
Question 8 0,789 0,312 Valid
Question 9 0,942 0,312 Valid
Question 10 0,921 0,312 Valid
Source: Primary Data, processed in 2017
Table 4. Instrument Validity Test Results Employee Performance Variables
Variable Statement R hitungR
arithmetic
R table Description
Employee Performance
(Y)
Question 1 0,867 0,312 Valid
Question 2 0,928 0,312 Valid
Question 3 0,957 0,312 Valid
Question 4 0,937 0,312 Valid
Question 5 0,915 0,312 Valid
Question 6 0,910 0,312 Valid
Question 7 0,821 0,312 Valid
Question 8 0,780 0,312 Valid
Question 9 0,956 0,312 Valid
Question 10 0,943 0,312 Valid
Source: Primary Data, processed in 2017
Based on table 1, 2, 3, 4 above, it can be seen that from the 40 items of variable question used (leadership style variable, organizational climate, organizational commitment, and employee performance) the result is valid.
Test Reliability
Test reliability to know the extent to which the measurement results are reliable and consistent. In the table, the following test results note that all variables have alpha above 0.6 which means that all variables in this study reliable.
Table 5. Reliability Test Results Instrument Variable Research
Variable Cronbach Alpha (α) Description
Leadership style (X1) 0,973 Reliable
Organizational climate (X2) 0,981 Reliable Organizational commitment (X3) 0,976 Reliable Employee Performance (Y) 0,977 Reliable Source: Primary Data, processed in 2017
Based on the above Cronbach alpha reliability figures can be seen that all existing statements form a reliable measure of leadership style variables, organizational climate, organizational commitment and employee performance form a reliable measure of each dimension.
Research Results
BLUE Assumption Testing
regression model yielded meet the requirements of classical assumption. Usually, this test is performed on an analysis with a variable of more than two numbers. Algifari (2000: 83) says: "Regression model derived from the simplest quadratic method (Ordinary Least Square / OLS) is a regression model that yields unbiased and linear
estimators best (Best Linear Unbias Estimator / BLUE) ". The classical assumption test can be seen in the description below.
Normality Test
Normality testing is done by using P-P plot test for a residual test of regression model shown:
Figure 1. Graph of Histogram and Normal Graph of Probability Plot The normal probability plot graph shows that the data
spread around the diagonal line and follows the direction of the diagonal line, then the regression model meets the assumption of normality. The histogram graph shown in the image above gives a normal distribution pattern as it spreads evenly to both left and right. In addition to
graphical analysis, the normality test can be done by looking at significant numbers of Kolmogorov-Smirnov test, that is by Kolmogorov-Smirnov test on the residual data, the normality test results were seen in the table as follows:
Table 6. Normality Test Results One-Sample Kolmogorov-Smirnov Test
Leadershi p Style
Organization al Climate
Organizationa l Commitment
Employee Performance
N 40 40 40 40
Normal Parametersa,b
Mean 41.65 37.53 41.10 40.63
Std. Deviation
2.070 2.375 2.560 2.382
Most Extreme Differences
Absolute .168 .158 .116 .122
Positive .103 .115 .116 .112
Negative -.168 -.158 -.088 -.122
Kolmogorov-Smirnov Z 1.062 .998 .735 .769
Asymp. Sig. (2-tailed) .210 .273 .652 .596
a. Test distribution is Normal. b. Calculated from data.
In table 6 normality test results, that all variables are normally distributed, this can be seen from Kolmogorov-Smirnov significance test of leadership style variables of 0.210, organizational climate variable of 0.273, organizational commitment variable of 0.652 and employee performance variable of 0.596,
Kolmogorov-Smirnov each variable used is greater than α = 0.05. Autocorrelation Test
Table 7. Autocorrelation Test Results
Model Summaryb
Model R R
Square
Adjusted R Square
Std. Error of the Estimate
Durbin-Watson
1 .746a .557 .520 1.651 1.725
a. Predictors: (Constant), Organizational Commitment, Leadership Style, Organizational Climate
b. Dependent Variable: Employee performance
From Durbin Watson results obtained when juxtaposed with the proposed criteria autocorrelation test that can be concluded the absence of autocorrelation (entry on the criteria 1.55-2,46). So the conclusion is the Autocorrelation Test is met.
Multicollinearity Test
This test aims to test whether the regression model found a correlation between independent variables (independent).
A good regression model should not be correlated with independent variables. If the independent variables are correlated, then the variable-Inflation Factor (VIF). If the value of VIF > 10 occurs multicollinearity. Conversely, if VIF < 10, this variable is not orthogonal (Ghozali 2007: 91).
Table 8. Multicollinearity Test Results
Coefficients
Model Unstandardized
Coefficients
Standardized Coefficients
t Sig. Collinearity Statistics
B Std. Error Beta Tolerance VIF
1 (Constant) 1.329 .164 2.559 .000
Leadership Style .176 .138 .153 2.281 .000 .861 1.161
Climate Organization
.419 .138 -.418 3.043 .004 .653 1.531
Organizational Commitment
.747 .131 .802 5.698 .000 .622 1.609
a. Dependent Variable: Employee performance
From the output data above, it is found that the value of all VIF values < 10 this means no multicollinearity and concludes that the multicollinearity test is fulfilled.
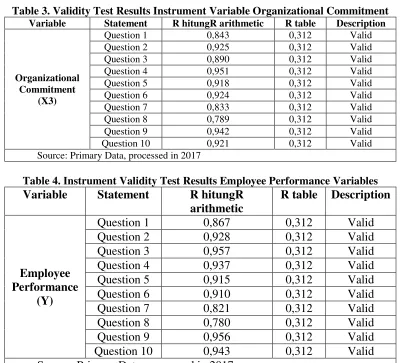
Heteroskedastic Test
To determine whether or not the heteroskedastic in this study is done by looking at the scatter plot graph between the predicted value of the dependent variable (ZPRED) and its residual (SRESID). The basis of the analysis (1) if there is a certain pattern, such as the existing points form a certain pattern that is regular (wavy, widened then narrowed) then indicates there have been heteroskedastic, (2) if there is no clear pattern and spreading points above and below the number 0 on the Y axis, there is no heteroskedastic (Ghozali, 2007). For more details can be seen on the scatter plot chart below.
From the picture above can be seen that there is no heteroskedasticity because there is no clear pattern and the spots spread above and below the number 0 on the Y axis so that it can be said heteroskedasticity test is met.
Linearity Test
Linearity test is used to ascertain whether the relationship between the independent variable and the dependent variable is linear or not. The relationship between variables X and Y is said to be linear when the rate of
change in Y (employee performance) associated with the change of one unit X (leadership style, organizational climate, and organizational commitment) is constant for a range of values. In Figure 3. The normal plot graph below shows that the spots spread around the diagonal line, and the spreading follows the direction of the diagonal line. From the two graphs above can be concluded that the regression model meets Linearity assumption.
Figure 3. Normal Graph Plot Linearity Test
Hypothesis Testing
1. Effect of leadership style and organizational climate on employee performance
R square value of the influence of leadership style variables and organizational climate on employee performance that is equal to 0.920. This value can be
interpreted that variation of employee performance variable change can be explained by the variation of change of leadership style and organizational climate variable equal to 92% while the rest that is equal to 8 influenced by other variables outside leadership style and organizational climate.
Table 9. Summary Model Influence of Leadership Style and Organizational Climate Against Employee Performance
Model Summary
Model R R
Square
Adjusted R Square
Std. Error
of the
Estimate
1 .959a .920 .915 .694
a. Predictors: (Constant), Organizational Climate, Leadership Style
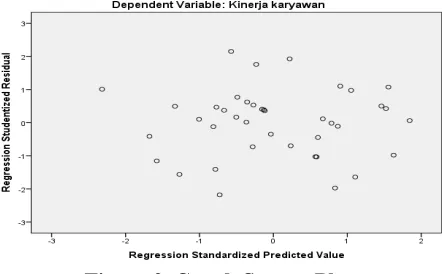
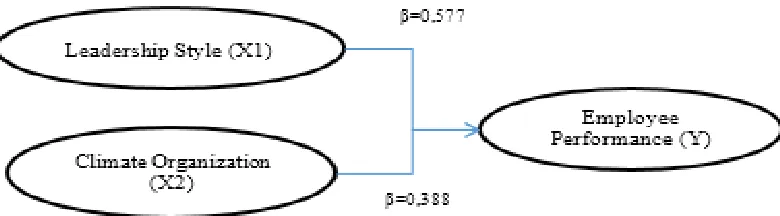
Table 10. Effect Analysis of Organizational Leadership and Climate Styles Against Employee Performance
Coefficients
Model Unstandardized
Coefficients
Standardized Coefficients
t Sig.
B Std. Error Beta
1 (Constant) 1.609 .016 2.533 .000
Leadership Style .664 .253 .577 2.626 .000
Climate Organization .389 .220 .388 7.765 .000
a. Dependent Variable: Employee performance
In table 10, it can be seen that the influence of leadership style variables and organizational climate have a positive effect on employee performance.The value of standardized Coefficients leadership style is a coefficient of variable regression of leadership style that gives meaning if the application of leadership style model in accordance with organizational needs then employee performance increased by 0.577. The value of standardized Coefficients organizational climate is the regression coefficient of organizational climate variables that gives meaning if the creation of a conducive organizational climate then the
performance of employees increased by 0.388. From both regression coefficients value obtained coefficient value regression variable leadership style has a great value in the formation of employee performance then followed by the value of regression coefficient of the organizational climate. This statement provides the meaning that the company in improving the performance of its employees can prioritize on the application of leadership style model in accordance with the needs of the organization followed by the establishment of a conducive organizational climate. In the research model, this equation can be seen.
Figure 4. Model Analysis 1
Table 11. F Value Calculate Influence of Leadership Style and Organizational Climate Against Employee Performance
ANOVAa
Model Sum of
Squares
df Mean Square
F Sig.
1 Regressio n
203.559 2 101.779 11.371 .000b
Residual 17.816 37 .482 Total 221.375 39
a. Dependent Variable: Employee performance
The result of f arithmetic obtained is 11.371 when compared with f table (alpha = 0,05 DF = 2; 38), then the value of f table equal to 3.24. From the result of f arithmetic and f table obtained if compared can be concluded that the value of f count is greater than f table. The value of influence of leadership style and organizational climate on employee performance can be seen in table 11.
From the analysis described in the analysis of the influence of leadership style variables and organizational climate on employee performance can be concluded that the hypothesis stating "there influence of leadership style and organizational climate on employee performance at Perum
Pegadaian Branch East Bekasi " hypothesis proved and accepted.
2. Effect of leadership style and organizational climate on organizational commitment
R square value on the influence of leadership style variables and organizational climate to the organizational commitment that is equal to 0.924. This value can be interpreted that variation of organizational commitment variable change can be explained by the variation of change of leadership style and organizational climate variable equal to 92.4% while the rest that is equal to 7.6 influenced by other variables outside leadership style and organizational climate.
Table 12. Summary Model Influence of Leadership Style and Organizational Climate Against Organizational Commitment
Model Summary
Model R R
Square
Adjusted R Square
Std. Error of the Estimate
1 .961a .924 .920 .725
a. Predictors: (Constant), Organizational Climate, Leadership Style
The partial influence of leadership style and organizational climate variables on organizational commitment can be seen from the equation which is composed that is x3 = 0,751x1 + 1,034x2
Table 13. Influence Analysis of Leadership Style and Organizational Climate Against Organizational Commitment
Coefficients
Model Unstandardized
Coefficients
Standardized Coefficients
t Sig.
B Std. Error Beta
1 (Constant) 1.123 .149 1.992 .000
Leadership Style .928 .264 .751 2.352 .000
Climate Organization 1.115 .230 1.034 4.847 .000
a. Dependent Variable: Organizational Commitment
In table 13, it can be seen that the influence of leadership style variables and organizational climate have a positive effect on organizational commitment. The value of standardized Coefficients leadership style is the coefficient of variable regression of leadership style that gives meaning if the application of leadership style model is noticed by the company then the organizational commitment increased by 0.751. The value of standardized Coefficients organizational climate is the coefficient of regression of organizational climate variable which gives the meaning of creating a conducive organizational climate
hence impact on the increase of organizational commitment equal to 1,034. From both regression coefficients value, the
regression coefficient value of organizational climate variable has a great value in the formation of high and low organizational commitment then followed by the coefficient value of leadership style regression. This statement means that companies in increasing their commitment can prioritize the formation of an organizational climate followed by the application of leadership style models.
Figure 5. Model Analysis 2
Table 14. F Value Calculate the Influence of Leadership Style and Organizational Climate Against Organizational Commitment
ANOVAa
Model Sum of Squares df Mean Square F Sig.
1
Regression 202.489 1 202.489 17.428 .000b
Residual 18.886 38 .497
Total 221.375 39
a. Dependent Variable: Employee performance b. Predictors: (Constant), Organizational Commitment
The result of f arithmetic obtained is 17.428 when compared with f table (alpha = 0,05 DF = 2; 38), the value of f table equal to 3.24. From the result of f arithmetic and f table obtained if compared can be concluded that the value of f count is greater than f table. The value of partial influence of leadership style and organizational climate on organizational commitment can be seen in table 14. From the analysis described in the analysis of the partial influence of leadership style variable and organizational climate to organizational commitment can be concluded that the hypothesis states "there influence of leadership style and organizational climate to organizational
commitment to Perum Pegadaian Branch East Bekasi "the hypothesis proved and accepted.
3. Influence of organizational commitment to employee performance
R square value on the partial influence of organizational commitment variable on employee performance that is equal to 0.912. This value can be interpreted that variation
of employee performance variable change can be explained by the variation of organizational commitment variable change equal to 91.2% while the rest that is equal to 8.8% influenced by other variables outside organizational commitment.
Table 15. Influence Summary Model Organizational Commitment to Employee Performance Model Summary
Mod el
R R
Square
Adjusted R Square
Std. Error of the Estimate
1 .956a .915 .912 .705
a. Predictors: (Constant), Organizational Commitment
Table 16. Influence Analysis Organizational Commitment to Employee Performance Coefficients
Model Unstandardized
Coefficients
Standardized Coefficients
t Sig.
B Std.
Error
Beta
1 (Constant) 1.043 .816 12.227 .000
Organizational commitment
.890 .044 .956 20.185 .000
a. Dependent Variable: Employee performance
In table 16, it can be seen that the partial organizational commitment variable has a positive effect on employee performance. The value of Standardized Coefficients organizational commitment is the coefficient of regression
of organizational commitment variable which gives the meaning that if the organizational commitment is paid to improve employee performance equal to 0,956. In the research model, this equation can be seen in the model picture below.
Figure 6. Model Analysis 3
From the analysis described in the analysis of the partial influence of organizational commitment variable on employee performance can be concluded that the hypothesis stating "their influence of organizational commitment to employee performance at Perum Pegadaian Branch East Bekasi " can be proven and hypothesis accepted.
4. Effect of leadership style through the organizational commitment to employee performance
From the results of data processing has been done then can be described some equations that can be prepared on the variables discussed as follows.
Equation I Y = f (X1) = b1x1 Y = 0.577x1
Equation II Y = f (X2) = b2x2 Y = 0.388x2
Equation III X3 = f (X1) = b3x1 X3 = 0.751x1
Equation IV X3 = f (X2) = b4X2 X3 = 1.034x2
Equation V Y = f (X3) = b5X3 Y = 0.956x3
The immediate effects that can be composed are Y = 0.577x1
Y = 0.388x2
The indirect influence of leadership style on employee performance through organizational commitment that can be arranged are:
(0.751) (0.956) = 0.717
In the research model this equation can be seen in the model picture below.
From the direct and indirect influence described can be explained that the magnitude of direct influence of leadership style on employee performance that is equal to 0.577, while the magnitude of indirect influence of leadership style on employee performance through organizational commitment that is equal to 0.717. From the above explanation can be concluded that the value of direct influence is smaller than the value of indirect influence that gives the meaning that the organizational commitment variable capable mediate the leadership style on employee performance. With these values proven, the hypothesis that "there is an indirect influence of leadership
style through the organizational commitment to employee performance at Perum Pegadaian Branch East Bekasi " can be proven and hypothesis accepted.
5. The indirect influence of organizational climate on employee performance through organizational commitment
Indirect influences of organizational climate on employee performance that can be arranged are:(1.034) (0,956) = 0,988.
Figure 8. Model Analysis 5 From the direct and indirect influence described can be
explained that the magnitude of the direct influence of organizational climate on employee performance is equal to 0.388, while the amount of indirect influence of organizational climate on employee performance through organizational commitment that is equal to 0.988. From the above explanation can be concluded that the value of direct influence is smaller than the value of indirect influence that gives the meaning that the organizational
commitment variable is able to mediate organizational climate on employee performance. With the proving of this value, the hypothesis stating that "there is the indirect influence of organizational climate through employee organizational commitment to employee performance at Perum Pegadaian Branch East Bekasi " can be accepted
To see the direct and indirect effects of the compiled equations can be seen in the picture below.
CONCLUSIONS AND SUGGESTIONS Conclusion
Departing from the results of analysis and discussion can be concluded that there is a direct influence of leadership style on employee performance and direct influence of organizational climate on employee performance at Perum Pegadaian Branch East Bekasi. Then the result of organizational commitment variable analysis as an intervening variable can be proved perfectly that organizational commitment variable gives indirect influence on leadership style variable to employee performance and organizational climate variable to employee performance. This statement can be proven by the extent of indirect influence leadership style on
employee performance and organizational climate on employee performance through organizational commitment identified as an intervening variable.
Suggestion
As input materials refer to the analysis and discussion that has been made recommendations in the form of suggestions as follows.
a. The leaders in Perum Pegadaian Branch East Bekasi in applying the model of leadership style pay more attention to what factors should be considered in making decisions both in decision-making related to the administration and decisions related to the technical field. This is closely related to the characteristics of subordinates of each employee residing in Perum Pegadaian Branch East Bekasi. b. The organizational climate measured in this study
relates to company policies and regulations, the level of communication effectiveness, the level of relationships between employees, and the level of
leadership participation. Of the four dimensions attached to organizational climate variables identified that the dimensions of communication effectiveness and relationships among employees have a value of answers tend to be low. Input delivered is the company's management it would be better to prioritize the improvement of the quality of communication to be more effective and also the leadership more focused on the formation of work teams to be more solid and in the end organizational commitment can continue to increase.
c. The ability to remain loyal to the company is the most important indicator to note. To be able to stimulate employees then the company can provide employees to
grow as well as to provide fair and reasonable benefits. In addition, the company can also make communication and
socialization of vision, mission, policy, strategy, rules and corporate values to employees can be improved through coaching, guidance and employee involvement in policy formulation. With such involvement are expected employees will be more proud and have the spirit and ability to remain an employee at the company until afterward.
For further research that wishes to raise the same variable more attention to the determination of research indicators wherein the determination of indicators can be adjusted to the place or object of research set. Then, on the other hand, the weakness of this study can be seen from the use of the number of samples used. Where the limited number of respondents in this study can have an impact on the accuracy and validation of data collected and analyzed.
REFERENCES
Algifari. 2000. Analisis Regresi, Teori, Kasus & Solusi. BPFE UGM, Yogyakarta.
Arep, Ishak dan Hendri Tanjung. 2003. Manajemen Sumber Daya Manusia.Universitas Trisakti. Jakarta.
As’ad, Moh, 2004. Psikologi Industri: Seri ilmu Sumber Daya Manusia, Penerbit Liberty, Yogyakarta.
Asmara, J.A. 2001. Perilaku Oportunistik Legislatif Dalam Penganggaran Daerah Bukti Empiris atas Aplikasi Agency Theory di Sektor Publik. Simposium Nasional Akuntansi (SNA). Palembang.
Dessler, Gary., 2006. Manajemen Sumber Daya Manusia, Edisi Kesepuluh. PT INDEKS Jakarta.
Ghozali, Imam. 2007. Analisis Multivariate Dengan Program SPSS. Cetakan Empat. Badan. Penerbit Universitas diponegoro. Semarang.
Heidjrachman dan Suad Husnan, 2002, Manajemen Personalia. Edisi 5, Penerbit BPFE, Yogyakarta.
Hersey. 2004. Kunci Sukses Pemimpin Situasional. Jakarta: Delaprasata.
Husein, Umar., 2008. Metode Penelitian Untuk Skripsi dan Tesis Bisnis. PT Rajagrafindo Persada. Jakarta.
Kartono Kartini Dr. 2010. Pemimpin dan Kepemimpinan. PT. Raja Grafindo Perkasa. Jakarta.
Lussier, N, Robert. 2005. Human Relations in Organization. Applications and Skill Building. Mc Graw Hill. New York.
Mathis dan Jackson. 2006. Manajemen Sumber Daya Manusia. Jakarta: PT Salemba Empat.
Ralph B. 2000. Educational Administration. : Mc Graw – Hill Book Company. New York.
Respatiningsih, Ida & Frans Sudirjo (2015). Pengaruh komitmen organisai, kapabilitas dan kepuasan kerja terhadap kinerjapegawa i(Studi Empirik Pada Inspektorat Kabupaten Pemalang).Serat Acitya – Jurnal Ilmiah UNTAG Semarang ISSN : 2302-2752, Vol. 4 No. 3, 2015.
Riniwati, Harsuko. 2011. “Mendongkrak Motivasi dan Kinerja: Pendekatan Pemberdayaan SDM”. UB Press: Malang.
Rivai,Veithzal,. 2004.Manajemen Sumber Daya Manusia untuk Perusahaan dari Teori ke Praktik PT Raja Grafindo Persada. Jakarta.
Robbins, S. 2008. Perilaku Organisasi. Jilid 1 dan 11. Terjemahan oleh Hadyana Puja Atmaja. Jakarta: Prenhallindo
Robbins, Stephen P, 2002. Prinsip-prinsip Perilaku Organisasi, PT. Erlangga, Jakarta.
Robbins, Stephen P. dan Coulter, Mary. 2010. Manajemen Edisi Kesepuluh. Jakarta: penerbit Erlangga
Schein, E. H. 2001. Organizational culture and leadership. Jossey-Bass. San Fransisco.
Sedarmayanti.2009. Sumber Daya Manusia dan Produktivitas Kerja. CV Mandar Maju. Bandung.
Simamora, Henry, 2004, Manajemen Sumber Daya Manusia, Edisi Ketiga, Cetakan Pertama, Bagian Penerbitan STIE YKPN, Yogyakarta.
Sudarmanto., 2009. Kinerja dan Pengembangan Kompetensi SDM (Teori, Dimensi Pengukuran dan Implementasi dalam Organisasi). Pustaka Pelajar, Yogyakarta.
Sugiyono., 2009. Metode Penelitian Bisnis. Alfabeta.Gede Merta. Bandung.
Suratno., Pardi. 2006. Sang Pemimpin menurut Asthabrata, Wulangreh,Tripama, Dasa Darma Raja. Adi Wacana. Yogyakarta.
Sutrisno., 2013. Manajemen Sumber Daya Manusia, Cetakan Kelima.Prenada Media. Yogyakarta.
Suwatno dan Donni., 2011. Manajemen SDM dalam Organisasi Publik dan Bisnis. Alfabeta. Bandung.
Suyuti., 2001. Pelatihan Dasar Kepemimpinan (Leadership). Penerbit Cinta Ilmu Pekalongan.
Tjiptono Fandy,2001.Strategi Pemasaran. Edisi Pertama. Andi Ofset.Yogyakarta.
Travers.,1978. Elementary Survey Sampling. Wadsworth Pub, Co. New York.
Umar, H., 1999. Riset Sumber daya Manusia Dalam Organisasi Cetakan Ketiga.PT. Gramedia Pustaka Utama. Jakarta.
Wahjosumidjo. 2010. Kepemimpinan Kepala Sekolah Tinjauan Teoritik dan Permasalahannya. PT Raja Grafindo Persada. Jakarta.
Wibowo., 2008. Negara Centeng Negara dan Saudagar di Era Globalisasi. Kanisius. Yogyakarta.