www.pharmascholars.com
137
Original Article
CODEN: IJPNL6
Method development and validation for the analysis of Penciclovir and related
impurity in bulk and pharmaceutical dosage forms by RP HPLC
Shiny Ganji*
1and D.Satyavati
21
Asst. Prof, St. Ann’s College of Pharmacy, Vetapalem, Chirala, Prakasam Dist, Andhar
Pradesh, India
2
Director, Brilliant Grammer School Educational Society’s Group of Institutions, Integrated
campus, Hayath Nagar, R.R.Dt, Hyderabad, India
*Corresponding author e-mail: [email protected]
Received on: 30-11-2015; Revised on: 15-12-2015; Accepted on: 07-01-2016
ABSTRACT
The prime aim of the current work is to develop and validate a novel, specific, sensitive, precise, rapid and faster isocratic elution RP HPLC method for estimation of Penciclovir and its process related impurity in bulk and pharmaceutical dosage forms. The chromatographic separation was achieved on Hypersil phenyl, 250 mm X4.6 mm, 5 µ with mobile phase composed of 0.1% orthophosphoric acid in 1000 ml of water and acetonitrile in the ratio of
60:40 using an isocratic mode. The temperature is maintained at 30oC, detection was made using UV detector and
LC solution software at 254 nm and the flow rate was maintained at 1.0ml/min. The run rate was 20 min. The developed method was validated according to ICH guide lines. The linearity of calibration curve for each analyte in concentration range of 1200µg/ml – 3600µg/ml was good. The curve was linear for the impurity in concentration range of 8 - 24µg/ml. There exists a good correlation between peak area and analyte concentration. Relative standard deviation values for penciclovir is 0.111 and its process related impurity is 0.359. LOD for the active ingredient and its impurity was found to be 0.02 % and 0.5 % respectively. LOQ for active ingredient and its impurity was found to be 0.06 % and 0.15% respectively. Statistical analysis revealed that the proposed method was found to be highly sensitive, precise, accurate, robust and fast. The shorter retention time allows the analysis of large number of samples in short period of time and it is cost effective, so it can be successfully applied for routine analysis of active pharmaceutical ingredients and related impurities in bulk and pharmaceutical dosage forms.
Keywords: Penciclovir, Denavir, RP –HPLC method, mono alkyl impurities, validation, method development
INTRODUCTION
Penciclovir is a guanine nucleoside analogue, active against herpes simplex virus type 1 and 2, Varicella zoster virus, Epstein virus and hepatitis B virus.[1,2]
Its molecular formula is C10H15N5O3 and its IUPAC
name is 2-amino-9-[4-hydroxy-3-(hydroxymethyl) butyl]-6,9-dihydro-3H-purin-6-one.[3] But it has poor
bioavailability when administered orally, so it was developed as a prodrug i.e famciclovir. It inhibits enzyme thymidine kinase and interferes with DNA synthesis [4] It is official in USP and BP.It is mostly
used as topical treatment under the brand name
Denavir. It is a synthetic acyclic guanine derivative and Fig 1 represents the structure of Penciclovir. There are few HPLC methods available in the literature for the analysis of Penciclovir but no method is available for determination of penciclovir. These include ‘activity of penciclovir in antiviral assays against herpes simplex virus,[5] a new
validated RP HPLC method for determination of penciclovir in human plasma,[2] method development
and validation of analysis of antiviral drug penciclovir,[3] simple and reliable stability indicating
RP HPLC method for determination of assay of
International Journal of Pharmacy
www.pharmascholars.com
138
Famciclovir in drug substance[6] Extensive literature
survey revealed that there were methods for validation of Penciclovir but no method was available for validation of Penciclovir and its related impurity, hence the present work aims at analysis of Penciclovir and its process related inpurity in bulk and also pharmaceutical dosage forms.
MATERIALS AND METHODS
Chemicals and materials: The active ingredient and its related impurity were procured from Mylan labs. HPLC grade double distilled water, analytical grade ortho phosphoric acid, acetonitrile were obtained from Qualigens Fine chemicals Ltd, Mumbai.
Instrumentation: The analytical separations were carried out on a liquid chromatograph equipped with variable wavelength UV detector and the output of signal was monitored and integrated using LC solution software. The analytical column used was Hypersil Phenyl, 250 mm X 4.6 mm, 5 µ. Mobile phase is composed of 0.1% orthophosphoric acid in 1000 ml of water, and acetonitrile (60:40). The flow rate was maintained at 1.0ml/min. and the run time was 20 min. The column was monitored at a temperature of 30oC and the volume of sample
injected was 20 µl. Detection was made at 254 nm.
Preparation of standard preparation: Transfer 150.2 mg of Penciclovir and 1mg of mono alkyl impurity of working standard in to 50 ml volumetric flask and dilute to volume with diluent(mobile phase).
Preparation of test solution: Transfer 2420.3 mg of Denavir cream into 100 ml volumetric flask and dilute to volume with diluent. Take 5 ml to 50 ml volumetric flask and dilute with diluents. Take 10 ml of above solution to 20 ml volumetric flask and dilute with diluent.
Assay: 20 µl of standard and sample solutions were injected into chromatographic system and the areas of peaks for Penciclovir and its impurity were measured and the % assay was calculated using the formula At X Ws X avg.wt X P = %
As X Wt X claime wt
Where: At : Average area due to Denavir formulation peak in sample
As: Average area due to penciclovir & monoalkyl impurity peak in standard
preparation
Ws: Weight of the working standard Penciclovir and mono alkyl impurity
Wt: Weight of sample Denavir formulation
P: Potency of working of the working standard
Method validation:
Validation parameters like system suitability, linearity, accuracy, precision, specificity, limit of detection, limit of quantitation and robustness were performed as per ICH guidelines Q2 (R1) [7]
Linearity and range: Standard solutions of active pharmaceutical ingredient and mono alkyl impurity were diluted to 1201µg/ml – 3604 µg/ml and 8µg/ml – 24 µg/ml respectively. Set up the chromatographic system to equilibrate and inject the solutions, keeping the injection volume constant, 20µl.
System suitability: Twenty microliters of the standard solution of active ingredient (0.3 μg/mL) and mono alkyl impurity (0.015mg/ml) were injected under optimized chromatographic conditions to evaluate the suitability of the system.
Precision: 0.3mg/ml of Peciclovir and 0.015mg/ml of mono alkyl impurity standard solutions were injected six times and record the response. Penciclovir sample was also injected six times to record the response.
Accuracy: Three known concentrations of Penciclovir and mono alkyl impurity were spiked at 80%, 100% and 120% and each solution was injected 3 times to evaluate accuracy.
Specificity: The diluent was injected as blank to get the steady line. 0.3 mg/ml of Penciclovir and 0.015 mg/ml of mono alkyl impurity of standard and sample were injected to record the response. Responses of the peaks were noted for any possible interferences of the excipient at the retention time of the drug.
Limit of detection and limit of quantitation: The limit of detection (LOD) is the lowest amount of analyte that can be detected in a sample, but not necessarily quantified, under the stated experimental conditions. The limit of quantification (LOQ) was identified as the lowest plasma concentration of the standard curve that could be quantified with acceptable accuracy, precision, and variability. They are determined by the signal-to-noise method. Starting with concentration of 20%, 10%, 5%, 2%, 1%, 0.5%, 0.2%, 0.1%, 0.05%, 0.02%, 0.01%, 0.005%.
www.pharmascholars.com
139
Different column: 0.3mg/ml of Penciclovir and 0.015 mg/ml of mono alkyl impurity standard solutions were injected in different column 3 times and response was recorded. Danavir sample was also injected 3 times and response was recorded.
Variation of flow: 0.3mg/ml and 0.15 mg/ml of Penciclovir and mono alkyl impurity respectively were injected 3 times and response was recorded and Danavir sample was also injected 3 times by increasing and decreasing the flow rate.
RESULTS AND DISCUSSION
Method development and optimization:
To optimize the chromatographic conditions, the effect of mobile phase is studied with various solvent system combinations for the determination of Penciclovir and its related impurity(mono alkyl impurity) in bulk and pharmaceutical dosage forms. A mixture of 0.1% orthophosphoric acid in 1000 ml of water and acetonitrile (60:40) was selected as it gave best resolution. The effect of flow rate was studied in the range of 0.9 to 1.2 ml/min and 1.0 ml/min was preferred to be effective. Under these conditions, the analyte peak obtained was well defined and free from tailing. The retention time (RT) was found to be 5.088 min for Penciclovir and 6.573 min for mono alkyl impurity. The optimized parameters were listed in Table 1. Chromatogram for standard solutions of Penciclovir and mono alkyl impurity were presented in Fig 2 and 3 respectively.
System suitability studies:
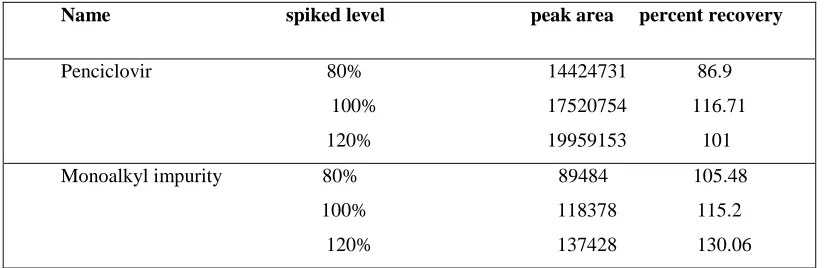
These tests are an integral part of method development and are used to ensure adequate performance of chromatographic system. Retention time (RT), number of theoretical plates (N), tailing factor (T) and resolution were evaluated. The system suitability method acceptance criteria set in each validation run were capacity factor . 2.0, tailing factor ≤and theoretical plates > 2000. In all cases, the relative standard deviation for analyte peak area < 2.0%. System suitability parameters were shown in Table 2. Chromatogram for system suitability studies is presented in Fig 4.
Linearity:
Aliquots of standard solutions of drug and also impurity were taken and diluted to 40%, 60%, 80%, 100%, 120%
Each of these drug solutions was injected in to the column and peak areas and retention times were recorded. A calibration graph was obtained by
plotting graph between peak area versus
concentration. Excellent correlation was obtained between peak area and concentration with R2 = 0.999
for Penciclovir and 0.999 for mono alkyl impurity.
Results are shown in Table 3 and 4 and the linearity curves are shown in Fig 5 and 6.
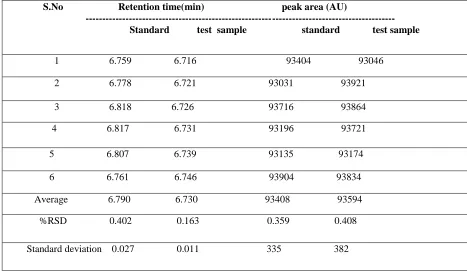
Accuracy:
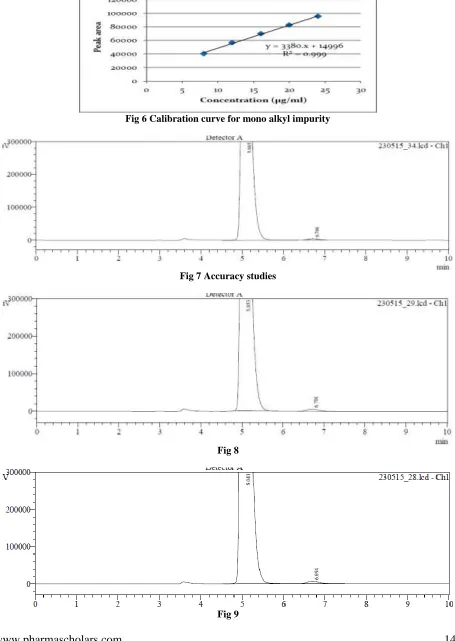
Accuracy studies were done by standard addition method. Accuracy is expressed as % recovery of the standard spiked to previously analysed test sample of tablet. It was measured in drug products by spiking known amounts (80%, 100% and 120%) of the analyte into the analyzed tablet powder and calculating the percent recovered. The closeness of obtained value to true value indicates that the proposed method is accurate. The recovery data for accuracy studies was shown in Table 5. The accuracy chromatograms for the respective concentrations were shown in Fig 7, 8, 9
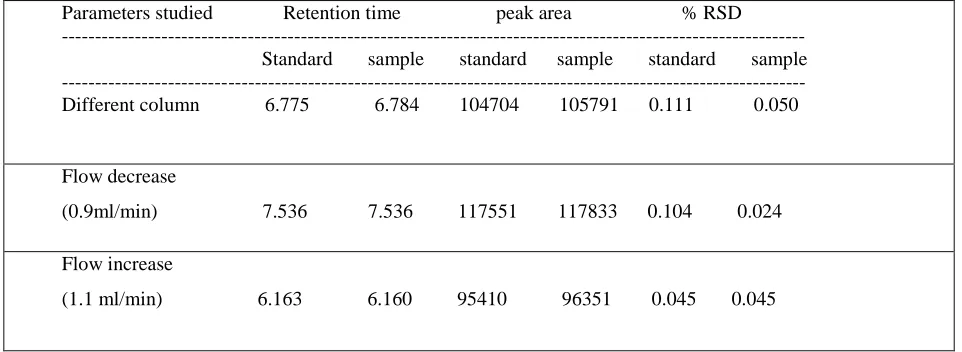
Precision:
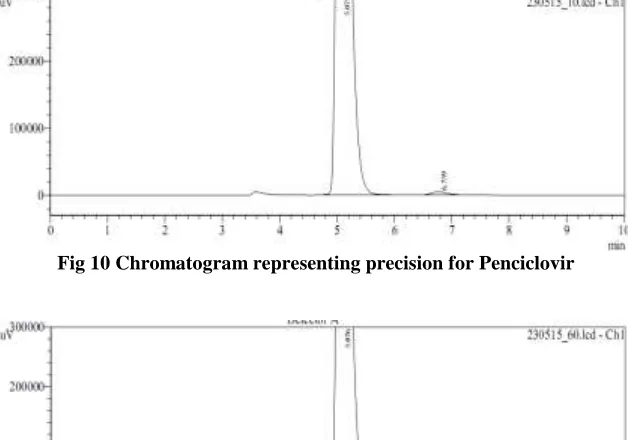
It is the agreement between replicate measurements of the same sample. It is expressed as relative standard deviation of replicate measurements. The standard solution was injected six times and area of peak is measured. The % RSD for the peaks was found with in the limits, RSD ≤1. Results were reported in Table 6 and 7 and chromatograms were presented in Fig 10 and 11
Limit of Detection (LOD) and Limit of Quantitation(LOQ):
LOD and LOQ were determined based on the standard deviation of response and slope (S) of regression as per ICH guide lines according to the formula. The LOD of an analytical method is the lowest amount of analyte in a sample which can be detected but not necessarily quantified. It can be determined from the equation,
LOD = 3.3 X SD S LOQ = 10 X SD S
Where S is the slope of calibration curve and SD is standard deviation. It was determined starting with the concentration of 20%, 10%, 5%, 2%, 1%, 0.5%, 0.2%, 0.1%, 0.05%. 0.02%, 0.01%.
LOD and LOQ for Penciclovir was found to be 0.62 and 1.89 µg/ml respectively
LOD and LOQ for mono alkyl impurity was found to be 0.06 and 0.18 µg/ml respectively
Robustness:
www.pharmascholars.com
140
Different column:
Robustness for different column can be evaluated by injecting 0.3 mg/ml of Penciclovir and 0.015 mg/ml of mono alkyl impurity standard solution 3 times and record the response. Inject Denavir sample 3 times and record the response. Chromatograms for standard and test samples are shown in Fig 12 and 13
Variation in flow:
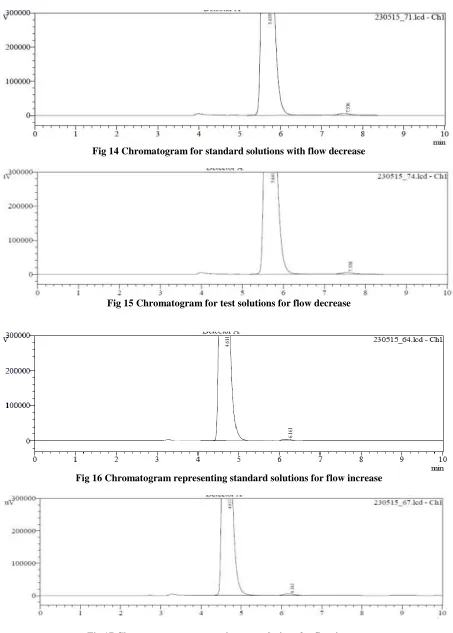
It can be evaluated by injecting 0.3mg/ml of Penciclovir and 0.015 mg/ml of mono alkyl impurity standard solution 3 times and record the response. Inject Denavir sample for 3 times and record the response by changing the flow rate. Chromatograms are depicted in Fig 14, 15,16 and 17
CONCLUSION
The method proposed for the analysis of Penciclovir and its related impurity i.e mono alkyl impurity in
bulk and pharmaceutical dosage forms was found to be specific, precise, accurate, rapid and economical. The developed method was validated in terms of accuracy, linearity, robustness and precision in accordance with ICH guide lines. The method is cost effective due to short retention time which enabled analysis of Penciclovir and mono alkyl impurity with small amount of mobile phase. The method was found to be precise and accurate from precise studies. The method is sensitive due to low detection and quantitation limits. Robustness data indicate that the method is not susceptible to small changes in chromatographic conditions. This method can be applied successfully in estimation of active pharmaceutical ingredient and its related impurities in bulk and pharmaceutical dosage forms.
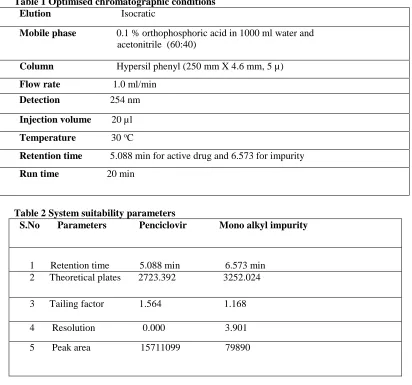
Table 1 Optimised chromatographic conditions Elution Isocratic
Mobile phase 0.1 % orthophosphoric acid in 1000 ml water and acetonitrile (60:40)
Column Hypersil phenyl (250 mm X 4.6 mm, 5 µ)
Flow rate 1.0 ml/min
Detection 254 nm
Injection volume 20 µl
Temperature 30 oC
Retention time 5.088 min for active drug and 6.573 for impurity
Run time 20 min
Table 2System suitability parameters
S.No Parameters Penciclovir Mono alkyl impurity
1 Retention time 5.088 min 6.573 min 2 Theoretical plates 2723.392 3252.024
3 Tailing factor 1.564 1.168
4 Resolution 0.000 3.901
www.pharmascholars.com
141
Table 3. Linearity results for PenciclovirConcentration (μg/ml) peak area
1201.6 6993363
1802.4 9649137
2403.2 13254794
3004.0 15759134
3604.8 19015896
Table 4. Linearity results for mono alkyl impurity Concentration (μg/ml) Peak area 8 40808
12 56664
16 69892
20 82599
24 95449
Table 5Accuracy studies of Penciclovir and mono alkyl impurity Name spiked level peak area percent recovery Penciclovir 80% 14424731 86.9 100% 17520754 116.71 120% 19959153 101
Monoalkyl impurity 80% 89484 105.48
100% 118378 115.2
www.pharmascholars.com
142
Table 6. Precision results for standard and test sample of PenciclovirS.No Retention time (min) Peak area (AU)
_________________________________________________________________ Standard test sample standard test sample
1 5.075 5.061 15805617 15852172
2 5.082 5.063 15809955 15844420
3 5.095 5.065 15814326 15847963
4 5.095 5.064 15804874 15844376
5 5.091 5.068 15773528 15843308
6 5.077 5.070 15777603 15837013
AVERAGE 5.086 5.065 15797650 15844875
%RSD 0.175 0.068 0.111 0.032 SD 0.009 0.003 17486 5050
Table 7 . Precision results for standard and test sample of mono alkyl impurity S.No Retention time(min) peak area (AU) --- Standard test sample standard test sample 1 6.759 6.716 93404 93046
2 6.778 6.721 93031 93921
3 6.818 6.726 93716 93864
4 6.817 6.731 93196 93721
5 6.807 6.739 93135 93174
6 6.761 6.746 93904 93834
Average 6.790 6.730 93408 93594
www.pharmascholars.com
143
Table 8 Robustness study for PenciclovirParameters studied Retention time peak area % RSD
---
Standard sample standard sample standard sample
Different column 5.073 5.076 15776876 15926815 0.048 0.096
Flow decrease
(0.9ml/min) 5.639 5.639 17664796 17711740 0.063 0.03
Flow increase
(1.1 ml/min) 4.611 4.609 14450403 14546880 0.025 0.026
Table 9Robustness study for mono alkyl impurity
Parameters studied Retention time peak area % RSD --- Standard sample standard sample standard sample --- Different column 6.775 6.784 104704 105791 0.111 0.050
Flow decrease
(0.9ml/min) 7.536 7.536 117551 117833 0.104 0.024
Flow increase
(1.1 ml/min) 6.163 6.160 95410 96351 0.045 0.045
www.pharmascholars.com
144
Fig 2Chromatogram for penciclovirFig 3 Chromatogram for mono alkyl impurity
Fig 4 Chromatogram representing system suitability parameters
www.pharmascholars.com
145
Fig 6 Calibration curve for mono alkyl impurityFig 7 Accuracy studies
Fig 8
www.pharmascholars.com
146
Fig 10 Chromatogram representing precision for PenciclovirFig 11 Chromatogram representing precision studies for mono alkyl impurity
Fig 12 chromatogram representing standard solutions with different column
www.pharmascholars.com
147
Fig 14 Chromatogram for standard solutions with flow decreaseFig 15 Chromatogram for test solutions for flow decrease
Fig 16 Chromatogram representing standard solutions for flow increase
www.pharmascholars.com
148
REFERENCES1. Susan. B., Maryadele Jo.N, Anns, Patrica E, Hecklemen & Joanne FK, The Merck Index, 2001, 13th edition, Monograph No 147, Merck, USA
2. Ch. Venkata Kumar, “A new validated RP HPLC method for determination of Penciclovir in human plasma”, JPRHC, 2010, Vol 2(1), 95 - 102
3. K. Surendra Babu, “New RP HPLC method development and validation for analysis of anti viral drug penciclovir”, IJRPC, 2011, Vol 1(1), 33 – 35
4. www.shodhganga.inflibnet.ac.in, 8/12/14
5. Bacon T.H, “Activity of Penciclovir in antiviral assays against herpes simplex virus”,J Antimicrob. Chemother, 1996, 37(2), 303 – 13
6. M. Narendra kumar, “Simple and reliable stability indicating HPLC method for determination of assay of Famciclovir in drug substance”, Der chemical sinica,,2012,3(2):450-457
7. ICH Harmonizes Tripartite guidelines, validation of analytical procedures: Text and Methodology Q2 (R1), current step 4 version, Nov, 2005, 450 -457