Research Article
CODEN: IJPNL6
Development and optimization of Novel oral self-emulsifying drug delivery system by Box–
Behnken design
approach using Repaglinide as model drug
Rajkumar Boddu
1and K. V. Ramana Murthy
21
Research Scholar, JNTU Hyderabad, Hyderabad, Telangana, India
2
Department of Pharmaceutics, Andhra University College of Pharmacy, Andhra University,
Visakhapatnam, Andhra Pradesh, India
*Corresponding author e-mail:
[email protected]
ABSTRACT
The aim of the present research was to systematically investigate the main, interaction and the quadratic effects of formulation variables on the performance of self-emulsifying drug delivery system (SMEDDS) of Repaglinide using design of experiment. A 15-run Box–Behnken design (BBD) with 3-factors and 3-levels, including 3 replicates at the centre point, was used for fitting a response surface. After the preliminary screening, Maisine 35-1 as oil, Capryol PGMC as surfactant and Acconon C 30 as co-surfactant were taken as independent variables. The dependent factors (responses) were dissolution after 5 min, dissolution after 10 min and. particle size. Coefficients were estimated by regression analysis and the model adequacy was checked by an F-test and the determination coefficient (R2). All the responses were optimized simultaneously by using desirability function.
Our results demonstrated marked main and interaction effects of independent factors on responses. The optimized formulation consisted of 50.82 mg i.e.10.15% (w/w) oil, 250 mg i.e.49.92% (w/w) surfactant and 200 mg i.e. 39.93% (w/w) co-surfactant, and showed 91.0% dissolution after 5 min, about 100.0% dissolution after 10 min, and average micelle size of 49.23 nm. For the optimized formulation, predicted value and experimental value were in close agreement. The BBD facilitated in the better understanding of inherent relation- ship of formulation variables with the responses and in the optimization of repaglinide SMEDDS in relatively time and labor effective manner.
Key words: Box–Behnken design; design of experiment; desirability function; optimization; repaglinide; self-emulsifying drug delivery system.
INTRODUCTION
Oral intake has been the most sought-after route of drug delivery by the patients as well as the manufacturers for the treatment of most diseases. However, recently it has been estimated that from 40 to 70% of active new chemical entities discovered by the pharmaceutical industry today are poorly water-soluble or lipophilic compounds to allow consistent oral absorption of a magnitude sufficient to ensure therapeutic efficacy [1]. The solubility issues complicating the delivery of these new drugs also affect the delivery of many existing drugs [2, 3]. Poorly water-soluble compounds have solubility and dissolution related bioavailability problems [4]. The
absorption of such compounds is typically dissolution rate limited and the dissolution rate is directly proportional to the solubility of the compound. The compounds are typically Biopharmaceutical Classification System (BCS) class II or class IV compounds [5-7]. The rate and extent of absorption of class II compounds is highly dependent on the performance of the formulated product. These drugs can be successfully formulated for oral administration, with formulation design to ensure consistent bioavailability [8-11].
To improve the rate and extent of absorption of such BCS class II compounds solid lipid nanoparticles [12], nano crystal [13], nano suspensions [14], solid
International Journal of Pharmacy
Journal Homepage: http://www.pharmascholars.com
dispersions [15], emulsions, micro emulsions [16], nano emulsions [17], self emulsifying system [18], and liposomes[19] has been reported. Among them, self emulsifying drug delivery systems (SEDDS) is relatively newer lipid-based technological innovations with immense promise to improve the rate and extent of absorption of poorly water-soluble drugs [20-22]. SEDDS are anhydrous homogeneous liquid mixtures, composed of lipids, surfactant, drug, and co surfactants, which spontaneously form transparent and stable micro emulsion upon aqueous dilution with gentle agitation [23, 24].
These formulae owe their self-emulsifying properties to the low free energy requirement for the micro emulsion formation [25]. The spontaneous formation of micro emulsion advantageously presents the drug in a dissolved form and the resultant small globule size provides a large interfacial surface area for drug release and absorption [26]. Some marketed examples from this category are Sandimmune Neoral (Cyclosporine A), Norvir (Ritonavir), Fortovase (Saquinavir), Aptivus (Tipranavir) and Kaletra (lopinavir and ritonavir) [27].
However, SEDDS in the form of liquids or encapsulated in Hard/soft gelatin capsules dosage form provides a more stable and robust dosage form with lower manufacturing costs [28].
Repaglinide (RPG) is a BCS class II oral hypoglycemic agent, which is a commonly prescribed drug management of type 2 diabetes mellitus (also known as non-insulin dependent diabetes mellitus or NIDDM). It is an acidic drug (pKa = 3.68), practically insoluble in water and acidic environment. When it is given orally in healthy people, it absorbs rapidly and completely. its absorption from the gastrointestinal fluids is dissolution rate limited due to poor water solubility of the drug [29]. It is recommended to study the dissolution of RPG at pH 5.0 buffers, but dissolution study at higher pH may not be biorelevant. During high blood glucose level conditions, an anti diabetic drug RPG should show quick and high oral bioavailability. Hence, there is a need for enhancement of the solubility and dissolution rate of RPG irrespective of pH for its improved absorption rate and therapeutic efficacy [30].gives higher and uniform drug dissolution irrespective of pH. RPG when formulated as SEDDS, its effect of pH variability can be reduced and improved dissolution performance can be obtained. To prevent any possible hypoglycemic shock like condition due to fast dissolving SEDDS formulation, dose of drug need to be decreased. The objective of this study was to develop SEDDS formulation of
www.pharmascholars.com
3
85
RPG primarily to increase its solubility and dissolution rate. Formulations were evaluated for various physicochemical parameters including in vitro studies.
MATERIALS AND METHODS
Materials: RPG was obtained from Hetero drugs pvt ltd, India. Acconon C 30 was kindly supplied by Abitec Corporation, USA. Maisine 35-1 and Capryol PGMC was obtained from Gattefosse, France. Hard gelatin capsules were provided by ACG Associated Capsules, India. All the excipients and chemicals (analytical grade) were used as received.
Drug solubility determination: The solubility of RPG in various vehicles was determined by the shake flask method [31]. Briefly, an excess amount of RPG was introduced into 1 g of each vehicle, and mixture was kept in sealed vials. The mixture was then kept in water bath shaker (Remi Equipments, India) for 72 h to reach equilibrium. The equilibrated sample was centrifuged at 5,000 rpm for 15 min using a centrifuge (Remi Equipments, India) and supernatant filtered through 0.45 µm membrane filter (Millipore, India). The concentration of RPG was subsequently quantified using UV-visible spectrophotometer at λmax 242 nm (UV-1700 Shimadzu, Japan).
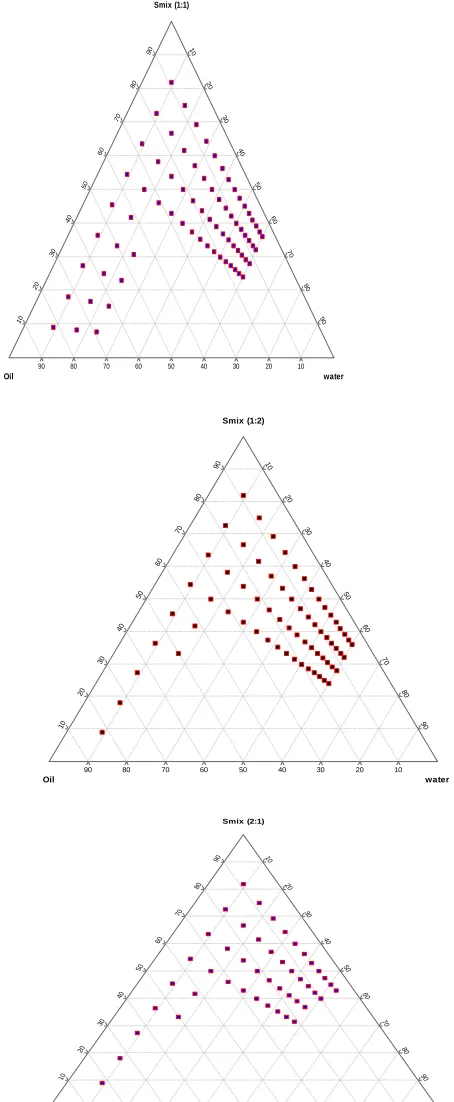
Phase Titration studies for screening: The phase titration studies were carried out by water titration method for constructing the pseudo ternary phase diagrams employing lipid and surfactant/co-surfactant mixture (Smix) in the ratio between 1:9 and
9:1 w/w. The Smix ratio of 1:1, 1:2 and 2:1 were also
explored to delineate the boundaries of nano emulsion region. During titration of lipid and Smix
with water, the mixtures were visually observed for the phase clarity and formation of nano emulsion with transparent bluish dispersion in water. The amount of water at which transparency-to-turbidity transition occur was derived from the weight measurements, and phase diagrams were drawn using Tri plot software.
Optimization of Self emulsifying drug delivery system by Box–Behnken statistical design: Box– Behnken statistical screening design was used to statistically optimize the formulation parameters and evaluate main effects, interaction effects and quadratic effects of the formulation ingredients on the dissolution and droplet size of SNES.
The experimental study was designed based on a three component system: the oil phase A, the surfactant B and the co-surfactant C. The total concentration of the three components was 100%. Oil phase was 10–20%, surfactant was about 30–50 % and co-surfactant was about 30-50%. Based on the previous results obtained from phase diagram, the range of each component was selected as follows: A (50-75mg), B (150–250mg) and C (150–250mg). The particle size, dissolution after 5 min and dissolution after 10 min were used as the responses (dependent variables).The responses of all models formulations were treated by Design-Expert ®software(version
9.0.6.2; Stat-Ease Inc., Minneapolis, MN). Suitable models selected for the designs were linear, 2FI (two-factor interaction), and quadratic models. The best fitting mathematical model was selected based on the comparisons of several statistical parameters including the standard deviation (SD), the multiple correlation coefficients (R2), adjusted multiple
correlation coefficients (adjusted R2) and the
predicted residual sum of square (PRESS), and proved by Design-Expert software. Among them, PRESS indicates how well the model fits the data, and for the chosen model it should be small relative to the other models under consideration [33, 34]. The software selected a set of candidate points as a base design. These included factorial points (high and low level from the constraints on each factor, centers of edges, constraint plane centroids, axial check point and overall centroid). The base design consisted of 15 runs. The optimum formulation of this study was selected to have a droplet size as small as possible (<65 nm), percentage of dissolution at 5min ranging between 75% and 85% and percentage of dissolution at 10 min ranging between 90% and 100%.The design layout presented in the table 1.
Droplet size analysis: The globule size of SEDDS was determined using a photon correlation spectrometer (Zetasizer Nano ZS 90, Malvern Instruments, UK) based on laser light scattering phenomenon, which analyzes the fluctuations in light scattering. Helium-neon gas laser having intensity of 4 mw was the light source. Light scattering was monitored at 25 °C at a 90° angle. SEDDS samples,
www.pharmascholars.com
38
6
diluted 100 times with purified water, were used for globule size analysis.
Determination of self-emulsification time: The self-emulsification time of SEDDS formulations were determined using USP dissolution apparatus (Electrolab, India). Each formulation was added drop wise to 250mL of purified water at 37 ± 0.5 °C. Gentle agitation was provided by a standard stainless steel dissolution paddle rotating at 50 rpm. Emulsification time was assessed visually [35]. The tendency to spontaneously form a transparent or clear or slightly bluish in appearance emulsion was judged “good”, and it was judged “bad” when there was poor or minimal emulsification with large oils droplets present.
In vitro drug release: In-vitro dissolution studies were conducted for the SNEDDS and marketed product of Repaglinide 2mg. Studies conducted using a USP dissolution type-II apparatus (Electrolab, India). With 900 ml of pH 5.0 buffer as the dissolution medium maintained at 37 ± 0.5°C. The paddle speed was adjusted to 75 rpm. At a predetermined time intervals 5, 10, 15, 30, 45, 60 min, an aliquot (five ml) of the samples were collected and replaced with fresh dissolution medium. The collected samples were analyzed for the repaglinide content by UV.
Thermodynamic stability studies SMEDDS: The objective of thermodynamic stability is to evaluate the phase separation and effect of temperature variation on SMEDDS formulations. Repaglinide SMEDDS were diluted with aqueous medium and centrifuged at 15000 rpm for 15 minutes and formulations were observed visually for phase separation. No Phase separation was observed in any sample. Formulations were subjected to freeze thaw cycles (-20°C for 2 days followed by +40°C for 2 days) [36]. No change in the visual description of samples after freeze-thaw cycles.
RESULTS
Solubility studies: Among various tested oils and surfactants, Maisine 35-1 as oil, Capryol PGMC as surfactant and Acconon C 30 as co-surfactant were selected for further study based on best solubility of RPG. The solubility results were presented in the Table 2 and illustrated in figure 1.
maximum solubility, pseudo-ternary diagram was plotted between Maisine 35-1 as oil, Capryol PGMC as surfactant and Acconon C 30 as co-surfactant (Fig. 2) by titration method. The said system i.e. oil: Smix
(1:9) yielded a significant nano emulsion region. Higher concentrations of surfactant is required to produce fine and stable emulsions was due to the fact that smaller the desired globule size, greater the surface area and hence, greater the amount of surfactant required to stabilize the oil globules. Further, titration of Maisine 35-1was conducted at various combinations of Capryol PGMC as surfactant and Acconon C 30 as co-surfactant (i.e., 1:1, 1:2, and 2:1). It was subsequently observed that the combination of Capryol PGMC as surfactant and Acconon C 30 as co-surfactant (1:1) yielded the maximum nano emulsion region formulation of SNEDDS.
Droplet size analysis: Determination of droplet size globule size of all the 15 SNEDDS formulations, prepared as per the experimental design, ranged between 52 and 105nm. Remarkably small globule size was observed at the lower levels of the oil and higher levels of the surfactant. Figure 6 depicts particle size graph of optimized formulation.
Determination of self-emulsification time: The self-emulsification time of SNEDDS formulations were found less than 1min. All 15 SNEDDS formulations spontaneously form a transparent or slightly bluish in appearance emulsion which was judged “good” emulsion.
Box–Behnken Statistical analysis: The system components were selected based on the ability of the preliminary prepared pseudo ternary system to form nano emulsion containing the maximum oil content. In order to rapidly obtain the optimal drug loaded SNES, Box–Behnken statistical design was applied in this study. Maisine 35-1 as oil, Capryol PGMC as surfactant and Acconon C 30 as co-surfactant were chosen as formulation variables and particle size, dissolution after 5 min and dissolution after 10 min were selected as response variables (Table 1). The responses of these formulations are summarized in Table 3. The independent and response variables were related using poly-nomial equation with statistical analysis through Design-Expert software. The approximation of response values based on the quadratic model was most suitable because its PRESS was smallest. A positive sign of coefficient indicates a synergistic effect while a negative term indicates an antagonistic effect upon the response [37].
All the data were fitted to the second order quadratic model and validation of the model was carried out by analysis of variance (ANOVA) test, lack of fit test and correlation coefficient (R2). Various statistical evaluations of models for each response are depicted in the Tables 4 and 5. ANOVA was used to test the statistical significance of the ratio of mean square variation due to regression and mean square residual error. As shown in Table 4, at 5% significance level, it was observed that for responses Y1, Y2 and Y3, quadratic fitting was significant ( p-value <0.05. The corresponding large value of F indicates that most of the variation in the response can be explained by the regression equation. At 5% significance level, the model was considered to be significant, if significance p-value is less than 0.5 and carried in significant lack of fit. The lack-of-fit measures the failure of the model to represent data in the experimental domain at points which are not included in the regression. In significant lack of fit is one of the desirable statistical parameter to prove the model fitting on the responses. From Table 4, it can be seen that all models show in significant lack of fit. While calculating the correlation coefficient (R2) for the
responses Y1, Y2 , Y3, The "Pred R-Squared" is in reasonable agreement with the "Adj R-Squared";i.e. the difference is less than 0.2 (Table 5). The corresponding coefficients which showed the quantitative effects of independent variables (X1, X2, and X) and their interactions on the responses are shown in the Tables 6. The coefficients (Factor intercepts) with more than one term and those with the higher order terms indicate the interactions and quadratic effects, respectively. The positive sign represents the synergistic effect of the factor where as negative sign represents the antagonist effect of the factor on the response.
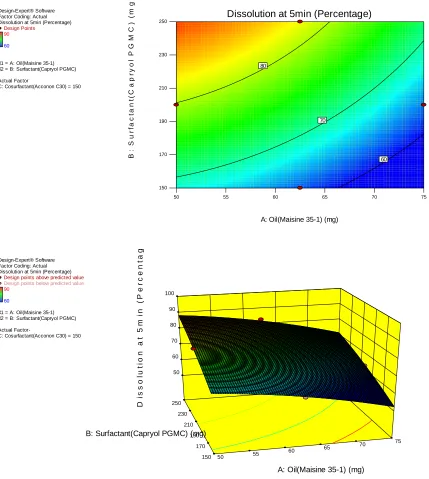
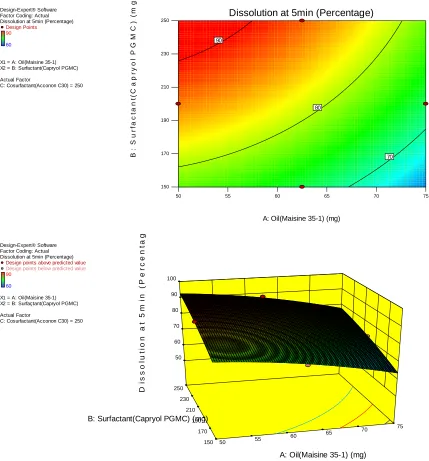
Response Surface Analysis: The three-dimensional response surface plots and two-dimensional contour plots are graphical representations of the regression equation and express two independent variables at once against the response (Figs.3 to 5). Thus, the statistically significant relationship between the dependent and independent variables was further interpreted by using response surface analysis. In all the response surface and contour plots, the factors showing the least significant values were fixed at their three levels (low, centre and high levels). Figure 3A to 3C shows the response surface and contour plots for effects of Oil (Maisine 35-1) and surfactant (Capryol PGMC) on dissolution at 5min at all three levels of co-surfactant (Acconon C 30). From Tables 6 and 7, it can be seen that all independent variables showed significant main effects ( p<0.05) for dissolution at 5min; The interaction effects were not
very pronounced (0.05<p<0.6), though the amounts of oil and surfactant showed significant quadratic effects on dissolution on 5 min ( p<0.1). With the increasing Co surfactant (coefficient is positive) in the formulation, dissolution at 5min increased. This phenomenon may be explained by the availability of more surfactant for the formation of more closely packed surfactant film with reduced curvature at the oil/water interface. The decrease in the dissolution at 5min is more marked with decreasing amount of co-surfactant. Figure 3A to 3C exhibits the response surface and contour plots Response Surface and Contour Plots Showing the effects of Oil and surfactant on Dissolution at 5 min) at all level of co surfactant. High percent of drug release is preferable for the sake of reproducible bioavailability.
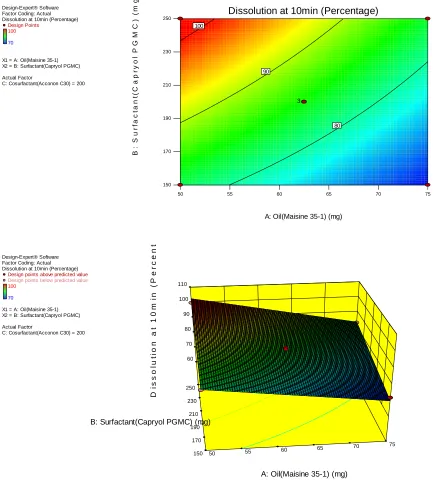
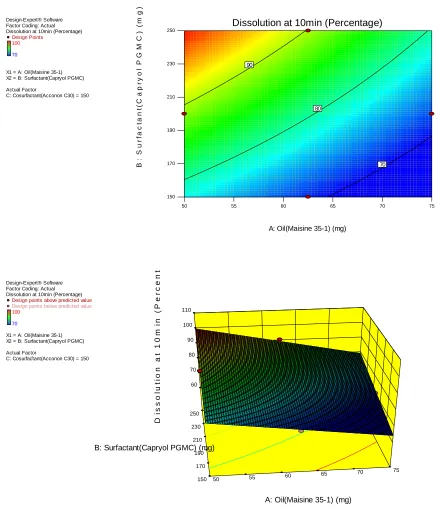
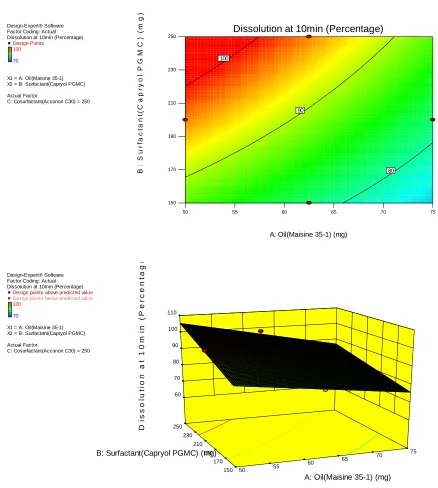
Figure 4A to 4C shows the response surface and contour plots for effects of Oil (Maisine 35-1) and surfactant (Capryol PGMC) on dissolution at 10 min at all three levels of co-surfactant (Acconon C 30). From Tables 6 and 7, it can be seen that all independent variables showed significant main effects ( p<0.05) for dissolution at 10 min; The interaction effects were not very pronounced (0.07<p<0.58), though the amounts of oil and surfactant showed significant quadratic effects on dissolution on 10 min ( p<0.1). With the increasing Co surfactant (coefficient is positive) in the formulation, dissolution at 10 min increased. This phenomenon may be explained by the availability of more surfactant for the formation of more closely packed surfactant film with reduced curvature at the oil/water interface. The decrease in the dissolution at 10min is more marked with decreasing amount of co-surfactant. Figure 4A to 4C exhibits the response surface and contour plots Response Surface and Contour Plots Showing the effects of Oil and surfactant on Dissolution at 10 min at all level of co surfactant. High percent of drug release is preferable for the sake of reproducible bioavailability.
Figure 5A to 5C shows the response surface and contour plots for effects of Oil (Maisine 35-1) and surfactant (Capryol PGMC) on particle size at all three levels of co-surfactant (Acconon C 30). From Tables 6 and 7, it can be seen that all independent variables showed significant main effects (p<0.05) for particle size; The interaction effects were not very pronounced (0.05<p<1.0), though the amounts of oil and surfactant showed significant quadratic effects on particle size ( p<0.1). With the increasing Co surfactant (coefficient is negative) in the formulation, particle size decreased. This phenomenon may be explained by the availability of more surfactant for the formation of more closely packed surfactant film
with reduced curvature at the oil/water interface. The increase in the particle size is more marked with decreasing amount of co-surfactant. Figure 5A to 5C exhibits the response surface and contour plots Response Surface and Contour Plots Showing the effects of Oil and surfactant on particle size at all level of co surfactant. High percent of drug release is preferable for the sake of reproducible bioavailability.
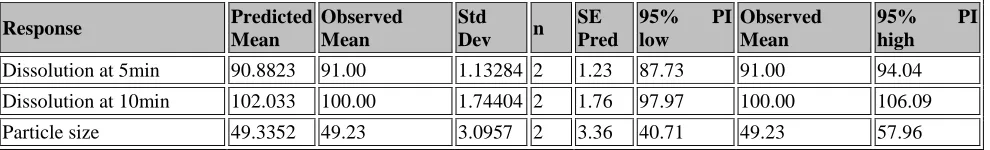
Optimization by Using Desirability Function: After generating the model polynomial equations to relate the dependent and independent variables, the process was optimized for all three responses simultaneously by using desirability function. Multiple responses including Y1, Y2, and Y3 were transformed into desirability scale. Factors were set within the range. Constraints were set to the all the responses. Y1 and Y2 were to be maximized, while Y3 were set to be minimized. Equal weight and importance were provided to all the responses. The global desirability value was calculated by combining all the individual desirability functions as the geometric mean by using extensive grid and feasibility search over the domain. The suggested optimized formulation consisted of 50.82 mg oil, 250 mg surfactant and 200 mg co-surfactant with the corresponding Desirability (D) value of 0.922. This factor level combination predicted the response as Y1=90.88%, Y2=102%, and Y3=49.33nm. To confirm the model adequacy for the prediction, two batches of the optimized formulations were prepared and all the responses were evaluated for each formulation (Table 7).
The optimized Repaglinide-loaded SMEDDS had particle size of 49.23 nm, dissolution after 5min of 91.0% and dissolution after 10 min of 100.0%, respectively. It can be concluded that the experimental values were in close agreement with 3 predicted values, indicating the success of the design to evaluate and optimize the SNEDDS formulation.
CONCLUSION
In this work, the effects of three formulation factors (Maisine 35-1 as oil, Capryol PGMC as surfactant and Acconon C 30 as co-surfactant) on the three main characteristics Repaglinide SNEDDS were investigated using 3-level, 3-factor BBD. Of the factors studied, all three factors showed significant effect on particle size, dissolution after 5min and dissolution after 10 min. The amount of oil and surfactant used had main effect on all three factors. The formulation factors also had interaction and quadratic effects on the responses studied. An
optimized formulation was successfully developed by using desirability function, and the experimental values were found to be in close agreement with the predicted values. Furthermore, in vitro dissolution study of the optimized formulation revealed significant increase in release (about 100% release
after 10 min). Therefore, it was concluded that BBD facilitated in the better understanding of inherent relationship of formulation variables with the responses and in the optimization of Repaglinide SMEDDS in relatively cost, time and labor effective manner, as demonstrated by the present study.
Table1: Deign layout
Name Units Minimum Maximum Coded Values Mean
A-Oil(Maisine 35-1) mg 50 75 -1.000=50 1.000=75 62.5
B-Surfactant(Capryol PGMC) mg 150 250 -1.000=150 1.000=250 200 C-Co surfactant(Acconon C30) mg 150 250 -1.000=150 1.000=250 200
Response variables: Y1 Dissolution after 5 min and Y2 Dissolution after 10min, Y3: Particle size
Table 2: Solubility of Repaglinide in various oils and surfactant/co surfactant
Name of the surfactant Solubility of the drug(mg/ml) Parts of the solvent(in ml) required for 1part drug
WATER 0 0.00
ISOPROPYL MYRISTATE (Oil) 3.41 293.36
SOYABEAN Oil (Oil) 7.76 128.84
CAPTEX355 (SURFACTANT) 7.80 128.25
CAPROL MPGO (SURFACTANT) 16.44 60.82
CREMOPHOR A25(SURFACTANT) 17.94 55.74
CAPMUL PG-8 (Oil) (SURFACTANT) 18.35 54.49
CAPTEX8000(SURFACTANT) 18.85 53.04
CAPROL ET(SURFACTANT) 22.41 44.62
CAPTEX 200(SURFACTANT) 29.74 33.63
TWEEN 80(SURFACTANT) 33.09 30.22
PEG-400(SURFACTANT) 34.38 29.08
SPAN80(SURFACTANT) 40.47 24.71
CAPMUL MCM (OIL) 40.88 24.46
CAPTEX350(SURFACTANT) 65.76 15.21
LABRAFIL M1944CS(SURFACTANT) 72.76 13.74
MAISINE35-1(OIL) 74.71 13.39
ACCONON C30(SURFACTANT) 100.92 9.91
CAPRYOL PGMC(SURFACTANT) 279.12 3.58
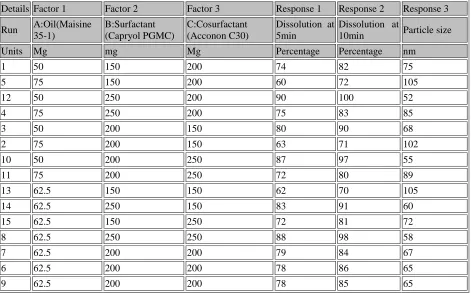
Table 3: Observed Responses for different formulations of Box–Behnken design.
Details Factor 1 Factor 2 Factor 3 Response 1 Response 2 Response 3 Run A:Oil(Maisine
35-1)
B:Surfactant (Capryol PGMC)
C:Cosurfactant (Acconon C30)
Dissolution at 5min
Dissolution at
10min Particle size
Units Mg mg Mg Percentage Percentage nm
1 50 150 200 74 82 75
5 75 150 200 60 72 105
12 50 250 200 90 100 52
4 75 250 200 75 83 85
3 50 200 150 80 90 68
2 75 200 150 63 71 102
10 50 200 250 87 97 55
11 75 200 250 72 80 89
13 62.5 150 150 62 70 105
14 62.5 250 150 83 91 60
15 62.5 150 250 72 81 72
8 62.5 250 250 88 98 58
7 62.5 200 200 79 84 67
6 62.5 200 200 78 86 65
9 62.5 200 200 78 85 65
Table 4: Analysis of variance for Response Surface Quadratic model: Response 1: Dissolution at 5min
Source Sum of
Squares df
Mean Square
F Value
p-value Prob > F
Model 1194.52 9 132.72 103.42 < 0.0001
A-Oil(Maisine 35-1) 465.13 1 465.13 362.44 < 0.0001 B-Surfactant(Capryol PGMC) 578.00 1 578.00 450.39 < 0.0001 C-Cosurfactant(Acconon C30) 120.13 1 120.13 93.60 0.0002
AB 0.25 1 0.25 0.19 0.6774
AC 1.00 1 1.00 0.78 0.4178
BC 6.25 1 6.25 4.87 0.0784
A^2 17.33 1 17.33 13.51 0.0144
B^2 7.41 1 7.41 5.77 0.0614
C^2 1.64 1 1.64 1.28 0.3094
Residual 6.42 5 1.28
Lack of Fit 5.75 3 1.92 5.75 0.1517
Pure Error 0.67 2 0.33
Corrected Total 1200.93 14
Note: Values of "Prob > F" less than 0.0500 indicate model terms are significant.
Response 2: Dissolution at 10min
Source Sum of
Squares df
Mean Square
F Value
p-value Prob > F
Model 1219.00 6 203.17 66.79 < 0.0001
A-Oil(Maisine 35-1) 496.13 1 496.13 163.11 < 0.0001
B-Surfactant(Capryol PGMC) 561.12 1 561.12 184.48 < 0.0001
C-Cosurfactant(Acconon C30) 144.50 1 144.50 47.51 0.0001
AB 12.25 1 12.25 4.03 0.0797
AC 1.00 1 1.00 0.33 0.5821
BC 4.00 1 4.00 1.32 0.2846
Residual 24.33 8 3.04
Lack of Fit 22.33 6 3.72 3.72 0.2269
Pure Error 2.00 2 1.00
Corrected Total 1243.33 14
Response 3: Particle size:
Source Sum of
Squares df
Mean Square
F Value
p-value Prob > F
Model 4541.82 9 504.65 52.66 0.0002
A-Oil(Maisine 35-1) 2145.13 1 2145.13 223.84 < 0.0001
B-Surfactant(Capryol PGMC) 1300.50 1 1300.50 135.70 < 0.0001
C-Cosurfactant(Acconon C30) 465.13 1 465.13 48.53 0.0009
AB 2.25 1 2.25 0.23 0.6485
AC 0.000 1 0.000 0.000 1.0000
BC 240.25 1 240.25 25.07 0.0041
A^2 310.26 1 310.26 32.37 0.0023
B^2 72.03 1 72.03 7.52 0.0407
C^2 49.64 1 49.64 5.18 0.0719
Residual 47.92 5 9.58
Lack of Fit 45.25 3 15.08 11.31 0.0823
Pure Error 2.67 2 1.33
Corrected Total 4589.73 14
Table 5: Correlation coefficients for responses Response1: Dissolution at 5min
Std. Dev. 1.13 R-Squared 0.9947
Mean 76.07 Adj R-Squared 0.9850
C.V. % 1.49 Pred R-Squared 0.9221
PRESS 93.50 Adeq Precision 34.866
Response 2: Dissolution at 10min
Std. Dev. 1.74 R-Squared 0.9804
Mean 84.67 Adj R-Squared 0.9658
C.V. % 2.06 Pred R-Squared 0.9036
PRESS 119.84 Adeq Precision 27.279
Response 3: Particle size:
Std. Dev. 3.10 R-Squared 0.9896
Mean 74.87 Adj R-Squared 0.9708
C.V. % 4.13 Pred R-Squared 0.8409
PRESS 730.00 Adeq Precision 23.045
Table 6: Final Equation in Terms of Coded Factors:
Dissolution at 5min=+78.33-7.63* A+8.50* B+3.88* C-0.25* B+0.50* AC-1.25* BC-2.17* A^2-1.42 * B^2-0.67* C^2
Dissolution at 10min=+84.67-7.88* A+8.37* B+4.25* C-1.75* AB+0.50* AC-1.00* BC
Particle size =+65.67+16.38* A-12.75* B-7.63* C+0.75* AB+6.525E-017* AC+7.75* BC+9.17* A^2+4.42* B^2+3.67* C^2
Table 7:Predicted and Measured Values of Responses with confidence interval:
Response Predicted
Mean
Observed Mean
Std Dev n
SE Pred
95% PI low
Observed Mean
95% PI high
Dissolution at 5min 90.8823 91.00 1.13284 2 1.23 87.73 91.00 94.04 Dissolution at 10min 102.033 100.00 1.74404 2 1.76 97.97 100.00 106.09
Particle size 49.3352 49.23 3.0957 2 3.36 40.71 49.23 57.96
Figure 1: Solubility graph of Repaglinide in various oils and surfactant/co surfactant.
Smix (1:1)
Oil water
90 10
90
80 20
80
70 30
70
60
40
60
50
50
50
40 60
40
30
70
30
20 80
20
10
90
10
Smix (1:2)
Oil water
90 10
90
80 20
80
70 30
70
60 40
60
50 50
50
40 60
40
30 70
30
20 80
20
10 90
10
Smix (2:1)
Oil water
90 10
90
80 20
80
70 30
70
60 40
60
50 50
50
40 60
40
30 70
30
20 80
20
10 90
10
Figure 2: The pseudo ternary phase diagrams of micro emulsion consist of Maisine 35-1 as
oil, Capryol PGMC as surfactant and Acconon C 30 as co-surfactant at different ratios.
Design-Expert® Software Factor Coding: Actual Dissolution at 5min (Percentage)
Design Points
90
60
X1 = A: Oil(Maisine 35-1) X2 = B: Surfactant(Capryol PGMC)
Actual Factor
C: Cosurfactant(Acconon C30) = 200
50 55 60 65 70 75
150 170 190 210 230 250
Dissolution at 5min (Percentage)
A: Oil(Maisine 35-1) (mg)
B
:
S
u
r
fa
c
ta
n
t(
C
a
p
r
y
o
l
P
G
M
C
)
(
m
g
)
60 70
80 90
3
Design-Expert® Software Factor Coding: Actual Dissolution at 5min (Percentage)
Design points above predicted value
Design points below predicted value
90
60
X1 = A: Oil(Maisine 35-1) X2 = B: Surfactant(Capryol PGMC)
Actual Factor
C: Cosurfactant(Acconon C30) = 200
150 170 190 210 230 250
50 55
60 65
70 75
50 60 70 80 90 100
D
is
s
o
lu
ti
o
n
a
t
5
m
in
(
P
e
r
c
e
n
ta
g
e
)
A: Oil(Maisine 35-1) (mg) B: Surfactant(Capryol PGMC) (mg)
Figure 3A: Response Surface and Contour Plots Showing the Effects of Oil and surfactant
on Dissolution at 5min (Co Surfactant is Constant at centre point i.e.200mg).
Design-Expert® Software Factor Coding: Actual Dissolution at 5min (Percentage)
Design Points
90
60
X1 = A: Oil(Maisine 35-1) X2 = B: Surfactant(Capryol PGMC)
Actual Factor
C: Cosurfactant(Acconon C30) = 150
50 55 60 65 70 75
150 170 190 210 230
250 Dissolution at 5min (Percentage)
A: Oil(Maisine 35-1) (mg)
B
:
S
u
r
fa
c
ta
n
t(
C
a
p
r
y
o
l
P
G
M
C
)
(
m
g
)
60 70
80
Design-Expert® Software Factor Coding: Actual Dissolution at 5min (Percentage)
Design points above predicted value
Design points below predicted value
90
60
X1 = A: Oil(Maisine 35-1) X2 = B: Surfactant(Capryol PGMC)
Actual Factor
C: Cosurfactant(Acconon C30) = 150
150 170 190 210 230 250
50 55
60 65
70 75
50 60 70 80 90 100
D
is
s
o
lu
ti
o
n
a
t
5
m
in
(
P
e
r
c
e
n
ta
g
e
)
A: Oil(Maisine 35-1) (mg) B: Surfactant(Capryol PGMC) (mg)
Figure 3B: Response Surface and Contour Plots Showing the Effects of Oil and surfactant
on Dissolution at 5min (Co Surfactant is Constant at lowest point i.e.150mg).
Design-Expert® Software Factor Coding: Actual Dissolution at 5min (Percentage)
Design Points
90
60
X1 = A: Oil(Maisine 35-1) X2 = B: Surfactant(Capryol PGMC)
Actual Factor
C: Cosurfactant(Acconon C30) = 250
50 55 60 65 70 75
150 170 190 210 230
250 Dissolution at 5min (Percentage)
A: Oil(Maisine 35-1) (mg)
B
:
S
u
r
fa
c
ta
n
t(
C
a
p
r
y
o
l
P
G
M
C
)
(
m
g
)
70 80
90
Design-Expert® Software Factor Coding: Actual Dissolution at 5min (Percentage)
Design points above predicted value
Design points below predicted value
90
60
X1 = A: Oil(Maisine 35-1) X2 = B: Surfactant(Capryol PGMC)
Actual Factor
C: Cosurfactant(Acconon C30) = 250
150 170 190 210 230 250
50 55
60 65
70 75
50 60 70 80 90 100
D
is
s
o
lu
ti
o
n
a
t
5
m
in
(
P
e
r
c
e
n
ta
g
e
)
A: Oil(Maisine 35-1) (mg) B: Surfactant(Capryol PGMC) (mg)
Figure 3C: Response Surface and Contour Plots Showing the Effects of Oil and surfactant
on Dissolution at 5min (Co Surfactant is Constant at highest point i.e.250mg).
Design-Expert® Software Factor Coding: Actual Dissolution at 10min (Percentage)
Design Points
100
70
X1 = A: Oil(Maisine 35-1) X2 = B: Surfactant(Capryol PGMC)
Actual Factor
C: Cosurfactant(Acconon C30) = 200
50 55 60 65 70 75
150 170 190 210 230
250 Dissolution at 10min (Percentage)
A: Oil(Maisine 35-1) (mg)
B
:
S
u
r
fa
c
ta
n
t(
C
a
p
r
y
o
l
P
G
M
C
)
(
m
g
)
80 90
100
3
Design-Expert® Software Factor Coding: Actual Dissolution at 10min (Percentage)
Design points above predicted value
Design points below predicted value
100
70
X1 = A: Oil(Maisine 35-1) X2 = B: Surfactant(Capryol PGMC)
Actual Factor
C: Cosurfactant(Acconon C30) = 200
150 170 190 210 230 250
50 55 60
65 70 75
60 70 80 90 100 110
D
is
s
o
lu
ti
o
n
a
t
1
0
m
in
(
P
e
r
c
e
n
ta
g
e
)
A: Oil(Maisine 35-1) (mg) B: Surfactant(Capryol PGMC) (mg)
Figure 4A: Response Surface and Contour Plots Showing the Effects of Oil and surfactant
on Dissolution at 10 min (Co Surfactant is Constant at centre point i.e.200mg).
Design-Expert® Software Factor Coding: Actual Dissolution at 10min (Percentage)
Design Points
100
70
X1 = A: Oil(Maisine 35-1) X2 = B: Surfactant(Capryol PGMC)
Actual Factor
C: Cosurfactant(Acconon C30) = 150
50 55 60 65 70 75
150 170 190 210 230
250 Dissolution at 10min (Percentage)
A: Oil(Maisine 35-1) (mg)
B
:
S
u
r
fa
c
ta
n
t(
C
a
p
r
y
o
l
P
G
M
C
)
(
m
g
)
70 80
90
Design-Expert® Software Factor Coding: Actual Dissolution at 10min (Percentage)
Design points above predicted value
Design points below predicted value
100
70
X1 = A: Oil(Maisine 35-1) X2 = B: Surfactant(Capryol PGMC)
Actual Factor
C: Cosurfactant(Acconon C30) = 150
150 170 190 210 230 250
50 55 60 65
70 75
60 70 80 90 100 110
D
is
s
o
lu
ti
o
n
a
t
1
0
m
in
(
P
e
r
c
e
n
ta
g
e
)
A: Oil(Maisine 35-1) (mg) B: Surfactant(Capryol PGMC) (mg)
Figure 4B: Response Surface and Contour Plots Showing the Effects of Oil and surfactant
on Dissolution at 10 min (Co Surfactant is Constant at lowest point i.e.150mg).
Design-Expert® Software Factor Coding: Actual Dissolution at 10min (Percentage)
Design Points
100
70
X1 = A: Oil(Maisine 35-1) X2 = B: Surfactant(Capryol PGMC)
Actual Factor
C: Cosurfactant(Acconon C30) = 250
50 55 60 65 70 75
150 170 190 210 230
250 Dissolution at 10min (Percentage)
A: Oil(Maisine 35-1) (mg)
B
:
S
u
r
fa
c
ta
n
t(
C
a
p
r
y
o
l
P
G
M
C
)
(
m
g
)
80 90
100
Design-Expert® Software Factor Coding: Actual Dissolution at 10min (Percentage)
Design points above predicted value
Design points below predicted value
100
70
X1 = A: Oil(Maisine 35-1) X2 = B: Surfactant(Capryol PGMC)
Actual Factor
C: Cosurfactant(Acconon C30) = 250
150 170 190 210 230 250
50 55
60 65
70 75
60 70 80 90 100 110
D
is
s
o
lu
ti
o
n
a
t
1
0
m
in
(
P
e
r
c
e
n
ta
g
e
)
A: Oil(Maisine 35-1) (mg) B: Surfactant(Capryol PGMC) (mg)
Figure 4C: Response Surface and Contour Plots Showing the Effects of Oil and surfactant
on Dissolution at 10 min (Co Surfactant is Constant at Highest point i.e.250mg).
Design-Expert® Software Factor Coding: Actual Particle size (nm)
Design Points
105
52
X1 = A: Oil(Maisine 35-1) X2 = B: Surfactant(Capryol PGMC)
Actual Factor
C: Cosurfactant(Acconon C30) = 200
50 55 60 65 70 75
150 170 190 210 230
250 Particle size (nm)
A: Oil(Maisine 35-1) (mg)
B
:
S
u
r
fa
c
ta
n
t(
C
a
p
r
y
o
l
P
G
M
C
)
(
m
g
)
50
51.9675
54.9706
60
70 80
90
100
3
Design-Expert® Software Factor Coding: Actual Particle size (nm)
Design points above predicted value
Design points below predicted value
105
52
X1 = A: Oil(Maisine 35-1) X2 = B: Surfactant(Capryol PGMC)
Actual Factor
C: Cosurfactant(Acconon C30) = 200
150 170 190 210 230 250
50 55
60 65
70 75 40
60 80 100 120
P
a
r
ti
c
le
s
iz
e
(
n
m
)
A: Oil(Maisine 35-1) (mg) B: Surfactant(Capryol PGMC) (mg)
Figure 5A: Response Surface and Contour Plots Showing the Effects of Oil and surfactant
on particle size (Co Surfactant is Constant at centre point i.e.200mg).
Design-Expert® Software Factor Coding: Actual Particle size (nm)
Design Points
105
52
X1 = A: Oil(Maisine 35-1) X2 = B: Surfactant(Capryol PGMC)
Actual Factor
C: Cosurfactant(Acconon C30) = 250
50 55 60 65 70 75
150 170 190 210 230
250 Particle size (nm)
A: Oil(Maisine 35-1) (mg)
B
:
S
u
r
fa
c
ta
n
t(
C
a
p
r
y
o
l
P
G
M
C
)
(
m
g
)
54.9706
60 70 80
90
Design-Expert® Software Factor Coding: Actual Particle size (nm)
Design points above predicted value
Design points below predicted value
105
52
X1 = A: Oil(Maisine 35-1) X2 = B: Surfactant(Capryol PGMC)
Actual Factor
C: Cosurfactant(Acconon C30) = 250
150 170 190 210 230 250
50 55
60 65
70 75
40 60 80 100 120 140
P
a
r
ti
c
le
s
iz
e
(
n
m
)
A: Oil(Maisine 35-1) (mg) B: Surfactant(Capryol PGMC) (mg)
Figure 5B: Response Surface and Contour Plots Showing the Effects of Oil and surfactant
on particle size (Co Surfactant is Constant at highest point i.e.250mg).
Design-Expert® Software Factor Coding: Actual Particle size (nm)
Design Points
105
52
X1 = A: Oil(Maisine 35-1) X2 = B: Surfactant(Capryol PGMC)
Actual Factor
C: Cosurfactant(Acconon C30) = 150
50 55 60 65 70 75
150 170 190 210 230
250 Particle size (nm)
A: Oil(Maisine 35-1) (mg)
B
:
S
u
r
fa
c
ta
n
t(
C
a
p
r
y
o
l
P
G
M
C
)
(
m
g
)
54.9706
60
70
80
90
100
Design-Expert® Software Factor Coding: Actual Particle size (nm)
Design points above predicted value
Design points below predicted value
105
52
X1 = A: Oil(Maisine 35-1) X2 = B: Surfactant(Capryol PGMC)
Actual Factor
C: Cosurfactant(Acconon C30) = 150
150 170 190 210 230 250
50 55
60 65 70
75 40
60 80 100 120 140
P
a
r
ti
c
le
s
iz
e
(
n
m
)
A: Oil(Maisine 35-1) (mg) B: Surfactant(Capryol PGMC) (mg)
Figure 5C: Response Surface and Contour Plots Showing the Effects of Oil and surfactant
on particle size (Co Surfactant is Constant at lowest point i.e.150mg).
Figure 6: Particle size distribution graph of optimized formulation
REFERENCES
1. H. Grohganz, P.A. Priemel, K. Lobmann, L.H. Nielsen, R. Laitinen, A. Mullertz, G. Van den Mooter, T. Rades, Expert Opin. Drug Deliv. 11 (2014) 977.
2.K. Noh, B.S. Shin, K.I. Kwon, H.Y. Yun, E. Kim, T.C. Jeong, W. Kang, Arch. Pharm. Res. (2014) doi:10.1007/s12272-014-0350-4
3.C.J.H Porter, N.L. Trevaskis, W.N. Charman, Nat. Rev. Drug Discov. 6 (2007) 231.
4. B. Morakul, J. Suksiriworapong, M.T. Chomnawang, P. Langguth, V.B. Junyaprasert, Eur. J. Pharm. Biopharm. (2014) doi:10.1016/j.ejpb.2014.08.013.
5. S. Kumar, R. Jog, J. Shen, B. Zolnik, N. Sadrieh, D.J. Burgess, J. Pharm. Sci. (2014) doi:10.1002/jps.24155. 6. H. Li, L. Dong, Y. Liu, G. Wang, G. Wang, Y. Qiao, Int. J. Pharm. 466 (2014) 133.
7. B. Tarate, R. Chavan, A.K. Bansal, Recent Pat. Drug Deliv. Formul. 8 (2014) 126. 8.K.B. Shah, P.G. Patel, A. Khairuzzaman, R.A. Bellantone, Int. J. Pharm. 468 (2014) 64. 9. A. Semalty, Expert Opin. Drug Deliv. (2014) doi:10.1517/17425247.2014.916271.
10. A.H. Najafabadi, M. Abdouss, S. Faghihi, Mater. Sci. Eng. C Mater. Biol. Appl. 41(2014) 91.
11. M. Mahjour, F. Kesisoglou, M. Cruanes, W. Xu, D. Zhang, T.J. Maguire, L.A. Rosen, A.C. Templeton, M.H. Kress, J. Pharm. Sci. 103 (2014) 1811.
12.T. Sun, Y.S. Zhang, B. Pang, D.C. Hyun, M. Yang, Y. Xia. Angew. Chem. Int. Ed. Engl. 53 (2014) 12320. 13. A. Homayouni, F. Sadeghi, J. Varshosaz, H.A. Garekani, A. Nokhodchi, Eur. J. Pharm. Biopharm. 88 (2014) 261.
14. Q. Yao, X. Tao, B. Tian, Y. Tang, Y. Shao, L. Kou, J. Gou, X. Li, T. Yin, X. Tang, Colloids Surf. B Biointerfaces. 113 (2014) 92.
15. S. Verma, V.S. Rudraraju, AAPS PharmSciTech. 15 (2014) 641.
16. X. Zhang, Y. Wu, Y. Hong, X. Zhu, L. Lin, Q. Lin, Drug Deliv.(2014) doi:10.3109/10717544.2014.898713. 17.M. Wulff-Perez, F.J. Pavón, A. Martin-Rodriguez, J.D. Vicente, F. Alen, F.R. de Fonseca, M.J. Galvez-Ruiz, A. Serrano, Nanomedicine (2014) doi: 10.2217/nnm.14.35.
18. X. Qi, J. Qin, N. Ma, X. Chou, Z. Wu, Int. J. Pharm. 472 (2014) 40.
19. R. Rezaei-Sadabady, A. Eidi, N. Zarghami, A. Barzegar, Artif. Cells Nanomed.Biotechnol. (2014) doi:10.3109/21691401.2014.926456
20. S.K. Singh, P.R. Verma, B. Razdan, Drug Dev. Ind. Pharm. 36 (2010) 933.
21. B. Singh, S. Bandopadhyay, R. Kapil, R. Singh, O. Katare, Crit. Rev. Ther. Drug Carrier Syst. 26 (2009) 427. 22. A.G. Agrawal, Ashok Kumar, P.S. Gide, Arch. Pharm. Res. (2014) doi:10.1007/s12272-014-0497-z.
23. A.A. Shahba, K. Mohsin, F.K. Alanazi, AAPS PharmSciTech. 13 (2012) 967.
24. A.G. Agrawal, Ashok Kumar, P.S. Gide, Drug Dev. Ind. Pharm. (2014) doi:10.3109/03639045.2014.886695 25 K.A. Soliman, H.K. Ibrahim, M.M. Ghorab, J. Disper. Sci. Technol. 33 (2012) 1127.
26. D. Sakloetsakun, S. Dunnhaupt, J. Barthelmes, G. Perera, A. Bernkop-Schnurch, Int. J. Biol. Macromol. 61 (2013) 363.
27 Y. Weerapol, S. Limmatvapirat, J. Nunthanid, P. Sriamornsak, AAPS PharmSciTech. 15 (2014) 456. 28. S. Rao, A. Tan, B.J. Boyd, C.A. Prestidge, Nanomedicine (2014) doi:10.2217/nnm.14.37.
29.A.M. Aly, M.K. Qato, M.O. Ahmad, Pharm. Tech. 27 (2003) 54. 30. S.S. Kushare, S.G. Gattani, J. Pharm. Pharmacol. 65 (2013) 79.
31. Y. Wang, J. Sun, T. Zhang, H. Liu, F. He, Z. He, Drug Dev. Ind. Pharm. 37 (2011) 1225.
32. S. Shanmugam, R. Baskaran, P. Balakrishnan, P. Thapa, C.S. Yong, B.K. Yoo, Eur. J. Pharm. Biopharm. 79 (2011) 250.
33. G.E.P. Box, D.W. Behnken, Some new three level designs for the study of quantitative variables, Technometrics 2 (4) (1960) 455–475.
34. H. Chaudhary, K. Kohli, S. Amin, P. Rathee, V. Kumar, Optimization and formulation design of gels of Diclofenac and Curcumin for transdermal drug delivery by Box–Behnken statistical design, J. Pharm. Sci. 100 (2) (2011) 580–593.
35. A. Bajaj, M.R. Rao, I. Khole, G. Munjapara, Drug Dev. Ind. Pharm. 39 (2013) 635.
36. Lucas T, Bishara R, Seevers R. A stability program for the distribution of drug products. Pharma Tech. 2004; 68-71.
37. Y.B. Huang, Y.H. Tsai, S.H. Lee, J.S. Chang, P.C. Wu, Optimization of pH-independent release of nicardipine hydrochloride extended-release matrix tablets using response surface methodology, Int.J.Pharm.289 (2005)87–95.